Deck 8: Economic Growth
ملء الشاشة (f)
سؤال
Figure 8-1 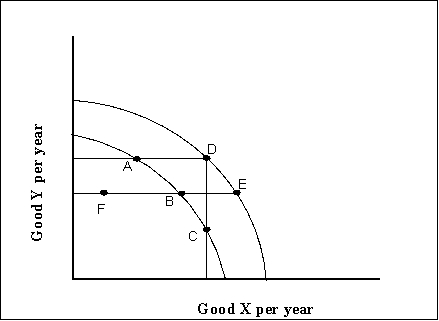
Refer to Figure 8-1. A cyclical increase in real GDP is represented by a movement
A) from D to C.
B) from D to E.
C) from F to A.
D) from A to B.
Refer to Figure 8-1. A cyclical increase in real GDP is represented by a movement
A) from D to C.
B) from D to E.
C) from F to A.
D) from A to B.
سؤال
سؤال
سؤال
سؤال
سؤال
سؤال
Figure 8-2 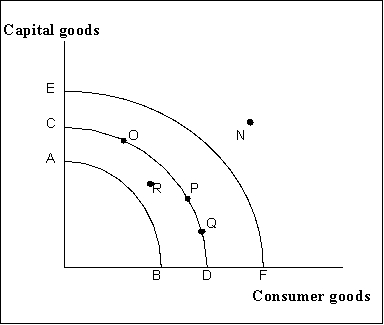
Refer to Figure 8-2. Assume that a nation is operating on production possibilities curve CD. Economic growth is best illustrated by a
A) shift from curve CD to curve AB.
B) shift from curve CD to curve EF.
C) movement from point Q to point O on the frontier CD.
D) movement from point R inside the frontier CD to point P on the frontier CD.
سؤال
سؤال
سؤال
سؤال
سؤال
سؤال
سؤال
Figure 8-2
Refer to Figure 8-2. The movement from point R inside the frontier CD to point P on the frontier CD
I. will increase real RGDP.
II. will increase the size of the nation's labor force.
III. represents economic growth.
A) I only
B) I and II only
C) I and III only
D) I, II, and III
Refer to Figure 8-2. The movement from point R inside the frontier CD to point P on the frontier CD
I. will increase real RGDP.
II. will increase the size of the nation's labor force.
III. represents economic growth.
A) I only
B) I and II only
C) I and III only
D) I, II, and III
سؤال
Figure 8-1
Refer to Figure 8-1. Economic growth is represented by a movement
A) from C to D.
B) from D to E.
C) from F to A.
D) from B to C.
Refer to Figure 8-1. Economic growth is represented by a movement
A) from C to D.
B) from D to E.
C) from F to A.
D) from B to C.
سؤال
سؤال
Figure 8-2
Refer to Figure 8-2. A cyclical increase in the level of economic activity is represented by a
A) shift from curve CD to curve AB.
B) shift from curve CD to curve EF.
C) movement from point Q to point O on the frontier CD.
D) movement from point R inside the frontier CD to point P on the frontier CD.
سؤال
سؤال
Figure 8-1
Refer to Figure 8-1. A movement from F to B
A) will increase real GDP and represents economic growth.
B) will increase real GDP but does not represent economic growth.
C) implies that the country's productive ability has increased.
D) will not increase real GDP or potential output.
Refer to Figure 8-1. A movement from F to B
A) will increase real GDP and represents economic growth.
B) will increase real GDP but does not represent economic growth.
C) implies that the country's productive ability has increased.
D) will not increase real GDP or potential output.
سؤال
سؤال
سؤال
Which of the following equations is correct?
A) % growth rate of output per capita % growth rate of output + % growth rate of population
B) % growth rate of output per capita % growth rate of output - % growth rate of population
C) % growth rate of output per capita % growth rate of output % growth rate of population
D) % growth rate of output per capita % growth rate of output ÷ % growth rate of population
A) % growth rate of output per capita
% growth rate of output + % growth rate of populationB) % growth rate of output per capita
% growth rate of output - % growth rate of populationC) % growth rate of output per capita
% growth rate of output % growth rate of populationD) % growth rate of output per capita
% growth rate of output ÷ % growth rate of population سؤال
سؤال
سؤال
سؤال
سؤال
سؤال
سؤال
سؤال
سؤال
سؤال
سؤال
سؤال
سؤال
سؤال
سؤال
سؤال
سؤال
سؤال
سؤال
سؤال
سؤال
Figure 8-4 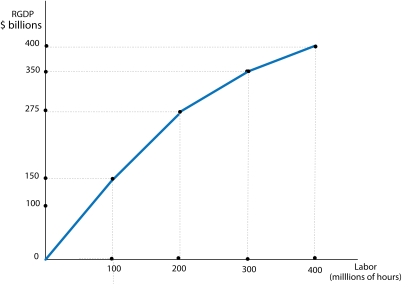
Refer to Figure 8-4. Which of the following could cause the production function to shift upward?
A) an increase in the quantity of labor employed
B) an increase in the economy's average price level
C) an increase in the availability of natural resources
D) an increase in the real wage rate
Refer to Figure 8-4. Which of the following could cause the production function to shift upward?
A) an increase in the quantity of labor employed
B) an increase in the economy's average price level
C) an increase in the availability of natural resources
D) an increase in the real wage rate
سؤال
سؤال
Figure 8-4
Refer to Figure 8-4. In drawing the aggregate production function, which of the following variables is not held constant?
A) capital
B) labor
C) technology
D) quantity of land
Refer to Figure 8-4. In drawing the aggregate production function, which of the following variables is not held constant?
A) capital
B) labor
C) technology
D) quantity of land
سؤال
Figure 8-5 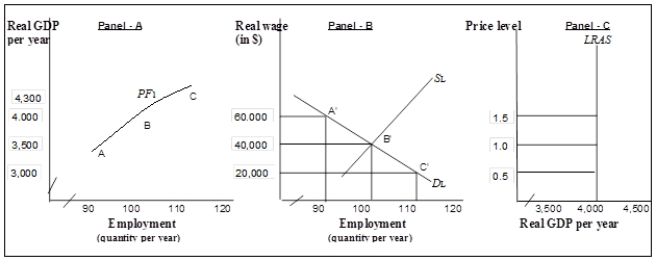 Panel (a) shows an economy's aggregate production function, Panel (b) shows the labor market and Panel (c) shows the economy's long-run aggregate supply curve.
Refer to Figure 8-5. The real wage is the ratio of
A) the price level to the nominal wage.
B) the nominal wage to the quantity of labor employed.
C) the nominal wage to the price level.
D) real GDP to the nominal wage.
Panel (a) shows an economy's aggregate production function, Panel (b) shows the labor market and Panel (c) shows the economy's long-run aggregate supply curve.Refer to Figure 8-5. The real wage is the ratio of
A) the price level to the nominal wage.
B) the nominal wage to the quantity of labor employed.
C) the nominal wage to the price level.
D) real GDP to the nominal wage.
سؤال
سؤال
سؤال
سؤال
سؤال
سؤال
سؤال
سؤال
Figure 8-5 Panel (a) shows an economy's aggregate production function, Panel (b) shows the labor market and Panel (c) shows the economy's long-run aggregate supply curve.
Refer to Figure 8-5. The labor market represented in Panel (b) is in long-run equilibrium
A) if it is operating at the natural level of employment.
B) if unemployment rate equals zero.
C) if the macroeconomy is in equilibrium.
D) if there are no diminishing marginal returns.
Panel (a) shows an economy's aggregate production function, Panel (b) shows the labor market and Panel (c) shows the economy's long-run aggregate supply curve.Refer to Figure 8-5. The labor market represented in Panel (b) is in long-run equilibrium
A) if it is operating at the natural level of employment.
B) if unemployment rate equals zero.
C) if the macroeconomy is in equilibrium.
D) if there are no diminishing marginal returns.
سؤال
سؤال
Figure 8-5 Panel (a) shows an economy's aggregate production function, Panel (b) shows the labor market and Panel (c) shows the economy's long-run aggregate supply curve.
Refer to Figure 8-5. In the labor market represented in Panel (b),
I. the equilibrium real wage equals $40,000.
II. at the equilibrium real wage, 100 million workers are employed.
III. the equilibrium real wage is that which prevails when the economy achieves its natural level of employment.
A) I only
B) I and II only
C) I, II, and III
D) None of the above; to determine if the labor market is in equilibrium, we need information on the economy's aggregate production function.
Panel (a) shows an economy's aggregate production function, Panel (b) shows the labor market and Panel (c) shows the economy's long-run aggregate supply curve.Refer to Figure 8-5. In the labor market represented in Panel (b),
I. the equilibrium real wage equals $40,000.
II. at the equilibrium real wage, 100 million workers are employed.
III. the equilibrium real wage is that which prevails when the economy achieves its natural level of employment.
A) I only
B) I and II only
C) I, II, and III
D) None of the above; to determine if the labor market is in equilibrium, we need information on the economy's aggregate production function.
سؤال
Figure 8-5 Panel (a) shows an economy's aggregate production function, Panel (b) shows the labor market and Panel (c) shows the economy's long-run aggregate supply curve.
Refer to Figure 8-5. The economy could achieve its potential output at a price level- nominal wage combination of
A) 1.5 and $60,000.
B) 1.0 and $50,000.
C) 1.0 and $45,000
D) 0.5 and $30,000.
Panel (a) shows an economy's aggregate production function, Panel (b) shows the labor market and Panel (c) shows the economy's long-run aggregate supply curve.Refer to Figure 8-5. The economy could achieve its potential output at a price level- nominal wage combination of
A) 1.5 and $60,000.
B) 1.0 and $50,000.
C) 1.0 and $45,000
D) 0.5 and $30,000.
سؤال
سؤال
Figure 8-4
Refer to Figure 8-4. The production function displays
A) increasing marginal returns to labor.
B) constant marginal returns to labor.
C) increasing marginal returns to labor initially followed by diminishing marginal returns.
D) diminishing marginal returns to labor.
Refer to Figure 8-4. The production function displays
A) increasing marginal returns to labor.
B) constant marginal returns to labor.
C) increasing marginal returns to labor initially followed by diminishing marginal returns.
D) diminishing marginal returns to labor.
سؤال
Figure 8-3 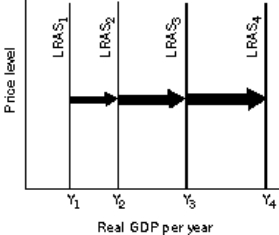
Refer to Figure 8-3. Exponential economic growth can be depicted by
A) a series of leftward shifts by constant amounts of the LRAS curve.
B) a series of rightward shifts by constant amounts of the LRAS curve.
C) shifts in the LRAS curve to the right in which the successive increases are larger and larger.
D) shifts in the LRAS curve to the left in which the successive decreases are larger and larger.
سؤال
سؤال
سؤال
سؤال
Figure 8-6 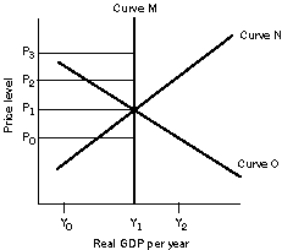
Refer to Figure 8-6. Assume that the economy is initially in long-run equilibrium. Suppose the federal government initiates a tax program that stimulates firms to increase their investment and this leads to economic growth. This policy might, in the short run, result in
A) a leftward shift of the aggregate demand and the short-run aggregate supply curve and in the long run, a rightward shift of the long-run aggregate supply curve.
B) a rightward shift of the aggregate demand curve and in the long run, a rightward shift of the long-run aggregate supply and the short-run aggregate supply curves.
C) a rightward shift of the short-run aggregate supply curve and in the long run, a rightward shift of the long-run aggregate supply curve.
D) a leftward shift of the aggregate demand curve and in the long run, a rightward shift of the long-run aggregate supply and the short-run aggregate supply curves.
سؤال
Figure 8-6
Refer to Figure 8-6. Assume that the economy is initially in long-run equilibrium. What happens if investment spending increases?
A) The short-run aggregate supply curve shifts right and the price level decreases.
B) The long-run aggregate supply curve shifts right and the price level decreases.
C) The long-run aggregate supply curve and the short-run aggregate supply curve shift right and the price level decreases.
D) The aggregate demand curve shifts right and the price level increases.
سؤال
سؤال
Figure 8-5 Panel (a) shows an economy's aggregate production function, Panel (b) shows the labor market and Panel (c) shows the economy's long-run aggregate supply curve.
Refer to Figure 8-5. If a change in technology moves the aggregate production function upward,
A) the demand for labor will remain the same.
B) the demand for labor falls.
C) the demand for labor increases.
D) the demand and supply of labor will increase.
Panel (a) shows an economy's aggregate production function, Panel (b) shows the labor market and Panel (c) shows the economy's long-run aggregate supply curve.Refer to Figure 8-5. If a change in technology moves the aggregate production function upward,
A) the demand for labor will remain the same.
B) the demand for labor falls.
C) the demand for labor increases.
D) the demand and supply of labor will increase.
سؤال
سؤال
سؤال
Figure 8-5 Panel (a) shows an economy's aggregate production function, Panel (b) shows the labor market and Panel (c) shows the economy's long-run aggregate supply curve.
Refer to Figure 8-5. In the long run, any price level is consistent with a real wage of $40,000 because
A) real wage is perfectly flexible.
B) the labor force is perfectly mobile.
C) nominal wage is perfectly flexible.
D) nominal wage is sticky.
Panel (a) shows an economy's aggregate production function, Panel (b) shows the labor market and Panel (c) shows the economy's long-run aggregate supply curve.Refer to Figure 8-5. In the long run, any price level is consistent with a real wage of $40,000 because
A) real wage is perfectly flexible.
B) the labor force is perfectly mobile.
C) nominal wage is perfectly flexible.
D) nominal wage is sticky.
سؤال
سؤال
Figure 8-5 Panel (a) shows an economy's aggregate production function, Panel (b) shows the labor market and Panel (c) shows the economy's long-run aggregate supply curve.
Refer to Figure 8-5. If a change in technology moves the aggregate production function in Panel (a) upwards, what happens to the economy's potential output?
A) Potential output remains unchanged.
B) Potential output increases.
C) Potential output decreases.
D) Potential output could increase or decrease depending on what happens in the labor market.
Panel (a) shows an economy's aggregate production function, Panel (b) shows the labor market and Panel (c) shows the economy's long-run aggregate supply curve.Refer to Figure 8-5. If a change in technology moves the aggregate production function in Panel (a) upwards, what happens to the economy's potential output?
A) Potential output remains unchanged.
B) Potential output increases.
C) Potential output decreases.
D) Potential output could increase or decrease depending on what happens in the labor market.
سؤال
Figure 8-6
Refer to Figure 8-6. Assume that the economy is initially in long-run equilibrium. What happens if the price of oil, a key input, increases significantly in the economy?
A) The long-run aggregate supply and the short-run aggregate supply curves shift left.
B) The short-run aggregate supply curve shifts left.
C) The aggregate demand and the short-run aggregate supply curves shift left.
D) The long-run aggregate supply, the short-run aggregate supply, and the aggregate demand curves shift left.
سؤال
Figure 8-6
Refer to Figure 8-6. Assume that the economy is initially in long-run equilibrium. If oil prices in the economy increased dramatically and remained high for so long that most of the industries in the economy had to significantly form new capital and retool much of its existing capital, the economy would suffer. In this event,
A) the long-run aggregate supply and the short-run aggregate supply curves would shift left, reducing the future industrial capacity and prospects for economic growth.
B) the aggregate demand curve would shift left, reducing the future industrial capacity and prospects for economic growth.
C) only the short-run aggregate supply curve would shift left, permanently reducing the economy's potential output.
D) the long-run aggregate supply, the short-run aggregate supply, and the aggregate demand curves would shift left, sending the economy into a long recession.
سؤال
Figure 8-5 Panel (a) shows an economy's aggregate production function, Panel (b) shows the labor market and Panel (c) shows the economy's long-run aggregate supply curve.
Refer to Figure 8-5. An upward shift of the aggregate production function would lead to
A) a decrease in the real wage and to a decrease in real GDP.
B) an increase in the real wage and to a decrease in real GDP.
C) a decrease in the real wage and to an increase in real GDP.
D) an increase in the real wage and to an increase in real GDP.
Panel (a) shows an economy's aggregate production function, Panel (b) shows the labor market and Panel (c) shows the economy's long-run aggregate supply curve.Refer to Figure 8-5. An upward shift of the aggregate production function would lead to
A) a decrease in the real wage and to a decrease in real GDP.
B) an increase in the real wage and to a decrease in real GDP.
C) a decrease in the real wage and to an increase in real GDP.
D) an increase in the real wage and to an increase in real GDP.
سؤال
سؤال
Figure 8-5 Panel (a) shows an economy's aggregate production function, Panel (b) shows the labor market and Panel (c) shows the economy's long-run aggregate supply curve.
Refer to Figure 8-5. In Panel (c), the long-run aggregate supply curve is vertical because
A) of diminishing marginal returns.
B) of sticky wages and prices.
C) perfectly flexible nominal wages in the long run allow any number of wage/price level combinations to result in a real wage that equilibrates the labor market.
D) the economy is not constrained by diminishing marginal returns since it can change the quantities of all factors of production.
Panel (a) shows an economy's aggregate production function, Panel (b) shows the labor market and Panel (c) shows the economy's long-run aggregate supply curve.Refer to Figure 8-5. In Panel (c), the long-run aggregate supply curve is vertical because
A) of diminishing marginal returns.
B) of sticky wages and prices.
C) perfectly flexible nominal wages in the long run allow any number of wage/price level combinations to result in a real wage that equilibrates the labor market.
D) the economy is not constrained by diminishing marginal returns since it can change the quantities of all factors of production.
سؤال
Figure 8-6
Refer to Figure 8-6. Assume that the economy is initially in long-run equilibrium. What happens in the long-run if the capital stock in this economy increases over time?
A) The nation's capacity to produce will increase as represented by a rightward shift of the long-run aggregate supply curve.
B) The nation's capacity to produce will increase as represented by a rightward shift of the short-run aggregate supply curve. The long-run aggregate supply curve and the aggregate demand curves remain unchanged.
C) The nation's capacity to produce will increase as represented by a rightward shift of the long-run aggregate demand curve.
D) The nation's capacity to produce will increase as represented by a rightward shift of the short-run aggregate supply curve and the aggregate demand curve. The long-run aggregate supply curve remains unchanged.
سؤال
Figure 8-5 Panel (a) shows an economy's aggregate production function, Panel (b) shows the labor market and Panel (c) shows the economy's long-run aggregate supply curve.
Refer to Figure 8-5. In Panel (c), the position of the long-run aggregate supply curve is determined by
A) the economy's potential output and its aggregate production function.
B) the economy's potential output and the demand and supply curves for labor.
C) the price level and potential output.
D) the price level and the demand and supply curves for labor.
Panel (a) shows an economy's aggregate production function, Panel (b) shows the labor market and Panel (c) shows the economy's long-run aggregate supply curve.Refer to Figure 8-5. In Panel (c), the position of the long-run aggregate supply curve is determined by
A) the economy's potential output and its aggregate production function.
B) the economy's potential output and the demand and supply curves for labor.
C) the price level and potential output.
D) the price level and the demand and supply curves for labor.
سؤال

فتح الحزمة
قم بالتسجيل لفتح البطاقات في هذه المجموعة!
Unlock Deck
Unlock Deck
1/135
العب
ملء الشاشة (f)
Deck 8: Economic Growth
1
Figure 8-1
Refer to Figure 8-1. A cyclical increase in real GDP is represented by a movement
A) from D to C.
B) from D to E.
C) from F to A.
D) from A to B.
Refer to Figure 8-1. A cyclical increase in real GDP is represented by a movement
A) from D to C.
B) from D to E.
C) from F to A.
D) from A to B.
from F to A.
2
The theory of economic growth focuses on the
A) growth of real income equality in the long run; not on the growth of real income in the short run.
B) growth of resources in the long run, not on the efficiency of resource use in the short run.
C) growth of potential output over the long run, not on fluctuations in the level of economic activity in the short run.
D) advancements in technology over the long run, not on short-run increases in real GDP.
growth of potential output over the long run, not on fluctuations in the level of economic activity in the short run.
3
Which of the following statements is true?
A) Measuring economic growth as the rate of increase in actual real GDP is a valid measure.
B) Measuring economic growth as the rate of increase in actual real GDP leads to an inaccurate measure of economic growth.
C) Economic growth must be measured in nominal terms converted to real values each year.
D) Economic growth must be measured in real GDP terms and converted to nominal terms each year.
Measuring economic growth as the rate of increase in actual real GDP leads to an inaccurate measure of economic growth.
4
Economists do not use actual values of real GDP to measure economic growth because
A) real GDP holds price level constant, but in reality price level changes from year to year.
B) changes in real GDP could be due to fluctuations in the level of economic activity.
C) economic growth encompasses more than just growth in output.
D) changes in real GDP do not provide any information about income distribution.
فتح الحزمة
افتح القفل للوصول البطاقات البالغ عددها 135 في هذه المجموعة.
فتح الحزمة
k this deck
5
Economic growth
I. is represented by an outward shift of the production possibilities curve.
II. is defined in terms of a series of events that increase the economy's ability to produce goods and services.
III. refers to a process that increases potential output.
IV. occurs when the economy operates on its production possibilities frontier.
A) I and IV only
B) I, II, and III
C) I, III, and IV
D) I, II, III, and IV
فتح الحزمة
افتح القفل للوصول البطاقات البالغ عددها 135 في هذه المجموعة.
فتح الحزمة
k this deck
6
Economic growth is defined as
A) growth in nominal gross domestic product over time.
B) the process by which a country's potential output grows over time.
C) the process by which scarcity is eliminated over time.
D) growth in money supply over time.
A) growth in nominal gross domestic product over time.
B) the process by which a country's potential output grows over time.
C) the process by which scarcity is eliminated over time.
D) growth in money supply over time.
فتح الحزمة
افتح القفل للوصول البطاقات البالغ عددها 135 في هذه المجموعة.
فتح الحزمة
k this deck
7
Figure 8-2
Refer to Figure 8-2. Assume that a nation is operating on production possibilities curve CD. Economic growth is best illustrated by a
A) shift from curve CD to curve AB.
B) shift from curve CD to curve EF.
C) movement from point Q to point O on the frontier CD.
D) movement from point R inside the frontier CD to point P on the frontier CD.
فتح الحزمة
افتح القفل للوصول البطاقات البالغ عددها 135 في هذه المجموعة.
فتح الحزمة
k this deck
8
Using actual values of real GDP to measure economic growth
A) yields misleading results because changes in real GDP are affected by cyclical changes that do not represent economic growth.
B) is the most widely accepted method of measuring economic growth.
C) introduces problems because of inaccuracies in the measurement of real GDP.
D) is superior to using actual values of nominal GDP because it allows us to isolate the effects of price changes.
فتح الحزمة
افتح القفل للوصول البطاقات البالغ عددها 135 في هذه المجموعة.
فتح الحزمة
k this deck
9
Approximately what percentage of families in the U.S. own homes?
A) 10%
B) 25%
C) 50%
D) 67%
A) 10%
B) 25%
C) 50%
D) 67%
فتح الحزمة
افتح القفل للوصول البطاقات البالغ عددها 135 في هذه المجموعة.
فتح الحزمة
k this deck
10
The rule of 72 states that grows at some exponential rate of z percent
A) will double in value in approximately 72 years.
B) will double in value in approximately 72 ÷ z years.
C) will double in value in approximately 72 z years.
D) will double in value in approximately 72z years.
A) will double in value in approximately 72 years.
B) will double in value in approximately 72 ÷ z years.
C) will double in value in approximately 72 z years.
D) will double in value in approximately 72z years.
فتح الحزمة
افتح القفل للوصول البطاقات البالغ عددها 135 في هذه المجموعة.
فتح الحزمة
k this deck
11
Which of the following applies to economic growth?
I. Economic growth allows people to buy more goods and services.
II. Economic growth is the expansion of the economy's production possibilities.
III. Economic growth is represented by a movement from a point inside the production possibilities curve to a point on the curve.
A) I, II, and III
B) I and II only
C) I and III only
D) I only
فتح الحزمة
افتح القفل للوصول البطاقات البالغ عددها 135 في هذه المجموعة.
فتح الحزمة
k this deck
12
What is the relationship between average household income and standard of living?
A) There is no relationship. Increasing average income says nothing about income distribution.
B) Rising income enables households to acquire more of the goods and services that improve their material standard of living.
C) Rising income tends to increase the crime rate and violence, thereby lowering a country's standard of living.
D) There is no relationship. Standard of living depends on productivity not household income.
فتح الحزمة
افتح القفل للوصول البطاقات البالغ عددها 135 في هذه المجموعة.
فتح الحزمة
k this deck
13
Economic growth is best measured by the increase in
A) nominal GDP.
B) potential output.
C) disposable personal income in current dollars.
D) disposable personal income in real dollars.
A) nominal GDP.
B) potential output.
C) disposable personal income in current dollars.
D) disposable personal income in real dollars.
فتح الحزمة
افتح القفل للوصول البطاقات البالغ عددها 135 في هذه المجموعة.
فتح الحزمة
k this deck
14
Figure 8-2
Refer to Figure 8-2. The movement from point R inside the frontier CD to point P on the frontier CD
I. will increase real RGDP.
II. will increase the size of the nation's labor force.
III. represents economic growth.
A) I only
B) I and II only
C) I and III only
D) I, II, and III
Refer to Figure 8-2. The movement from point R inside the frontier CD to point P on the frontier CD
I. will increase real RGDP.
II. will increase the size of the nation's labor force.
III. represents economic growth.
A) I only
B) I and II only
C) I and III only
D) I, II, and III
فتح الحزمة
افتح القفل للوصول البطاقات البالغ عددها 135 في هذه المجموعة.
فتح الحزمة
k this deck
15
Figure 8-1
Refer to Figure 8-1. Economic growth is represented by a movement
A) from C to D.
B) from D to E.
C) from F to A.
D) from B to C.
Refer to Figure 8-1. Economic growth is represented by a movement
A) from C to D.
B) from D to E.
C) from F to A.
D) from B to C.
فتح الحزمة
افتح القفل للوصول البطاقات البالغ عددها 135 في هذه المجموعة.
فتح الحزمة
k this deck
16
Over the past century, the average household income in the United States
A) has increased in nominal terms but has decreased in real terms.
B) has increased in nominal terms but has remained constant in real terms.
C) has increased in real terms.
D) has increased only marginally both in real and nominal terms.
A) has increased in nominal terms but has decreased in real terms.
B) has increased in nominal terms but has remained constant in real terms.
C) has increased in real terms.
D) has increased only marginally both in real and nominal terms.
فتح الحزمة
افتح القفل للوصول البطاقات البالغ عددها 135 في هذه المجموعة.
فتح الحزمة
k this deck
17
Figure 8-2
Refer to Figure 8-2. A cyclical increase in the level of economic activity is represented by a
A) shift from curve CD to curve AB.
B) shift from curve CD to curve EF.
C) movement from point Q to point O on the frontier CD.
D) movement from point R inside the frontier CD to point P on the frontier CD.
فتح الحزمة
افتح القفل للوصول البطاقات البالغ عددها 135 في هذه المجموعة.
فتح الحزمة
k this deck
18
Economic growth is an exponential process. What does this mean?
A) It means that the returns to huge capital investments made today will diminish at an increasing rate over time.
B) It means that small differences in sustained growth rates have significant effects on a nation's real income over long periods of time.
C) It means that countries must allocate increasing amounts of resources to capital goods to see constant increases in the growth rate of potential output.
D) It means that if a country allocates a fixed amount of resources to capital goods, its potential output will increase at an increasing rate over long periods of time.
فتح الحزمة
افتح القفل للوصول البطاقات البالغ عددها 135 في هذه المجموعة.
فتح الحزمة
k this deck
19
Figure 8-1
Refer to Figure 8-1. A movement from F to B
A) will increase real GDP and represents economic growth.
B) will increase real GDP but does not represent economic growth.
C) implies that the country's productive ability has increased.
D) will not increase real GDP or potential output.
Refer to Figure 8-1. A movement from F to B
A) will increase real GDP and represents economic growth.
B) will increase real GDP but does not represent economic growth.
C) implies that the country's productive ability has increased.
D) will not increase real GDP or potential output.
فتح الحزمة
افتح القفل للوصول البطاقات البالغ عددها 135 في هذه المجموعة.
فتح الحزمة
k this deck
20
Economists define economic growth as
A) changes in real GDP from year to year that occur as aggregate demand and short-run aggregate supply change.
B) an increase in the standard of living of a nation.
C) an increase in nominal GDP combined with price stability.
D) the process through which the economy's potential output is increased.
A) changes in real GDP from year to year that occur as aggregate demand and short-run aggregate supply change.
B) an increase in the standard of living of a nation.
C) an increase in nominal GDP combined with price stability.
D) the process through which the economy's potential output is increased.
فتح الحزمة
افتح القفل للوصول البطاقات البالغ عددها 135 في هذه المجموعة.
فتح الحزمة
k this deck
21
Suppose a country's real GDP increases. At the same time, its population also increases. What happens to its standard of living?
A) Its standard of living remains the same.
B) Its standard of living depends on the price level.
C) Its standard of living could rise if population growth exceeds output growth.
D) Its standard of living could rise if population growth is smaller than output growth.
A) Its standard of living remains the same.
B) Its standard of living depends on the price level.
C) Its standard of living could rise if population growth exceeds output growth.
D) Its standard of living could rise if population growth is smaller than output growth.
فتح الحزمة
افتح القفل للوصول البطاقات البالغ عددها 135 في هذه المجموعة.
فتح الحزمة
k this deck
22
Which of the following equations is correct?
A) % growth rate of output per capita % growth rate of output + % growth rate of population
B) % growth rate of output per capita % growth rate of output - % growth rate of population
C) % growth rate of output per capita % growth rate of output % growth rate of population
D) % growth rate of output per capita % growth rate of output ÷ % growth rate of population
A) % growth rate of output per capita
% growth rate of output + % growth rate of populationB) % growth rate of output per capita
% growth rate of output - % growth rate of populationC) % growth rate of output per capita
% growth rate of output % growth rate of populationD) % growth rate of output per capita
% growth rate of output ÷ % growth rate of population فتح الحزمة
افتح القفل للوصول البطاقات البالغ عددها 135 في هذه المجموعة.
فتح الحزمة
k this deck
23
If population increases at an average rate of 2% per year and output increases at an average rate of 5% per year, then output per capita will double in
A) 14.4 years.
B) 18 years.
C) 24 years.
D) 36 years.
A) 14.4 years.
B) 18 years.
C) 24 years.
D) 36 years.
فتح الحزمة
افتح القفل للوصول البطاقات البالغ عددها 135 في هذه المجموعة.
فتح الحزمة
k this deck
24
Suppose that GDP of a small tropical island grows at 4% per year. This year, output is equal to 100,000 units of output. Using the rule of 72, how long will it take before GDP is equal to 400,000 units of output?
A) 18 years
B) 36 years
C) 45 years
D) 72 years
A) 18 years
B) 36 years
C) 45 years
D) 72 years
فتح الحزمة
افتح القفل للوصول البطاقات البالغ عددها 135 في هذه المجموعة.
فتح الحزمة
k this deck
25
Suppose that real GDP per capita of Monrovia is $30,000. RGDP per capita in Westova is $15,000. Suppose that rate of growth of real GDP per capita in Monrovia is 3.17% per year and in Westova it is 6.34% per year. Using the rule of 72, calculate how many years it will take for RGDP per capita in Westova to catch up with RGDP per capita in Monrovia.
A) approximately 11 years
B) approximately 23 years
C) approximately 34 years
D) approximately 46 years
A) approximately 11 years
B) approximately 23 years
C) approximately 34 years
D) approximately 46 years
فتح الحزمة
افتح القفل للوصول البطاقات البالغ عددها 135 في هذه المجموعة.
فتح الحزمة
k this deck
26
If the rate of growth of output is 8% and the rate of growth of population is 2%, what is the rate of growth of output per capita?
A) 2%
B) 4%
C) 6%
D) 8%
A) 2%
B) 4%
C) 6%
D) 8%
فتح الحزمة
افتح القفل للوصول البطاقات البالغ عددها 135 في هذه المجموعة.
فتح الحزمة
k this deck
27
If the rate of growth of output per capita is 8% and the rate of growth of population is 2%, what is the rate of growth of output?
A) 4%
B) 6%
C) 8%
D) 10%
A) 4%
B) 6%
C) 8%
D) 10%
فتح الحزمة
افتح القفل للوصول البطاقات البالغ عددها 135 في هذه المجموعة.
فتح الحزمة
k this deck
28
All else constant, if real GDP doubles in 12 years, its average annual growth rate is
A) approximately 6% .
B) approximately 5%.
C) approximately 4%.
D) approximately 3%.
A) approximately 6% .
B) approximately 5%.
C) approximately 4%.
D) approximately 3%.
فتح الحزمة
افتح القفل للوصول البطاقات البالغ عددها 135 في هذه المجموعة.
فتح الحزمة
k this deck
29
Suppose that real GDP per capita of a rich country is $40,000. Real GDP per capita in a poor country is $10,000. Suppose that rate of growth of GDP per capita in the rich country is 3.6% per year and in the poor country is 7.2% per year. Using the rule of 72, calculate how many years it will take for real GDP per capita in the poor country to catch up with GDP per capita in the rich country?
A) 10 years
B) 20 years
C) 30 years
D) 40 years
A) 10 years
B) 20 years
C) 30 years
D) 40 years
فتح الحزمة
افتح القفل للوصول البطاقات البالغ عددها 135 في هذه المجموعة.
فتح الحزمة
k this deck
30
Holding all else constant, a country's standard of living will decline if its
A) nominal GDP grows at a faster rate than real GDP.
B) nominal GDP grows at a slower rate than real GDP.
C) the rate of population growth exceeds the rate of growth of real GDP.
D) the rate of population growth is less than the rate of growth of real GDP.
A) nominal GDP grows at a faster rate than real GDP.
B) nominal GDP grows at a slower rate than real GDP.
C) the rate of population growth exceeds the rate of growth of real GDP.
D) the rate of population growth is less than the rate of growth of real GDP.
فتح الحزمة
افتح القفل للوصول البطاقات البالغ عددها 135 في هذه المجموعة.
فتح الحزمة
k this deck
31
All else constant, if a nation's potential output doubles in 36 years, its average annual growth rate is
A) approximately 1% .
B) approximately 2%.
C) approximately 3%.
D) approximately 4%.
A) approximately 1% .
B) approximately 2%.
C) approximately 3%.
D) approximately 4%.
فتح الحزمة
افتح القفل للوصول البطاقات البالغ عددها 135 في هذه المجموعة.
فتح الحزمة
k this deck
32
Holding all else constant, a country's standard of living will rise if its
A) nominal GDP grows at a faster rate than real GDP.
B) nominal GDP grows at a slower rate than real GDP.
C) rate of population growth exceeds the rate of growth of real GDP.
D) rate of population growth is less than the rate of growth of real GDP.
A) nominal GDP grows at a faster rate than real GDP.
B) nominal GDP grows at a slower rate than real GDP.
C) rate of population growth exceeds the rate of growth of real GDP.
D) rate of population growth is less than the rate of growth of real GDP.
فتح الحزمة
افتح القفل للوصول البطاقات البالغ عددها 135 في هذه المجموعة.
فتح الحزمة
k this deck
33
The rate of economic growth per capita in Mamoogia from 2006 to 2010 was 3.6% per year, while in Kennan, over the same period it was 7.2%. In 2010, per capita real GDP was $28,900 in Mamoogia and $12,700 in Kennan. Assume the growth rate for each country remains the same. Calculate the percentage difference in their levels of potential output in 2050.
A) Kennan's potential output will be about 32% lower than Mamoogia's potential output.
B) Kennan's potential output will be about 76% lower than Mamoogia's potential output.
C) Kennan's potential output will be about 32% higher than Mamoogia's potential output.
D) Kennan's potential output will be about 76% higher than Mamoogia's potential output.
فتح الحزمة
افتح القفل للوصول البطاقات البالغ عددها 135 في هذه المجموعة.
فتح الحزمة
k this deck
34
The rate of economic growth per capita in Mamoogia from 20006 to 2010 was 1.8% per year, while in Kennan, over the same period it was 3.6%. In 2010, per capita real GDP was $28,900 in Mamoogia and $12,700 in Kennan. Assume the growth rates for each country remain the same. Which country will have a higher level of potential output in 2050?
A) Kennan
B) Mamoogia
C) Their potential output will be the same.
D) It will depend on the rate of population growth in each country.
A) Kennan
B) Mamoogia
C) Their potential output will be the same.
D) It will depend on the rate of population growth in each country.
فتح الحزمة
افتح القفل للوصول البطاقات البالغ عددها 135 في هذه المجموعة.
فتح الحزمة
k this deck
35
Suppose real GDPs in Hauck and Meran are identical at $10 trillion in 2010. Suppose Hauck's economic growth rate is 2% and Meran's is 4% and the rates remain constant over time. Calculate the percentage difference in their levels of potential output in 2046.
A) There will be no difference in their levels of potential output.
B) Meran's potential output will be 50% higher than that of Hauck's.
C) Hauck's potential output will be 100% higher than that of Meran's.
D) Meran's potential output will be 100% higher than that of Hauck's.
A) There will be no difference in their levels of potential output.
B) Meran's potential output will be 50% higher than that of Hauck's.
C) Hauck's potential output will be 100% higher than that of Meran's.
D) Meran's potential output will be 100% higher than that of Hauck's.
فتح الحزمة
افتح القفل للوصول البطاقات البالغ عددها 135 في هذه المجموعة.
فتح الحزمة
k this deck
36
If population increases at an average rate of 1% per year and output increases at an average rate of 5% per year, then per capita real GDP will double in
A) 14.4 years.
B) 18 years.
C) 24 years.
D) 36 years.
A) 14.4 years.
B) 18 years.
C) 24 years.
D) 36 years.
فتح الحزمة
افتح القفل للوصول البطاقات البالغ عددها 135 في هذه المجموعة.
فتح الحزمة
k this deck
37
If the rate of growth of output is 10% and the rate of growth of per capita real GDP is 6%, what is the rate of growth of population?
A) 2
B) 4
C) 6
D) 8
A) 2
B) 4
C) 6
D) 8
فتح الحزمة
افتح القفل للوصول البطاقات البالغ عددها 135 في هذه المجموعة.
فتح الحزمة
k this deck
38
Suppose a country's potential level of real GDP grows at a rate of 6% per year. Use the rule of 72 to calculate how long it takes for the country's potential output to double.
A) 6 years
B) 12 years
C) 24 years
D) 30 years
A) 6 years
B) 12 years
C) 24 years
D) 30 years
فتح الحزمة
افتح القفل للوصول البطاقات البالغ عددها 135 في هذه المجموعة.
فتح الحزمة
k this deck
39
Use the rule of 72 to determine how long it takes for real GDP to double if real GDP grows at 3% per year.
A) 12 years
B) 24 years
C) 36 years
D) 72 years
A) 12 years
B) 24 years
C) 36 years
D) 72 years
فتح الحزمة
افتح القفل للوصول البطاقات البالغ عددها 135 في هذه المجموعة.
فتح الحزمة
k this deck
40
If output per capita doubles in 24 years and the population doubles in 18 years, what is the growth rate of output?
A) 4% per year
B) 5% per year
C) 6% per year
D) 7% per year
A) 4% per year
B) 5% per year
C) 6% per year
D) 7% per year
فتح الحزمة
افتح القفل للوصول البطاقات البالغ عددها 135 في هذه المجموعة.
فتح الحزمة
k this deck
41
Suppose the world's population in 2012 is 7.1 billion and is projected to grow at a rate of 1.2% per year. In approximately what year will the world's population be 14.2 billion?
A) in the year 2021
B) in the year 2054
C) in the year 2072
D) in the year 3000
A) in the year 2021
B) in the year 2054
C) in the year 2072
D) in the year 3000
فتح الحزمة
افتح القفل للوصول البطاقات البالغ عددها 135 في هذه المجموعة.
فتح الحزمة
k this deck
42
Holding everything else unchanged, if a nation's output grows at approximately 2.4% per year and its population doubles in 45 years, calculate the approximate rate of change in per capita real GDP.
A) 0.8% per year
B) 1.6% per year
C) 2.4% per year
D) 4% per year
A) 0.8% per year
B) 1.6% per year
C) 2.4% per year
D) 4% per year
فتح الحزمة
افتح القفل للوصول البطاقات البالغ عددها 135 في هذه المجموعة.
فتح الحزمة
k this deck
43
Figure 8-4
Refer to Figure 8-4. Which of the following could cause the production function to shift upward?
A) an increase in the quantity of labor employed
B) an increase in the economy's average price level
C) an increase in the availability of natural resources
D) an increase in the real wage rate
Refer to Figure 8-4. Which of the following could cause the production function to shift upward?
A) an increase in the quantity of labor employed
B) an increase in the economy's average price level
C) an increase in the availability of natural resources
D) an increase in the real wage rate
فتح الحزمة
افتح القفل للوصول البطاقات البالغ عددها 135 في هذه المجموعة.
فتح الحزمة
k this deck
44
Suppose labor is the only variable that changes. If production displays diminishing marginal returns, each additional unit of labor
A) adds more and more to total output.
B) adds less and less to total output.
C) adds a fixed amount to total output.
D) actually decreases output.
A) adds more and more to total output.
B) adds less and less to total output.
C) adds a fixed amount to total output.
D) actually decreases output.
فتح الحزمة
افتح القفل للوصول البطاقات البالغ عددها 135 في هذه المجموعة.
فتح الحزمة
k this deck
45
Figure 8-4
Refer to Figure 8-4. In drawing the aggregate production function, which of the following variables is not held constant?
A) capital
B) labor
C) technology
D) quantity of land
Refer to Figure 8-4. In drawing the aggregate production function, which of the following variables is not held constant?
A) capital
B) labor
C) technology
D) quantity of land
فتح الحزمة
افتح القفل للوصول البطاقات البالغ عددها 135 في هذه المجموعة.
فتح الحزمة
k this deck
46
Figure 8-5 Panel (a) shows an economy's aggregate production function, Panel (b) shows the labor market and Panel (c) shows the economy's long-run aggregate supply curve.
Refer to Figure 8-5. The real wage is the ratio of
A) the price level to the nominal wage.
B) the nominal wage to the quantity of labor employed.
C) the nominal wage to the price level.
D) real GDP to the nominal wage.
Panel (a) shows an economy's aggregate production function, Panel (b) shows the labor market and Panel (c) shows the economy's long-run aggregate supply curve.Refer to Figure 8-5. The real wage is the ratio of
A) the price level to the nominal wage.
B) the nominal wage to the quantity of labor employed.
C) the nominal wage to the price level.
D) real GDP to the nominal wage.
فتح الحزمة
افتح القفل للوصول البطاقات البالغ عددها 135 في هذه المجموعة.
فتح الحزمة
k this deck
47
If output per capita doubles in 30 years and the population doubles in 60 years, what is the growth rate of output?
A) 3.6% per year
B) 2.4% per year
C) 2% per year
D) 1.2% per year
A) 3.6% per year
B) 2.4% per year
C) 2% per year
D) 1.2% per year
فتح الحزمة
افتح القفل للوصول البطاقات البالغ عددها 135 في هذه المجموعة.
فتح الحزمة
k this deck
48
The aggregate production function shows the ________ for given levels of labor and other factors of production.
A) real GDP
B) possible combinations of two goods
C) marginal product of labor
D) potential output
A) real GDP
B) possible combinations of two goods
C) marginal product of labor
D) potential output
فتح الحزمة
افتح القفل للوصول البطاقات البالغ عددها 135 في هذه المجموعة.
فتح الحزمة
k this deck
49
A curve that relates an economy's total output to the total amount of labor employed, holding all other determinants of output constant, is called
A) an input-output matrix.
B) an average output function.
C) a marginal product function.
D) an aggregate production function.
A) an input-output matrix.
B) an average output function.
C) a marginal product function.
D) an aggregate production function.
فتح الحزمة
افتح القفل للوصول البطاقات البالغ عددها 135 في هذه المجموعة.
فتح الحزمة
k this deck
50
Suppose a nation's real GDP grows at approximately 3.6% per year and its per capita real GDP grows by 2.2%. Calculate the approximate rate of population growth.
A) 0.6% per year
B) 1.4% per year
C) -1.4% per year
D) 5.8% per year
A) 0.6% per year
B) 1.4% per year
C) -1.4% per year
D) 5.8% per year
فتح الحزمة
افتح القفل للوصول البطاقات البالغ عددها 135 في هذه المجموعة.
فتح الحزمة
k this deck
51
If a nation's real GDP grows at approximately 3.4% per year and its population doubles in 120 years, calculate the approximate rate of change in per capita real GDP.
A) 0.6% per year.
B) 2.8% per year.
C) 3.4% per year.
D) 4% per year.
A) 0.6% per year.
B) 2.8% per year.
C) 3.4% per year.
D) 4% per year.
فتح الحزمة
افتح القفل للوصول البطاقات البالغ عددها 135 في هذه المجموعة.
فتح الحزمة
k this deck
52
Economic growth can be represented by
A) an increasing equilibrium output level
B) a rightward shift of an economy's short-run aggregate supply curve.
C) a rightward shift of an economy's long-run aggregate demand curve.
D) a rightward shift of an economy's long-run aggregate supply curve.
A) an increasing equilibrium output level
B) a rightward shift of an economy's short-run aggregate supply curve.
C) a rightward shift of an economy's long-run aggregate demand curve.
D) a rightward shift of an economy's long-run aggregate supply curve.
فتح الحزمة
افتح القفل للوصول البطاقات البالغ عددها 135 في هذه المجموعة.
فتح الحزمة
k this deck
53
Diminishing marginal returns occurs when
A) each additional unit of a variable factor adds less to total output than the previous unit, given constant quantities of other factors.
B) each additional unit of a variable factor adds more to total output than the previous unit, given constant quantities of other factors.
C) each additional unit of a variable factor diminishes total output, given constant quantities of other factors.
D) each additional unit of a variable factor adds a constant amount to total output than the previous unit, given diminishing quantities of other factors.
فتح الحزمة
افتح القفل للوصول البطاقات البالغ عددها 135 في هذه المجموعة.
فتح الحزمة
k this deck
54
Figure 8-5 Panel (a) shows an economy's aggregate production function, Panel (b) shows the labor market and Panel (c) shows the economy's long-run aggregate supply curve.
Refer to Figure 8-5. The labor market represented in Panel (b) is in long-run equilibrium
A) if it is operating at the natural level of employment.
B) if unemployment rate equals zero.
C) if the macroeconomy is in equilibrium.
D) if there are no diminishing marginal returns.
Panel (a) shows an economy's aggregate production function, Panel (b) shows the labor market and Panel (c) shows the economy's long-run aggregate supply curve.Refer to Figure 8-5. The labor market represented in Panel (b) is in long-run equilibrium
A) if it is operating at the natural level of employment.
B) if unemployment rate equals zero.
C) if the macroeconomy is in equilibrium.
D) if there are no diminishing marginal returns.
فتح الحزمة
افتح القفل للوصول البطاقات البالغ عددها 135 في هذه المجموعة.
فتح الحزمة
k this deck
55
Which of the following statements is true?
I. Small differences in rates of economic growth can lead to large differences in levels of potential output over time.
II. From the perspective of the rule of 72, small differences in rates of economic growth between two countries will not significantly affect their respective standards of living.
III. Countries that have higher population growth rates are likely to see higher economic growth rates because increases in population lead to increases in the size of the labor force.
A) I and III
B) II and III
C) I only
D) II only
E) III only
فتح الحزمة
افتح القفل للوصول البطاقات البالغ عددها 135 في هذه المجموعة.
فتح الحزمة
k this deck
56
Figure 8-5 Panel (a) shows an economy's aggregate production function, Panel (b) shows the labor market and Panel (c) shows the economy's long-run aggregate supply curve.
Refer to Figure 8-5. In the labor market represented in Panel (b),
I. the equilibrium real wage equals $40,000.
II. at the equilibrium real wage, 100 million workers are employed.
III. the equilibrium real wage is that which prevails when the economy achieves its natural level of employment.
A) I only
B) I and II only
C) I, II, and III
D) None of the above; to determine if the labor market is in equilibrium, we need information on the economy's aggregate production function.
Panel (a) shows an economy's aggregate production function, Panel (b) shows the labor market and Panel (c) shows the economy's long-run aggregate supply curve.Refer to Figure 8-5. In the labor market represented in Panel (b),
I. the equilibrium real wage equals $40,000.
II. at the equilibrium real wage, 100 million workers are employed.
III. the equilibrium real wage is that which prevails when the economy achieves its natural level of employment.
A) I only
B) I and II only
C) I, II, and III
D) None of the above; to determine if the labor market is in equilibrium, we need information on the economy's aggregate production function.
فتح الحزمة
افتح القفل للوصول البطاقات البالغ عددها 135 في هذه المجموعة.
فتح الحزمة
k this deck
57
Figure 8-5 Panel (a) shows an economy's aggregate production function, Panel (b) shows the labor market and Panel (c) shows the economy's long-run aggregate supply curve.
Refer to Figure 8-5. The economy could achieve its potential output at a price level- nominal wage combination of
A) 1.5 and $60,000.
B) 1.0 and $50,000.
C) 1.0 and $45,000
D) 0.5 and $30,000.
Panel (a) shows an economy's aggregate production function, Panel (b) shows the labor market and Panel (c) shows the economy's long-run aggregate supply curve.Refer to Figure 8-5. The economy could achieve its potential output at a price level- nominal wage combination of
A) 1.5 and $60,000.
B) 1.0 and $50,000.
C) 1.0 and $45,000
D) 0.5 and $30,000.
فتح الحزمة
افتح القفل للوصول البطاقات البالغ عددها 135 في هذه المجموعة.
فتح الحزمة
k this deck
58
Consider a firm that produces output using labor and capital. The firm's stock of capital is fixed and in order to increase output, it must employ more workers. Which of the following occurs as the number of workers increases?
A) Output per worker rises.
B) Capital per worker falls.
C) Wage per worker falls.
D) Total output increases exponentially.
A) Output per worker rises.
B) Capital per worker falls.
C) Wage per worker falls.
D) Total output increases exponentially.
فتح الحزمة
افتح القفل للوصول البطاقات البالغ عددها 135 في هذه المجموعة.
فتح الحزمة
k this deck
59
Figure 8-4
Refer to Figure 8-4. The production function displays
A) increasing marginal returns to labor.
B) constant marginal returns to labor.
C) increasing marginal returns to labor initially followed by diminishing marginal returns.
D) diminishing marginal returns to labor.
Refer to Figure 8-4. The production function displays
A) increasing marginal returns to labor.
B) constant marginal returns to labor.
C) increasing marginal returns to labor initially followed by diminishing marginal returns.
D) diminishing marginal returns to labor.
فتح الحزمة
افتح القفل للوصول البطاقات البالغ عددها 135 في هذه المجموعة.
فتح الحزمة
k this deck
60
Figure 8-3
Refer to Figure 8-3. Exponential economic growth can be depicted by
A) a series of leftward shifts by constant amounts of the LRAS curve.
B) a series of rightward shifts by constant amounts of the LRAS curve.
C) shifts in the LRAS curve to the right in which the successive increases are larger and larger.
D) shifts in the LRAS curve to the left in which the successive decreases are larger and larger.
فتح الحزمة
افتح القفل للوصول البطاقات البالغ عددها 135 في هذه المجموعة.
فتح الحزمة
k this deck
61
Which of the following statements is true?
A) Technological gains tend to reduce the demand for labor because producers substitute technology and capital for labor.
B) Technological change and capital investment tend to increase real wages because labor productivity increases.
C) Technological change and capital investment tend to reduce the quantity of labor employed, and reduce real wages.
D) Technological change and capital investment tend to reduce the demand for labor and increase the supply of labor leading to an indeterminate effect on real wages.
فتح الحزمة
افتح القفل للوصول البطاقات البالغ عددها 135 في هذه المجموعة.
فتح الحزمة
k this deck
62
An increase in the capital stock would shift the production function _______ and the long-run aggregate supply curve to the _______.
A) upward; right
B) upward; left
C) downward; left
D) to the right; right
A) upward; right
B) upward; left
C) downward; left
D) to the right; right
فتح الحزمة
افتح القفل للوصول البطاقات البالغ عددها 135 في هذه المجموعة.
فتح الحزمة
k this deck
63
Which of the following events will shift the long-run aggregate supply curve?
A) a decrease in participation by women in the labor force
B) an increase in the economy's general price level
C) a liberal immigration policy that welcomes foreign workers
D) a decrease in the average work week from 40 hours to 36 hours
A) a decrease in participation by women in the labor force
B) an increase in the economy's general price level
C) a liberal immigration policy that welcomes foreign workers
D) a decrease in the average work week from 40 hours to 36 hours
فتح الحزمة
افتح القفل للوصول البطاقات البالغ عددها 135 في هذه المجموعة.
فتح الحزمة
k this deck
64
Figure 8-6
Refer to Figure 8-6. Assume that the economy is initially in long-run equilibrium. Suppose the federal government initiates a tax program that stimulates firms to increase their investment and this leads to economic growth. This policy might, in the short run, result in
A) a leftward shift of the aggregate demand and the short-run aggregate supply curve and in the long run, a rightward shift of the long-run aggregate supply curve.
B) a rightward shift of the aggregate demand curve and in the long run, a rightward shift of the long-run aggregate supply and the short-run aggregate supply curves.
C) a rightward shift of the short-run aggregate supply curve and in the long run, a rightward shift of the long-run aggregate supply curve.
D) a leftward shift of the aggregate demand curve and in the long run, a rightward shift of the long-run aggregate supply and the short-run aggregate supply curves.
فتح الحزمة
افتح القفل للوصول البطاقات البالغ عددها 135 في هذه المجموعة.
فتح الحزمة
k this deck
65
Figure 8-6
Refer to Figure 8-6. Assume that the economy is initially in long-run equilibrium. What happens if investment spending increases?
A) The short-run aggregate supply curve shifts right and the price level decreases.
B) The long-run aggregate supply curve shifts right and the price level decreases.
C) The long-run aggregate supply curve and the short-run aggregate supply curve shift right and the price level decreases.
D) The aggregate demand curve shifts right and the price level increases.
فتح الحزمة
افتح القفل للوصول البطاقات البالغ عددها 135 في هذه المجموعة.
فتح الحزمة
k this deck
66
Which of the following must also shift if the long-run aggregate supply curve shifts?
A) the aggregate production function or the aggregate demand curve
B) the aggregate production function or the labor demand curve
C) the aggregate demand curve and the short-run aggregate supply curve
D) the aggregate demand curve and the labor supply curve
A) the aggregate production function or the aggregate demand curve
B) the aggregate production function or the labor demand curve
C) the aggregate demand curve and the short-run aggregate supply curve
D) the aggregate demand curve and the labor supply curve
فتح الحزمة
افتح القفل للوصول البطاقات البالغ عددها 135 في هذه المجموعة.
فتح الحزمة
k this deck
67
Figure 8-5 Panel (a) shows an economy's aggregate production function, Panel (b) shows the labor market and Panel (c) shows the economy's long-run aggregate supply curve.
Refer to Figure 8-5. If a change in technology moves the aggregate production function upward,
A) the demand for labor will remain the same.
B) the demand for labor falls.
C) the demand for labor increases.
D) the demand and supply of labor will increase.
Panel (a) shows an economy's aggregate production function, Panel (b) shows the labor market and Panel (c) shows the economy's long-run aggregate supply curve.Refer to Figure 8-5. If a change in technology moves the aggregate production function upward,
A) the demand for labor will remain the same.
B) the demand for labor falls.
C) the demand for labor increases.
D) the demand and supply of labor will increase.
فتح الحزمة
افتح القفل للوصول البطاقات البالغ عددها 135 في هذه المجموعة.
فتح الحزمة
k this deck
68
In the U.S., between 1990 and 2007, capital stock and the level of technology increased dramatically. During the same period, employment and real wages rose. What do these set of events suggest?
A) The demand for labor increased by more than the increase in supply of labor over this period.
B) The demand for labor increased by less than the increase in supply of labor over this period.
C) The demand for labor decreased while the supply of labor increased over this period.
D) The demand for labor and the supply of labor decreased over this period.
فتح الحزمة
افتح القفل للوصول البطاقات البالغ عددها 135 في هذه المجموعة.
فتح الحزمة
k this deck
69
The position of the long-run aggregate supply curve is determined by
I. the aggregate production function
II. the labor demand curve
III. the labor supply curve
IV. the prevailing average price level
A) I, II, III, and IV
B) I, II, and III only
C) I and IV only
D) I, II, III, and IV.
I. the aggregate production function
II. the labor demand curve
III. the labor supply curve
IV. the prevailing average price level
A) I, II, III, and IV
B) I, II, and III only
C) I and IV only
D) I, II, III, and IV.
فتح الحزمة
افتح القفل للوصول البطاقات البالغ عددها 135 في هذه المجموعة.
فتح الحزمة
k this deck
70
Figure 8-5 Panel (a) shows an economy's aggregate production function, Panel (b) shows the labor market and Panel (c) shows the economy's long-run aggregate supply curve.
Refer to Figure 8-5. In the long run, any price level is consistent with a real wage of $40,000 because
A) real wage is perfectly flexible.
B) the labor force is perfectly mobile.
C) nominal wage is perfectly flexible.
D) nominal wage is sticky.
Panel (a) shows an economy's aggregate production function, Panel (b) shows the labor market and Panel (c) shows the economy's long-run aggregate supply curve.Refer to Figure 8-5. In the long run, any price level is consistent with a real wage of $40,000 because
A) real wage is perfectly flexible.
B) the labor force is perfectly mobile.
C) nominal wage is perfectly flexible.
D) nominal wage is sticky.
فتح الحزمة
افتح القفل للوصول البطاقات البالغ عددها 135 في هذه المجموعة.
فتح الحزمة
k this deck
71
The model of aggregate demand and long-run aggregate supply predicts that, all other things unchanged, improved technology will
A) reduce employment.
B) lower real wages.
C) increase the demand for labor and boost real wages.
D) increase the supply of labor and boost real wages.
A) reduce employment.
B) lower real wages.
C) increase the demand for labor and boost real wages.
D) increase the supply of labor and boost real wages.
فتح الحزمة
افتح القفل للوصول البطاقات البالغ عددها 135 في هذه المجموعة.
فتح الحزمة
k this deck
72
Figure 8-5 Panel (a) shows an economy's aggregate production function, Panel (b) shows the labor market and Panel (c) shows the economy's long-run aggregate supply curve.
Refer to Figure 8-5. If a change in technology moves the aggregate production function in Panel (a) upwards, what happens to the economy's potential output?
A) Potential output remains unchanged.
B) Potential output increases.
C) Potential output decreases.
D) Potential output could increase or decrease depending on what happens in the labor market.
Panel (a) shows an economy's aggregate production function, Panel (b) shows the labor market and Panel (c) shows the economy's long-run aggregate supply curve.Refer to Figure 8-5. If a change in technology moves the aggregate production function in Panel (a) upwards, what happens to the economy's potential output?
A) Potential output remains unchanged.
B) Potential output increases.
C) Potential output decreases.
D) Potential output could increase or decrease depending on what happens in the labor market.
فتح الحزمة
افتح القفل للوصول البطاقات البالغ عددها 135 في هذه المجموعة.
فتح الحزمة
k this deck
73
Figure 8-6
Refer to Figure 8-6. Assume that the economy is initially in long-run equilibrium. What happens if the price of oil, a key input, increases significantly in the economy?
A) The long-run aggregate supply and the short-run aggregate supply curves shift left.
B) The short-run aggregate supply curve shifts left.
C) The aggregate demand and the short-run aggregate supply curves shift left.
D) The long-run aggregate supply, the short-run aggregate supply, and the aggregate demand curves shift left.
فتح الحزمة
افتح القفل للوصول البطاقات البالغ عددها 135 في هذه المجموعة.
فتح الحزمة
k this deck
74
Figure 8-6
Refer to Figure 8-6. Assume that the economy is initially in long-run equilibrium. If oil prices in the economy increased dramatically and remained high for so long that most of the industries in the economy had to significantly form new capital and retool much of its existing capital, the economy would suffer. In this event,
A) the long-run aggregate supply and the short-run aggregate supply curves would shift left, reducing the future industrial capacity and prospects for economic growth.
B) the aggregate demand curve would shift left, reducing the future industrial capacity and prospects for economic growth.
C) only the short-run aggregate supply curve would shift left, permanently reducing the economy's potential output.
D) the long-run aggregate supply, the short-run aggregate supply, and the aggregate demand curves would shift left, sending the economy into a long recession.
فتح الحزمة
افتح القفل للوصول البطاقات البالغ عددها 135 في هذه المجموعة.
فتح الحزمة
k this deck
75
Figure 8-5 Panel (a) shows an economy's aggregate production function, Panel (b) shows the labor market and Panel (c) shows the economy's long-run aggregate supply curve.
Refer to Figure 8-5. An upward shift of the aggregate production function would lead to
A) a decrease in the real wage and to a decrease in real GDP.
B) an increase in the real wage and to a decrease in real GDP.
C) a decrease in the real wage and to an increase in real GDP.
D) an increase in the real wage and to an increase in real GDP.
Panel (a) shows an economy's aggregate production function, Panel (b) shows the labor market and Panel (c) shows the economy's long-run aggregate supply curve.Refer to Figure 8-5. An upward shift of the aggregate production function would lead to
A) a decrease in the real wage and to a decrease in real GDP.
B) an increase in the real wage and to a decrease in real GDP.
C) a decrease in the real wage and to an increase in real GDP.
D) an increase in the real wage and to an increase in real GDP.
فتح الحزمة
افتح القفل للوصول البطاقات البالغ عددها 135 في هذه المجموعة.
فتح الحزمة
k this deck
76
Which of the following will not increase the productivity of labor?
A) technological improvements
B) an increase in the capital stock
C) improvements in education
D) an increase in the size of the labor force
A) technological improvements
B) an increase in the capital stock
C) improvements in education
D) an increase in the size of the labor force
فتح الحزمة
افتح القفل للوصول البطاقات البالغ عددها 135 في هذه المجموعة.
فتح الحزمة
k this deck
77
Figure 8-5 Panel (a) shows an economy's aggregate production function, Panel (b) shows the labor market and Panel (c) shows the economy's long-run aggregate supply curve.
Refer to Figure 8-5. In Panel (c), the long-run aggregate supply curve is vertical because
A) of diminishing marginal returns.
B) of sticky wages and prices.
C) perfectly flexible nominal wages in the long run allow any number of wage/price level combinations to result in a real wage that equilibrates the labor market.
D) the economy is not constrained by diminishing marginal returns since it can change the quantities of all factors of production.
Panel (a) shows an economy's aggregate production function, Panel (b) shows the labor market and Panel (c) shows the economy's long-run aggregate supply curve.Refer to Figure 8-5. In Panel (c), the long-run aggregate supply curve is vertical because
A) of diminishing marginal returns.
B) of sticky wages and prices.
C) perfectly flexible nominal wages in the long run allow any number of wage/price level combinations to result in a real wage that equilibrates the labor market.
D) the economy is not constrained by diminishing marginal returns since it can change the quantities of all factors of production.
فتح الحزمة
افتح القفل للوصول البطاقات البالغ عددها 135 في هذه المجموعة.
فتح الحزمة
k this deck
78
Figure 8-6
Refer to Figure 8-6. Assume that the economy is initially in long-run equilibrium. What happens in the long-run if the capital stock in this economy increases over time?
A) The nation's capacity to produce will increase as represented by a rightward shift of the long-run aggregate supply curve.
B) The nation's capacity to produce will increase as represented by a rightward shift of the short-run aggregate supply curve. The long-run aggregate supply curve and the aggregate demand curves remain unchanged.
C) The nation's capacity to produce will increase as represented by a rightward shift of the long-run aggregate demand curve.
D) The nation's capacity to produce will increase as represented by a rightward shift of the short-run aggregate supply curve and the aggregate demand curve. The long-run aggregate supply curve remains unchanged.
فتح الحزمة
افتح القفل للوصول البطاقات البالغ عددها 135 في هذه المجموعة.
فتح الحزمة
k this deck
79
Figure 8-5 Panel (a) shows an economy's aggregate production function, Panel (b) shows the labor market and Panel (c) shows the economy's long-run aggregate supply curve.
Refer to Figure 8-5. In Panel (c), the position of the long-run aggregate supply curve is determined by
A) the economy's potential output and its aggregate production function.
B) the economy's potential output and the demand and supply curves for labor.
C) the price level and potential output.
D) the price level and the demand and supply curves for labor.
Panel (a) shows an economy's aggregate production function, Panel (b) shows the labor market and Panel (c) shows the economy's long-run aggregate supply curve.Refer to Figure 8-5. In Panel (c), the position of the long-run aggregate supply curve is determined by
A) the economy's potential output and its aggregate production function.
B) the economy's potential output and the demand and supply curves for labor.
C) the price level and potential output.
D) the price level and the demand and supply curves for labor.
فتح الحزمة
افتح القفل للوصول البطاقات البالغ عددها 135 في هذه المجموعة.
فتح الحزمة
k this deck
80
Which of the following would shift the production function upward?
A) an increase in the price of oil
B) an increase in the availability of a natural resource
C) a decrease in the supply of labor
D) an increase in the nominal wage rate
A) an increase in the price of oil
B) an increase in the availability of a natural resource
C) a decrease in the supply of labor
D) an increase in the nominal wage rate
فتح الحزمة
افتح القفل للوصول البطاقات البالغ عددها 135 في هذه المجموعة.
فتح الحزمة
k this deck
فتح الحزمة
افتح القفل للوصول البطاقات البالغ عددها 135 في هذه المجموعة.


