Deck 24: The Government and Fiscal Policy
ملء الشاشة (f)
سؤال
Refer to the information provided in Table 24.1 below to answer the question(s) that follow.
Table 24.1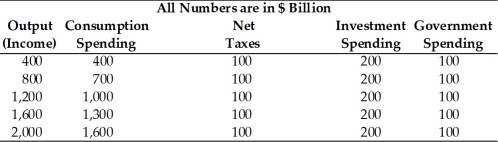
Refer to Table 24.1. At an output level of $1,200 billion, the level of aggregate expenditure is
A) $1,000 billion.
B) $1,200 billion.
C) $1,300 billion.
D) $1,400 billion.
Table 24.1
Refer to Table 24.1. At an output level of $1,200 billion, the level of aggregate expenditure is
A) $1,000 billion.
B) $1,200 billion.
C) $1,300 billion.
D) $1,400 billion.
سؤال
سؤال
سؤال
سؤال
Refer to the information provided in Table 24.1 below to answer the question(s) that follow.
Table 24.1
Refer to Table 24.1. At an output level of $1,200 billion, there is an unplanned inventory change of
A) positive $10 billion.
B) zero.
C) negative $100 billion.
D) positive $100 billion.
Table 24.1
Refer to Table 24.1. At an output level of $1,200 billion, there is an unplanned inventory change of
A) positive $10 billion.
B) zero.
C) negative $100 billion.
D) positive $100 billion.
سؤال
سؤال
سؤال
سؤال
سؤال
سؤال
سؤال
سؤال
Refer to the information provided in Table 24.1 below to answer the question(s) that follow.
Table 24.1
Refer to Table 24.1. At an output level of $2,000 billion, the level of aggregate expenditure is
A) $1,500 billion.
B) $1,800 billion.
C) $1,900 billion.
D) $2,000 billion.
Table 24.1
Refer to Table 24.1. At an output level of $2,000 billion, the level of aggregate expenditure is
A) $1,500 billion.
B) $1,800 billion.
C) $1,900 billion.
D) $2,000 billion.
سؤال
سؤال
سؤال
سؤال
سؤال
سؤال
سؤال
سؤال
Refer to the information provided in Table 24.1 below to answer the question(s) that follow.
Table 24.1
Refer to Table 24.1. At an output level of $2,000 billion, there is an unplanned inventory change of
A) positive $100 billion.
B) positive $10 billion.
C) negative $100 billion.
D) zero.
Table 24.1
Refer to Table 24.1. At an output level of $2,000 billion, there is an unplanned inventory change of
A) positive $100 billion.
B) positive $10 billion.
C) negative $100 billion.
D) zero.
سؤال
Refer to the information provided in Table 24.2 below to answer the question(s) that follow.
Table 24.2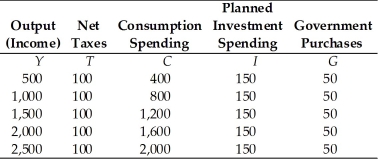
Refer to Table 24.2. At an output level of $2,500, the level for saving
A) is $300.
B) is $400.
C) is $500.
D) cannot be determined from this information.
Table 24.2
Refer to Table 24.2. At an output level of $2,500, the level for saving
A) is $300.
B) is $400.
C) is $500.
D) cannot be determined from this information.
سؤال
Refer to the information provided in Table 24.1 below to answer the question(s) that follow.
Table 24.1
Refer to Table 24.1. The equilibrium level of output is ________ billion.
A) $800
B) $1,200
C) $1,600
D) $2,000
Table 24.1
Refer to Table 24.1. The equilibrium level of output is ________ billion.
A) $800
B) $1,200
C) $1,600
D) $2,000
سؤال
Refer to the information provided in Table 24.2 below to answer the question(s) that follow.
Table 24.2
Refer to Table 24.2. At an output level of $1,500 billion, there is an unplanned inventory
A) decrease of $200 billion.
B) change of $0.
C) increase of $100 billion.
D) increase of $150 billion.
Table 24.2
Refer to Table 24.2. At an output level of $1,500 billion, there is an unplanned inventory
A) decrease of $200 billion.
B) change of $0.
C) increase of $100 billion.
D) increase of $150 billion.
سؤال
Refer to the information provided in Table 24.1 below to answer the question(s) that follow.
Table 24.1
Refer to Table 24.1. At an output level of $800 billion, disposable income equals ________ billion.
A) $800
B) $700
C) $600
D) $500
Table 24.1
Refer to Table 24.1. At an output level of $800 billion, disposable income equals ________ billion.
A) $800
B) $700
C) $600
D) $500
سؤال
Refer to the information provided in Table 24.2 below to answer the question(s) that follow.
Table 24.2
Refer to Table 24.2. At an output level of $2,500, there is a tendency for output
A) to increase.
B) to remain constant.
C) to either increase or decrease.
D) to fall.
Table 24.2
Refer to Table 24.2. At an output level of $2,500, there is a tendency for output
A) to increase.
B) to remain constant.
C) to either increase or decrease.
D) to fall.
سؤال
Refer to the information provided in Table 24.2 below to answer the question(s) that follow.
Table 24.2
Refer to Equation 24.1. The equilibrium level of output for the Italian economy is
A) $2,850.
B) $3,145.
C) $3,700.
D) $3,800.
Table 24.2
Refer to Equation 24.1. The equilibrium level of output for the Italian economy is
A) $2,850.
B) $3,145.
C) $3,700.
D) $3,800.
سؤال
Refer to the information provided in Table 24.1 below to answer the question(s) that follow.
Table 24.1
Refer to Table 24.1. At the equilibrium level of income, leakages equal ________ billion.
A) $0
B) $100
C) $200
D) $300
Table 24.1
Refer to Table 24.1. At the equilibrium level of income, leakages equal ________ billion.
A) $0
B) $100
C) $200
D) $300
سؤال
Refer to the information provided in Table 24.2 below to answer the question(s) that follow.
Table 24.2
Refer to Equation 24.2. At equilibrium, the sum of investment and government purchases in Canada is
A) $1,800.
B) $1,750.
C) $1,500.
D) cannot be determined from the given information.
Table 24.2
Refer to Equation 24.2. At equilibrium, the sum of investment and government purchases in Canada is
A) $1,800.
B) $1,750.
C) $1,500.
D) cannot be determined from the given information.
سؤال
Refer to the information provided in Table 24.1 below to answer the question(s) that follow.
Table 24.1
Refer to Table 24.1. At an output level of $2,000 billion, the value of saving
A) cannot be determined from the given information.
B) is $300 billion.
C) is $200 billion.
D) is $100 billion.
Table 24.1
Refer to Table 24.1. At an output level of $2,000 billion, the value of saving
A) cannot be determined from the given information.
B) is $300 billion.
C) is $200 billion.
D) is $100 billion.
سؤال
Refer to the information provided in Table 24.2 below to answer the question(s) that follow.
Table 24.2
Refer to Table 24.2. At an output level of $1,500 billion, the level of aggregate expenditure is ________ billion.
A) $1,300
B) $1,400
C) $1,500
D) $1,600
Table 24.2
Refer to Table 24.2. At an output level of $1,500 billion, the level of aggregate expenditure is ________ billion.
A) $1,300
B) $1,400
C) $1,500
D) $1,600
سؤال
Refer to the information provided in Table 24.2 below to answer the question(s) that follow.
Table 24.2
Refer to Table 24.2. At an output level of $2,500, the level of aggregate expenditure is ________ billion.
A) $1,500
B) $2,000
C) $2,200
D) $2,300
Table 24.2
Refer to Table 24.2. At an output level of $2,500, the level of aggregate expenditure is ________ billion.
A) $1,500
B) $2,000
C) $2,200
D) $2,300
سؤال
Refer to the information provided in Table 24.2 below to answer the question(s) that follow.
Table 24.2
Refer to Equation 24.1. At the equilibrium level of output in Italy, saving equals
A) $400.
B) $450.
C) $500.
D) $550.
Table 24.2
Refer to Equation 24.1. At the equilibrium level of output in Italy, saving equals
A) $400.
B) $450.
C) $500.
D) $550.
سؤال
Refer to the information provided in Table 24.2 below to answer the question(s) that follow.
Table 24.2
Refer to Equation 24.1. At the equilibrium level of output in Italy, leakages equal
A) $600.
B) $650.
C) $700.
D) $750.
Table 24.2
Refer to Equation 24.1. At the equilibrium level of output in Italy, leakages equal
A) $600.
B) $650.
C) $700.
D) $750.
سؤال
Refer to the information provided in Table 24.2 below to answer the question(s) that follow.
Table 24.2
Refer to Table 24.2 At the equilibrium level of income, leakages equal ________ billion.
A) $0
B) $300
C) $500
D) $200
Table 24.2
Refer to Table 24.2 At the equilibrium level of income, leakages equal ________ billion.
A) $0
B) $300
C) $500
D) $200
سؤال
Refer to the information provided in Table 24.2 below to answer the question(s) that follow.
Table 24.2
Refer to Table 24.2. At an output level of $1,500, disposable income
A) is $1,000.
B) is $1,200.
C) is $1,400.
D) cannot be determined from this information.
Table 24.2
Refer to Table 24.2. At an output level of $1,500, disposable income
A) is $1,000.
B) is $1,200.
C) is $1,400.
D) cannot be determined from this information.
سؤال
Refer to the information provided in Table 24.2 below to answer the question(s) that follow.
Table 24.2
Refer to Equation 24.1. At the equilibrium level of output in Italy, consumption equals
A) $3,100.
B) $3,250.
C) $3,400.
D) $3,625.
Table 24.2
Refer to Equation 24.1. At the equilibrium level of output in Italy, consumption equals
A) $3,100.
B) $3,250.
C) $3,400.
D) $3,625.
سؤال
Refer to the information provided in Table 24.2 below to answer the question(s) that follow.
Table 24.2
Refer to Table 24.2. The equilibrium level of output is ________ billion.
A) $1000
B) $1,500
C) $2,000
D) $2,500
Table 24.2
Refer to Table 24.2. The equilibrium level of output is ________ billion.
A) $1000
B) $1,500
C) $2,000
D) $2,500
سؤال
Refer to the information provided in Table 24.1 below to answer the question(s) that follow.
Table 24.1
Refer to Table 24.1 At an output level of $1,200 billion, there is a tendency for output
A) to fall.
B) to increase.
C) to remain constant.
D) to either increase or decrease.
Table 24.1
Refer to Table 24.1 At an output level of $1,200 billion, there is a tendency for output
A) to fall.
B) to increase.
C) to remain constant.
D) to either increase or decrease.
سؤال
Refer to the information provided in Table 24.2 below to answer the question(s) that follow.
Table 24.2
Refer to Table 24.2. At an output level of $2,500, there is an unplanned inventory
A) increase of $300 billion.
B) decrease of $200 billion.
C) change of $0.
D) increase of $200 billion.
Table 24.2
Refer to Table 24.2. At an output level of $2,500, there is an unplanned inventory
A) increase of $300 billion.
B) decrease of $200 billion.
C) change of $0.
D) increase of $200 billion.
سؤال
Refer to the information provided in Figure 24.1 below to answer the question(s) that follow. 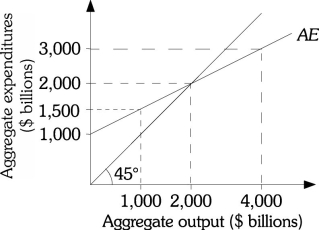 Figure 24.1
Refer to Figure 24.1. Suppose that the consumption function is C = 400 + 0.5Yd and taxes are $200 billion, at equilibrium, what is the value of consumption?
A) $2,000
B) $1,350
C) $1,300
D) $1,150
Figure 24.1Refer to Figure 24.1. Suppose that the consumption function is C = 400 + 0.5Yd and taxes are $200 billion, at equilibrium, what is the value of consumption?
A) $2,000
B) $1,350
C) $1,300
D) $1,150
سؤال
Refer to the information provided in Table 24.2 below to answer the question(s) that follow.
Table 24.2
Refer to Equation 24.2. At equilibrium leakages in Canada equal
A) $1,700.
B) $1,750.
C) $1,800.
D) $2,100.
Table 24.2
Refer to Equation 24.2. At equilibrium leakages in Canada equal
A) $1,700.
B) $1,750.
C) $1,800.
D) $2,100.
سؤال
Refer to the information provided in Figure 24.1 below to answer the question(s) that follow. Figure 24.1
Refer to Figure 24.1. In this economy, 0.5 represents the
A) MPC.
B) MPS.
C) multiplier.
D) both A and B
Figure 24.1Refer to Figure 24.1. In this economy, 0.5 represents the
A) MPC.
B) MPS.
C) multiplier.
D) both A and B
سؤال
سؤال
Refer to the information provided in Figure 24.1 below to answer the question(s) that follow. Figure 24.1
Refer to Figure 24.1. At equilibrium, injections
A) can be greater than $1,000 billion.
B) equal $1,500 billion.
C) equal leakages.
D) equal $2,000 billion.
Figure 24.1Refer to Figure 24.1. At equilibrium, injections
A) can be greater than $1,000 billion.
B) equal $1,500 billion.
C) equal leakages.
D) equal $2,000 billion.
سؤال
Refer to the information provided in Figure 24.1 below to answer the question(s) that follow. Figure 24.1
Refer to Figure 24.1. The equilibrium level of aggregate expenditure is $________ billion.
A) 4,000
B) 3,000
C) 2,000
D) 1,500
Figure 24.1Refer to Figure 24.1. The equilibrium level of aggregate expenditure is $________ billion.
A) 4,000
B) 3,000
C) 2,000
D) 1,500
سؤال
Refer to the information provided in Figure 24.1 below to answer the question(s) that follow. Figure 24.1
Refer to Figure 24.1. At equilibrium, the part of consumption that is dependent on income equals $________ billion.
A) $2,000
B) $1,500
C) $1,000
D) cannot be determined from the given information
Figure 24.1Refer to Figure 24.1. At equilibrium, the part of consumption that is dependent on income equals $________ billion.
A) $2,000
B) $1,500
C) $1,000
D) cannot be determined from the given information
سؤال
سؤال
سؤال
Refer to the information provided in Figure 24.1 below to answer the question(s) that follow. Figure 24.1
Refer to Figure 24.1. Suppose that the consumption function is C = 400 + 0.5Yd and taxes are $200 billion, at equilibrium the value of injections are
A) $700 billion.
B) $650 billion.
C) $500 billion.
D) $350 billion.
Figure 24.1Refer to Figure 24.1. Suppose that the consumption function is C = 400 + 0.5Yd and taxes are $200 billion, at equilibrium the value of injections are
A) $700 billion.
B) $650 billion.
C) $500 billion.
D) $350 billion.
سؤال
Refer to the information provided in Figure 24.1 below to answer the question(s) that follow. Figure 24.1
Refer to Figure 24.1. Suppose that the consumption function is C = 200 + 0.5Yd and taxes are $200 billion, at equilibrium, what is the value of consumption?
A) $1,100
B) $1,250
C) $1,350
D) $1,800
Figure 24.1Refer to Figure 24.1. Suppose that the consumption function is C = 200 + 0.5Yd and taxes are $200 billion, at equilibrium, what is the value of consumption?
A) $1,100
B) $1,250
C) $1,350
D) $1,800
سؤال
Refer to the information provided in Figure 24.1 below to answer the question(s) that follow. Figure 24.1
Refer to Figure 24.1. Suppose that the consumption function is C = 300 + 0.5Yd and taxes are $300 billion, at equilibrium the value of autonomous consumption is
A) $400 billion.
B) $300 billion.
C) $200 billion.
D) $100 billion.
Figure 24.1Refer to Figure 24.1. Suppose that the consumption function is C = 300 + 0.5Yd and taxes are $300 billion, at equilibrium the value of autonomous consumption is
A) $400 billion.
B) $300 billion.
C) $200 billion.
D) $100 billion.
سؤال
Refer to the information provided in Figure 24.1 below to answer the question(s) that follow. Figure 24.1
Refer to Figure 24.1. The MPC in this economy is
A) 0.4.
B) 0.5.
C) 0.6.
D) cannot be determined from the given information.
Figure 24.1Refer to Figure 24.1. The MPC in this economy is
A) 0.4.
B) 0.5.
C) 0.6.
D) cannot be determined from the given information.
سؤال
Refer to the information provided in Figure 24.1 below to answer the question(s) that follow. Figure 24.1
Refer to Figure 24.1. At equilibrium, $1,000 billion represents
A) the part of consumption that is dependent on income.
B) the part of consumption that is not dependent on income.
C) equilibrium income.
D) Both A and B are correct.
Figure 24.1Refer to Figure 24.1. At equilibrium, $1,000 billion represents
A) the part of consumption that is dependent on income.
B) the part of consumption that is not dependent on income.
C) equilibrium income.
D) Both A and B are correct.
سؤال
Refer to the information provided in Table 24.2 below to answer the question(s) that follow.
Table 24.2
Refer to Equation 24.2. At equilibrium, government purchases in Canada is
A) $1,500.
B) $1,250.
C) $1,000.
D) cannot be determined from the given information.
Table 24.2
Refer to Equation 24.2. At equilibrium, government purchases in Canada is
A) $1,500.
B) $1,250.
C) $1,000.
D) cannot be determined from the given information.
سؤال
Refer to the information provided in Figure 24.1 below to answer the question(s) that follow. Figure 24.1
Refer to Figure 24.1. Injections = leakages
A) when income = zero.
B) when consumption = saving.
C) at equilibrium.
D) when output = investment.
Figure 24.1Refer to Figure 24.1. Injections = leakages
A) when income = zero.
B) when consumption = saving.
C) at equilibrium.
D) when output = investment.
سؤال
Refer to the information provided in Table 24.2 below to answer the question(s) that follow.
Table 24.2
Refer to Equation 24.2. At equilibrium, saving in Canada equals
A) $1,200.
B) $1,250.
C) $1,350.
D) $1,600.
Table 24.2
Refer to Equation 24.2. At equilibrium, saving in Canada equals
A) $1,200.
B) $1,250.
C) $1,350.
D) $1,600.
سؤال
Refer to the information provided in Figure 24.1 below to answer the question(s) that follow. Figure 24.1
Refer to Figure 24.1. Suppose that the consumption function is C = 200 + 0.4Yd and taxes are $200 billion, at equilibrium the value of injections are
A) $1,080 billion.
B) $840 billion.
C) $720 billion.
D) $650 billion.
Figure 24.1Refer to Figure 24.1. Suppose that the consumption function is C = 200 + 0.4Yd and taxes are $200 billion, at equilibrium the value of injections are
A) $1,080 billion.
B) $840 billion.
C) $720 billion.
D) $650 billion.
سؤال
Refer to the information provided in Figure 24.1 below to answer the question(s) that follow. Figure 24.1
Refer to Figure 24.1. Aggregate expenditures = aggregate output at $ ________ billion.
A) 1,500
B) 2,000
C) 3,000
D) 4,000
Figure 24.1Refer to Figure 24.1. Aggregate expenditures = aggregate output at $ ________ billion.
A) 1,500
B) 2,000
C) 3,000
D) 4,000
سؤال
Refer to the information provided in Figure 24.1 below to answer the question(s) that follow. Figure 24.1
Refer to Figure 24.1. Suppose that the consumption function is C = 400 + 0.5Yd and taxes are $200 billion, at equilibrium the value of autonomous consumption is
A) $400 billion.
B) $300 billion.
C) $200 billion.
D) $100 billion.
Figure 24.1Refer to Figure 24.1. Suppose that the consumption function is C = 400 + 0.5Yd and taxes are $200 billion, at equilibrium the value of autonomous consumption is
A) $400 billion.
B) $300 billion.
C) $200 billion.
D) $100 billion.
سؤال
سؤال
سؤال
سؤال
سؤال
سؤال
Refer to the information provided in Table 24.3 below to answer the question(s) that follow.
Table 24.3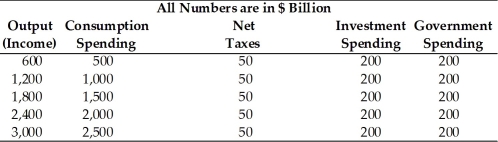
Refer to Table 24.3. At an output level of $1,200 billion, there is an unplanned inventory change of
A) positive $100 billion.
B) zero.
C) negative $200 billion.
D) positive $200 billion.
Table 24.3
Refer to Table 24.3. At an output level of $1,200 billion, there is an unplanned inventory change of
A) positive $100 billion.
B) zero.
C) negative $200 billion.
D) positive $200 billion.
سؤال
Refer to the information provided in Table 24.3 below to answer the question(s) that follow.
Table 24.3
Refer to Table 24.3. At an output level of $1,200 billion, the level of aggregate expenditure is
A) $1,100 billion.
B) $1,250 billion.
C) $1,400 billion.
D) $1,450 billion.
Table 24.3
Refer to Table 24.3. At an output level of $1,200 billion, the level of aggregate expenditure is
A) $1,100 billion.
B) $1,250 billion.
C) $1,400 billion.
D) $1,450 billion.
سؤال
سؤال
سؤال
سؤال
سؤال
سؤال
سؤال
سؤال
سؤال
سؤال
سؤال
سؤال
سؤال

فتح الحزمة
قم بالتسجيل لفتح البطاقات في هذه المجموعة!
Unlock Deck
Unlock Deck
1/360
العب
ملء الشاشة (f)
Deck 24: The Government and Fiscal Policy
1
Refer to the information provided in Table 24.1 below to answer the question(s) that follow.
Table 24.1
Refer to Table 24.1. At an output level of $1,200 billion, the level of aggregate expenditure is
A) $1,000 billion.
B) $1,200 billion.
C) $1,300 billion.
D) $1,400 billion.
Table 24.1
Refer to Table 24.1. At an output level of $1,200 billion, the level of aggregate expenditure is
A) $1,000 billion.
B) $1,200 billion.
C) $1,300 billion.
D) $1,400 billion.
$1,300 billion.
2
After government is added to the income-expenditure model, the formula for the aggregate consumption function is
A) C = a - b(Y - T).
B) C = a - b(T - Y).
C) C = a + b(Y + T).
D) C = a + b(Y - T).
A) C = a - b(Y - T).
B) C = a - b(T - Y).
C) C = a + b(Y + T).
D) C = a + b(Y - T).
C = a + b(Y - T).
3
In 2016, the city of Miketown collected $250,000 in taxes and spent $350,000. In 2016, the city of Miketown had a
A) budget surplus of $100,000.
B) budget surplus of 57%.
C) budget deficit of $100,000.
D) budget deficit of $200,000.
A) budget surplus of $100,000.
B) budget surplus of 57%.
C) budget deficit of $100,000.
D) budget deficit of $200,000.
budget deficit of $100,000.
4
Which of the following is incorrect regarding tax revenues?
A) they increase during recessions
B) they change with changes in the tax rate
C) they are a revenue source in the government's budget
D) they increase during economic expansions
A) they increase during recessions
B) they change with changes in the tax rate
C) they are a revenue source in the government's budget
D) they increase during economic expansions
فتح الحزمة
افتح القفل للوصول البطاقات البالغ عددها 360 في هذه المجموعة.
فتح الحزمة
k this deck
5
Refer to the information provided in Table 24.1 below to answer the question(s) that follow.
Table 24.1
Refer to Table 24.1. At an output level of $1,200 billion, there is an unplanned inventory change of
A) positive $10 billion.
B) zero.
C) negative $100 billion.
D) positive $100 billion.
Table 24.1
Refer to Table 24.1. At an output level of $1,200 billion, there is an unplanned inventory change of
A) positive $10 billion.
B) zero.
C) negative $100 billion.
D) positive $100 billion.
فتح الحزمة
افتح القفل للوصول البطاقات البالغ عددها 360 في هذه المجموعة.
فتح الحزمة
k this deck
6
Disposable income
A) increases when net taxes increase.
B) increases when income increases.
C) decreases when saving increases.
D) increases when saving decreases.
A) increases when net taxes increase.
B) increases when income increases.
C) decreases when saving increases.
D) increases when saving decreases.
فتح الحزمة
افتح القفل للوصول البطاقات البالغ عددها 360 في هذه المجموعة.
فتح الحزمة
k this deck
7
The difference between what a government spends and what it collects in taxes in a year is
A) net revenue.
B) net taxes.
C) the government budget deficit or surplus.
D) the government debt.
A) net revenue.
B) net taxes.
C) the government budget deficit or surplus.
D) the government debt.
فتح الحزمة
افتح القفل للوصول البطاقات البالغ عددها 360 في هذه المجموعة.
فتح الحزمة
k this deck
8
What determines tax revenues?
A) the income tax rate
B) the rate of interest
C) the money supply in the economy
D) the rate of inflation
A) the income tax rate
B) the rate of interest
C) the money supply in the economy
D) the rate of inflation
فتح الحزمة
افتح القفل للوصول البطاقات البالغ عددها 360 في هذه المجموعة.
فتح الحزمة
k this deck
9
Fiscal policy refers to
A) the techniques used by a business firm to reduce its tax liability.
B) the behavior of the nation's central bank, the Federal Reserve, regarding the nation's money supply.
C) the spending and taxing policies used by the government to influence the economy.
D) the government's ability to regulate a firm's behavior in the financial markets.
فتح الحزمة
افتح القفل للوصول البطاقات البالغ عددها 360 في هذه المجموعة.
فتح الحزمة
k this deck
10
During recessions, government spending usually
A) decreases because unemployment payments decrease.
B) increases because unemployment payments increase.
C) decrease because unemployment payments increase.
D) increases because unemployment payments decrease.
A) decreases because unemployment payments decrease.
B) increases because unemployment payments increase.
C) decrease because unemployment payments increase.
D) increases because unemployment payments decrease.
فتح الحزمة
افتح القفل للوصول البطاقات البالغ عددها 360 في هذه المجموعة.
فتح الحزمة
k this deck
11
The aggregate consumption function is C = 100 + 0.8Yd. If income is $600 and net taxes are zero, consumption equals
A) zero.
B) 360.
C) 460.
D) 580.
A) zero.
B) 360.
C) 460.
D) 580.
فتح الحزمة
افتح القفل للوصول البطاقات البالغ عددها 360 في هذه المجموعة.
فتح الحزمة
k this deck
12
The aggregate consumption function is C = 1,000 + 0.9Yd. If income is $3,600 and net taxes are $600, consumption equals
A) 2,400.
B) 3,400.
C) 3,700.
D) 4,000.
A) 2,400.
B) 3,400.
C) 3,700.
D) 4,000.
فتح الحزمة
افتح القفل للوصول البطاقات البالغ عددها 360 في هذه المجموعة.
فتح الحزمة
k this deck
13
Refer to the information provided in Table 24.1 below to answer the question(s) that follow.
Table 24.1
Refer to Table 24.1. At an output level of $2,000 billion, the level of aggregate expenditure is
A) $1,500 billion.
B) $1,800 billion.
C) $1,900 billion.
D) $2,000 billion.
Table 24.1
Refer to Table 24.1. At an output level of $2,000 billion, the level of aggregate expenditure is
A) $1,500 billion.
B) $1,800 billion.
C) $1,900 billion.
D) $2,000 billion.
فتح الحزمة
افتح القفل للوصول البطاقات البالغ عددها 360 في هذه المجموعة.
فتح الحزمة
k this deck
14
When the government sector is included in the income-expenditure model, the equation for aggregate income is
A) Y = C + S - T.
B) Y = C + I.
C) Y = C + I + G.
D) Y = C + S + I.
A) Y = C + S - T.
B) Y = C + I.
C) Y = C + I + G.
D) Y = C + S + I.
فتح الحزمة
افتح القفل للوصول البطاقات البالغ عددها 360 في هذه المجموعة.
فتح الحزمة
k this deck
15
Bill's income is $1,000 and his net taxes are $350. His disposable income is
A) $1,350.
B) $750.
C) $650.
D) -$350.
A) $1,350.
B) $750.
C) $650.
D) -$350.
فتح الحزمة
افتح القفل للوصول البطاقات البالغ عددها 360 في هذه المجموعة.
فتح الحزمة
k this deck
16
If output is less than planned aggregate expenditure, there will be
A) an unplanned increase in inventories.
B) an unplanned decrease in inventories.
C) no change in inventories.
D) a planned increase in inventories.
A) an unplanned increase in inventories.
B) an unplanned decrease in inventories.
C) no change in inventories.
D) a planned increase in inventories.
فتح الحزمة
افتح القفل للوصول البطاقات البالغ عددها 360 في هذه المجموعة.
فتح الحزمة
k this deck
17
The aggregate consumption function is C = 100 + 0.6Yd. If income is $1,000 and net taxes are $300, consumption equals
A) 800.
B) 700.
C) 580.
D) 520.
A) 800.
B) 700.
C) 580.
D) 520.
فتح الحزمة
افتح القفل للوصول البطاقات البالغ عددها 360 في هذه المجموعة.
فتح الحزمة
k this deck
18
The aggregate consumption function is C = 800 + 0.8Yd. If income is $2,000 and net taxes are $500, consumption equals
A) 1,500.
B) 2,000.
C) 2,050.
D) 2,150.
A) 1,500.
B) 2,000.
C) 2,050.
D) 2,150.
فتح الحزمة
افتح القفل للوصول البطاقات البالغ عددها 360 في هذه المجموعة.
فتح الحزمة
k this deck
19
In 2016, the city of Canfield collected $500,000 in taxes and spent $450,000. In 2016, the city of Canfield had a
A) budget surplus of $450,000.
B) budget surplus of $50,000.
C) budget deficit of $50,000.
D) budget surplus of $5,000.
A) budget surplus of $450,000.
B) budget surplus of $50,000.
C) budget deficit of $50,000.
D) budget surplus of $5,000.
فتح الحزمة
افتح القفل للوصول البطاقات البالغ عددها 360 في هذه المجموعة.
فتح الحزمة
k this deck
20
Which of the following is not a category of fiscal policy?
A) government policies regarding the purchase of goods and services
B) government policies regarding taxation
C) government policies regarding money supply in the economy
D) government policies regarding transfer payments and welfare benefits
A) government policies regarding the purchase of goods and services
B) government policies regarding taxation
C) government policies regarding money supply in the economy
D) government policies regarding transfer payments and welfare benefits
فتح الحزمة
افتح القفل للوصول البطاقات البالغ عددها 360 في هذه المجموعة.
فتح الحزمة
k this deck
21
Refer to the information provided in Table 24.1 below to answer the question(s) that follow.
Table 24.1
Refer to Table 24.1. At an output level of $2,000 billion, there is an unplanned inventory change of
A) positive $100 billion.
B) positive $10 billion.
C) negative $100 billion.
D) zero.
Table 24.1
Refer to Table 24.1. At an output level of $2,000 billion, there is an unplanned inventory change of
A) positive $100 billion.
B) positive $10 billion.
C) negative $100 billion.
D) zero.
فتح الحزمة
افتح القفل للوصول البطاقات البالغ عددها 360 في هذه المجموعة.
فتح الحزمة
k this deck
22
Refer to the information provided in Table 24.2 below to answer the question(s) that follow.
Table 24.2
Refer to Table 24.2. At an output level of $2,500, the level for saving
A) is $300.
B) is $400.
C) is $500.
D) cannot be determined from this information.
Table 24.2
Refer to Table 24.2. At an output level of $2,500, the level for saving
A) is $300.
B) is $400.
C) is $500.
D) cannot be determined from this information.
فتح الحزمة
افتح القفل للوصول البطاقات البالغ عددها 360 في هذه المجموعة.
فتح الحزمة
k this deck
23
Refer to the information provided in Table 24.1 below to answer the question(s) that follow.
Table 24.1
Refer to Table 24.1. The equilibrium level of output is ________ billion.
A) $800
B) $1,200
C) $1,600
D) $2,000
Table 24.1
Refer to Table 24.1. The equilibrium level of output is ________ billion.
A) $800
B) $1,200
C) $1,600
D) $2,000
فتح الحزمة
افتح القفل للوصول البطاقات البالغ عددها 360 في هذه المجموعة.
فتح الحزمة
k this deck
24
Refer to the information provided in Table 24.2 below to answer the question(s) that follow.
Table 24.2
Refer to Table 24.2. At an output level of $1,500 billion, there is an unplanned inventory
A) decrease of $200 billion.
B) change of $0.
C) increase of $100 billion.
D) increase of $150 billion.
Table 24.2
Refer to Table 24.2. At an output level of $1,500 billion, there is an unplanned inventory
A) decrease of $200 billion.
B) change of $0.
C) increase of $100 billion.
D) increase of $150 billion.
فتح الحزمة
افتح القفل للوصول البطاقات البالغ عددها 360 في هذه المجموعة.
فتح الحزمة
k this deck
25
Refer to the information provided in Table 24.1 below to answer the question(s) that follow.
Table 24.1
Refer to Table 24.1. At an output level of $800 billion, disposable income equals ________ billion.
A) $800
B) $700
C) $600
D) $500
Table 24.1
Refer to Table 24.1. At an output level of $800 billion, disposable income equals ________ billion.
A) $800
B) $700
C) $600
D) $500
فتح الحزمة
افتح القفل للوصول البطاقات البالغ عددها 360 في هذه المجموعة.
فتح الحزمة
k this deck
26
Refer to the information provided in Table 24.2 below to answer the question(s) that follow.
Table 24.2
Refer to Table 24.2. At an output level of $2,500, there is a tendency for output
A) to increase.
B) to remain constant.
C) to either increase or decrease.
D) to fall.
Table 24.2
Refer to Table 24.2. At an output level of $2,500, there is a tendency for output
A) to increase.
B) to remain constant.
C) to either increase or decrease.
D) to fall.
فتح الحزمة
افتح القفل للوصول البطاقات البالغ عددها 360 في هذه المجموعة.
فتح الحزمة
k this deck
27
Refer to the information provided in Table 24.2 below to answer the question(s) that follow.
Table 24.2
Refer to Equation 24.1. The equilibrium level of output for the Italian economy is
A) $2,850.
B) $3,145.
C) $3,700.
D) $3,800.
Table 24.2
Refer to Equation 24.1. The equilibrium level of output for the Italian economy is
A) $2,850.
B) $3,145.
C) $3,700.
D) $3,800.
فتح الحزمة
افتح القفل للوصول البطاقات البالغ عددها 360 في هذه المجموعة.
فتح الحزمة
k this deck
28
Refer to the information provided in Table 24.1 below to answer the question(s) that follow.
Table 24.1
Refer to Table 24.1. At the equilibrium level of income, leakages equal ________ billion.
A) $0
B) $100
C) $200
D) $300
Table 24.1
Refer to Table 24.1. At the equilibrium level of income, leakages equal ________ billion.
A) $0
B) $100
C) $200
D) $300
فتح الحزمة
افتح القفل للوصول البطاقات البالغ عددها 360 في هذه المجموعة.
فتح الحزمة
k this deck
29
Refer to the information provided in Table 24.2 below to answer the question(s) that follow.
Table 24.2
Refer to Equation 24.2. At equilibrium, the sum of investment and government purchases in Canada is
A) $1,800.
B) $1,750.
C) $1,500.
D) cannot be determined from the given information.
Table 24.2
Refer to Equation 24.2. At equilibrium, the sum of investment and government purchases in Canada is
A) $1,800.
B) $1,750.
C) $1,500.
D) cannot be determined from the given information.
فتح الحزمة
افتح القفل للوصول البطاقات البالغ عددها 360 في هذه المجموعة.
فتح الحزمة
k this deck
30
Refer to the information provided in Table 24.1 below to answer the question(s) that follow.
Table 24.1
Refer to Table 24.1. At an output level of $2,000 billion, the value of saving
A) cannot be determined from the given information.
B) is $300 billion.
C) is $200 billion.
D) is $100 billion.
Table 24.1
Refer to Table 24.1. At an output level of $2,000 billion, the value of saving
A) cannot be determined from the given information.
B) is $300 billion.
C) is $200 billion.
D) is $100 billion.
فتح الحزمة
افتح القفل للوصول البطاقات البالغ عددها 360 في هذه المجموعة.
فتح الحزمة
k this deck
31
Refer to the information provided in Table 24.2 below to answer the question(s) that follow.
Table 24.2
Refer to Table 24.2. At an output level of $1,500 billion, the level of aggregate expenditure is ________ billion.
A) $1,300
B) $1,400
C) $1,500
D) $1,600
Table 24.2
Refer to Table 24.2. At an output level of $1,500 billion, the level of aggregate expenditure is ________ billion.
A) $1,300
B) $1,400
C) $1,500
D) $1,600
فتح الحزمة
افتح القفل للوصول البطاقات البالغ عددها 360 في هذه المجموعة.
فتح الحزمة
k this deck
32
Refer to the information provided in Table 24.2 below to answer the question(s) that follow.
Table 24.2
Refer to Table 24.2. At an output level of $2,500, the level of aggregate expenditure is ________ billion.
A) $1,500
B) $2,000
C) $2,200
D) $2,300
Table 24.2
Refer to Table 24.2. At an output level of $2,500, the level of aggregate expenditure is ________ billion.
A) $1,500
B) $2,000
C) $2,200
D) $2,300
فتح الحزمة
افتح القفل للوصول البطاقات البالغ عددها 360 في هذه المجموعة.
فتح الحزمة
k this deck
33
Refer to the information provided in Table 24.2 below to answer the question(s) that follow.
Table 24.2
Refer to Equation 24.1. At the equilibrium level of output in Italy, saving equals
A) $400.
B) $450.
C) $500.
D) $550.
Table 24.2
Refer to Equation 24.1. At the equilibrium level of output in Italy, saving equals
A) $400.
B) $450.
C) $500.
D) $550.
فتح الحزمة
افتح القفل للوصول البطاقات البالغ عددها 360 في هذه المجموعة.
فتح الحزمة
k this deck
34
Refer to the information provided in Table 24.2 below to answer the question(s) that follow.
Table 24.2
Refer to Equation 24.1. At the equilibrium level of output in Italy, leakages equal
A) $600.
B) $650.
C) $700.
D) $750.
Table 24.2
Refer to Equation 24.1. At the equilibrium level of output in Italy, leakages equal
A) $600.
B) $650.
C) $700.
D) $750.
فتح الحزمة
افتح القفل للوصول البطاقات البالغ عددها 360 في هذه المجموعة.
فتح الحزمة
k this deck
35
Refer to the information provided in Table 24.2 below to answer the question(s) that follow.
Table 24.2
Refer to Table 24.2 At the equilibrium level of income, leakages equal ________ billion.
A) $0
B) $300
C) $500
D) $200
Table 24.2
Refer to Table 24.2 At the equilibrium level of income, leakages equal ________ billion.
A) $0
B) $300
C) $500
D) $200
فتح الحزمة
افتح القفل للوصول البطاقات البالغ عددها 360 في هذه المجموعة.
فتح الحزمة
k this deck
36
Refer to the information provided in Table 24.2 below to answer the question(s) that follow.
Table 24.2
Refer to Table 24.2. At an output level of $1,500, disposable income
A) is $1,000.
B) is $1,200.
C) is $1,400.
D) cannot be determined from this information.
Table 24.2
Refer to Table 24.2. At an output level of $1,500, disposable income
A) is $1,000.
B) is $1,200.
C) is $1,400.
D) cannot be determined from this information.
فتح الحزمة
افتح القفل للوصول البطاقات البالغ عددها 360 في هذه المجموعة.
فتح الحزمة
k this deck
37
Refer to the information provided in Table 24.2 below to answer the question(s) that follow.
Table 24.2
Refer to Equation 24.1. At the equilibrium level of output in Italy, consumption equals
A) $3,100.
B) $3,250.
C) $3,400.
D) $3,625.
Table 24.2
Refer to Equation 24.1. At the equilibrium level of output in Italy, consumption equals
A) $3,100.
B) $3,250.
C) $3,400.
D) $3,625.
فتح الحزمة
افتح القفل للوصول البطاقات البالغ عددها 360 في هذه المجموعة.
فتح الحزمة
k this deck
38
Refer to the information provided in Table 24.2 below to answer the question(s) that follow.
Table 24.2
Refer to Table 24.2. The equilibrium level of output is ________ billion.
A) $1000
B) $1,500
C) $2,000
D) $2,500
Table 24.2
Refer to Table 24.2. The equilibrium level of output is ________ billion.
A) $1000
B) $1,500
C) $2,000
D) $2,500
فتح الحزمة
افتح القفل للوصول البطاقات البالغ عددها 360 في هذه المجموعة.
فتح الحزمة
k this deck
39
Refer to the information provided in Table 24.1 below to answer the question(s) that follow.
Table 24.1
Refer to Table 24.1 At an output level of $1,200 billion, there is a tendency for output
A) to fall.
B) to increase.
C) to remain constant.
D) to either increase or decrease.
Table 24.1
Refer to Table 24.1 At an output level of $1,200 billion, there is a tendency for output
A) to fall.
B) to increase.
C) to remain constant.
D) to either increase or decrease.
فتح الحزمة
افتح القفل للوصول البطاقات البالغ عددها 360 في هذه المجموعة.
فتح الحزمة
k this deck
40
Refer to the information provided in Table 24.2 below to answer the question(s) that follow.
Table 24.2
Refer to Table 24.2. At an output level of $2,500, there is an unplanned inventory
A) increase of $300 billion.
B) decrease of $200 billion.
C) change of $0.
D) increase of $200 billion.
Table 24.2
Refer to Table 24.2. At an output level of $2,500, there is an unplanned inventory
A) increase of $300 billion.
B) decrease of $200 billion.
C) change of $0.
D) increase of $200 billion.
فتح الحزمة
افتح القفل للوصول البطاقات البالغ عددها 360 في هذه المجموعة.
فتح الحزمة
k this deck
41
Refer to the information provided in Figure 24.1 below to answer the question(s) that follow. Figure 24.1
Refer to Figure 24.1. Suppose that the consumption function is C = 400 + 0.5Yd and taxes are $200 billion, at equilibrium, what is the value of consumption?
A) $2,000
B) $1,350
C) $1,300
D) $1,150
Figure 24.1Refer to Figure 24.1. Suppose that the consumption function is C = 400 + 0.5Yd and taxes are $200 billion, at equilibrium, what is the value of consumption?
A) $2,000
B) $1,350
C) $1,300
D) $1,150
فتح الحزمة
افتح القفل للوصول البطاقات البالغ عددها 360 في هذه المجموعة.
فتح الحزمة
k this deck
42
Refer to the information provided in Table 24.2 below to answer the question(s) that follow.
Table 24.2
Refer to Equation 24.2. At equilibrium leakages in Canada equal
A) $1,700.
B) $1,750.
C) $1,800.
D) $2,100.
Table 24.2
Refer to Equation 24.2. At equilibrium leakages in Canada equal
A) $1,700.
B) $1,750.
C) $1,800.
D) $2,100.
فتح الحزمة
افتح القفل للوصول البطاقات البالغ عددها 360 في هذه المجموعة.
فتح الحزمة
k this deck
43
Refer to the information provided in Figure 24.1 below to answer the question(s) that follow. Figure 24.1
Refer to Figure 24.1. In this economy, 0.5 represents the
A) MPC.
B) MPS.
C) multiplier.
D) both A and B
Figure 24.1Refer to Figure 24.1. In this economy, 0.5 represents the
A) MPC.
B) MPS.
C) multiplier.
D) both A and B
فتح الحزمة
افتح القفل للوصول البطاقات البالغ عددها 360 في هذه المجموعة.
فتح الحزمة
k this deck
44
If planned injections exceed leakages, output will
A) decrease.
B) increase.
C) remain constant.
D) either increase or decrease.
A) decrease.
B) increase.
C) remain constant.
D) either increase or decrease.
فتح الحزمة
افتح القفل للوصول البطاقات البالغ عددها 360 في هذه المجموعة.
فتح الحزمة
k this deck
45
Refer to the information provided in Figure 24.1 below to answer the question(s) that follow. Figure 24.1
Refer to Figure 24.1. At equilibrium, injections
A) can be greater than $1,000 billion.
B) equal $1,500 billion.
C) equal leakages.
D) equal $2,000 billion.
Figure 24.1Refer to Figure 24.1. At equilibrium, injections
A) can be greater than $1,000 billion.
B) equal $1,500 billion.
C) equal leakages.
D) equal $2,000 billion.
فتح الحزمة
افتح القفل للوصول البطاقات البالغ عددها 360 في هذه المجموعة.
فتح الحزمة
k this deck
46
Refer to the information provided in Figure 24.1 below to answer the question(s) that follow. Figure 24.1
Refer to Figure 24.1. The equilibrium level of aggregate expenditure is $________ billion.
A) 4,000
B) 3,000
C) 2,000
D) 1,500
Figure 24.1Refer to Figure 24.1. The equilibrium level of aggregate expenditure is $________ billion.
A) 4,000
B) 3,000
C) 2,000
D) 1,500
فتح الحزمة
افتح القفل للوصول البطاقات البالغ عددها 360 في هذه المجموعة.
فتح الحزمة
k this deck
47
Refer to the information provided in Figure 24.1 below to answer the question(s) that follow. Figure 24.1
Refer to Figure 24.1. At equilibrium, the part of consumption that is dependent on income equals $________ billion.
A) $2,000
B) $1,500
C) $1,000
D) cannot be determined from the given information
Figure 24.1Refer to Figure 24.1. At equilibrium, the part of consumption that is dependent on income equals $________ billion.
A) $2,000
B) $1,500
C) $1,000
D) cannot be determined from the given information
فتح الحزمة
افتح القفل للوصول البطاقات البالغ عددها 360 في هذه المجموعة.
فتح الحزمة
k this deck
48
Assuming there is no foreign trade in the economy, the economy is in equilibrium when
A) S + T = C + I.
B) I + G = S + T.
C) IT = S + G.
D) G + T = S + I.
A) S + T = C + I.
B) I + G = S + T.
C) IT = S + G.
D) G + T = S + I.
فتح الحزمة
افتح القفل للوصول البطاقات البالغ عددها 360 في هذه المجموعة.
فتح الحزمة
k this deck
49
Assuming there is no foreign trade in the economy, equilibrium is achieved when government purchases equal
A) saving minus net taxes minus consumption.
B) saving plus net taxes minus investment.
C) net taxes plus investment minus saving.
D) net taxes minus investment minus saving.
A) saving minus net taxes minus consumption.
B) saving plus net taxes minus investment.
C) net taxes plus investment minus saving.
D) net taxes minus investment minus saving.
فتح الحزمة
افتح القفل للوصول البطاقات البالغ عددها 360 في هذه المجموعة.
فتح الحزمة
k this deck
50
Refer to the information provided in Figure 24.1 below to answer the question(s) that follow. Figure 24.1
Refer to Figure 24.1. Suppose that the consumption function is C = 400 + 0.5Yd and taxes are $200 billion, at equilibrium the value of injections are
A) $700 billion.
B) $650 billion.
C) $500 billion.
D) $350 billion.
Figure 24.1Refer to Figure 24.1. Suppose that the consumption function is C = 400 + 0.5Yd and taxes are $200 billion, at equilibrium the value of injections are
A) $700 billion.
B) $650 billion.
C) $500 billion.
D) $350 billion.
فتح الحزمة
افتح القفل للوصول البطاقات البالغ عددها 360 في هذه المجموعة.
فتح الحزمة
k this deck
51
Refer to the information provided in Figure 24.1 below to answer the question(s) that follow. Figure 24.1
Refer to Figure 24.1. Suppose that the consumption function is C = 200 + 0.5Yd and taxes are $200 billion, at equilibrium, what is the value of consumption?
A) $1,100
B) $1,250
C) $1,350
D) $1,800
Figure 24.1Refer to Figure 24.1. Suppose that the consumption function is C = 200 + 0.5Yd and taxes are $200 billion, at equilibrium, what is the value of consumption?
A) $1,100
B) $1,250
C) $1,350
D) $1,800
فتح الحزمة
افتح القفل للوصول البطاقات البالغ عددها 360 في هذه المجموعة.
فتح الحزمة
k this deck
52
Refer to the information provided in Figure 24.1 below to answer the question(s) that follow. Figure 24.1
Refer to Figure 24.1. Suppose that the consumption function is C = 300 + 0.5Yd and taxes are $300 billion, at equilibrium the value of autonomous consumption is
A) $400 billion.
B) $300 billion.
C) $200 billion.
D) $100 billion.
Figure 24.1Refer to Figure 24.1. Suppose that the consumption function is C = 300 + 0.5Yd and taxes are $300 billion, at equilibrium the value of autonomous consumption is
A) $400 billion.
B) $300 billion.
C) $200 billion.
D) $100 billion.
فتح الحزمة
افتح القفل للوصول البطاقات البالغ عددها 360 في هذه المجموعة.
فتح الحزمة
k this deck
53
Refer to the information provided in Figure 24.1 below to answer the question(s) that follow. Figure 24.1
Refer to Figure 24.1. The MPC in this economy is
A) 0.4.
B) 0.5.
C) 0.6.
D) cannot be determined from the given information.
Figure 24.1Refer to Figure 24.1. The MPC in this economy is
A) 0.4.
B) 0.5.
C) 0.6.
D) cannot be determined from the given information.
فتح الحزمة
افتح القفل للوصول البطاقات البالغ عددها 360 في هذه المجموعة.
فتح الحزمة
k this deck
54
Refer to the information provided in Figure 24.1 below to answer the question(s) that follow. Figure 24.1
Refer to Figure 24.1. At equilibrium, $1,000 billion represents
A) the part of consumption that is dependent on income.
B) the part of consumption that is not dependent on income.
C) equilibrium income.
D) Both A and B are correct.
Figure 24.1Refer to Figure 24.1. At equilibrium, $1,000 billion represents
A) the part of consumption that is dependent on income.
B) the part of consumption that is not dependent on income.
C) equilibrium income.
D) Both A and B are correct.
فتح الحزمة
افتح القفل للوصول البطاقات البالغ عددها 360 في هذه المجموعة.
فتح الحزمة
k this deck
55
Refer to the information provided in Table 24.2 below to answer the question(s) that follow.
Table 24.2
Refer to Equation 24.2. At equilibrium, government purchases in Canada is
A) $1,500.
B) $1,250.
C) $1,000.
D) cannot be determined from the given information.
Table 24.2
Refer to Equation 24.2. At equilibrium, government purchases in Canada is
A) $1,500.
B) $1,250.
C) $1,000.
D) cannot be determined from the given information.
فتح الحزمة
افتح القفل للوصول البطاقات البالغ عددها 360 في هذه المجموعة.
فتح الحزمة
k this deck
56
Refer to the information provided in Figure 24.1 below to answer the question(s) that follow. Figure 24.1
Refer to Figure 24.1. Injections = leakages
A) when income = zero.
B) when consumption = saving.
C) at equilibrium.
D) when output = investment.
Figure 24.1Refer to Figure 24.1. Injections = leakages
A) when income = zero.
B) when consumption = saving.
C) at equilibrium.
D) when output = investment.
فتح الحزمة
افتح القفل للوصول البطاقات البالغ عددها 360 في هذه المجموعة.
فتح الحزمة
k this deck
57
Refer to the information provided in Table 24.2 below to answer the question(s) that follow.
Table 24.2
Refer to Equation 24.2. At equilibrium, saving in Canada equals
A) $1,200.
B) $1,250.
C) $1,350.
D) $1,600.
Table 24.2
Refer to Equation 24.2. At equilibrium, saving in Canada equals
A) $1,200.
B) $1,250.
C) $1,350.
D) $1,600.
فتح الحزمة
افتح القفل للوصول البطاقات البالغ عددها 360 في هذه المجموعة.
فتح الحزمة
k this deck
58
Refer to the information provided in Figure 24.1 below to answer the question(s) that follow. Figure 24.1
Refer to Figure 24.1. Suppose that the consumption function is C = 200 + 0.4Yd and taxes are $200 billion, at equilibrium the value of injections are
A) $1,080 billion.
B) $840 billion.
C) $720 billion.
D) $650 billion.
Figure 24.1Refer to Figure 24.1. Suppose that the consumption function is C = 200 + 0.4Yd and taxes are $200 billion, at equilibrium the value of injections are
A) $1,080 billion.
B) $840 billion.
C) $720 billion.
D) $650 billion.
فتح الحزمة
افتح القفل للوصول البطاقات البالغ عددها 360 في هذه المجموعة.
فتح الحزمة
k this deck
59
Refer to the information provided in Figure 24.1 below to answer the question(s) that follow. Figure 24.1
Refer to Figure 24.1. Aggregate expenditures = aggregate output at $ ________ billion.
A) 1,500
B) 2,000
C) 3,000
D) 4,000
Figure 24.1Refer to Figure 24.1. Aggregate expenditures = aggregate output at $ ________ billion.
A) 1,500
B) 2,000
C) 3,000
D) 4,000
فتح الحزمة
افتح القفل للوصول البطاقات البالغ عددها 360 في هذه المجموعة.
فتح الحزمة
k this deck
60
Refer to the information provided in Figure 24.1 below to answer the question(s) that follow. Figure 24.1
Refer to Figure 24.1. Suppose that the consumption function is C = 400 + 0.5Yd and taxes are $200 billion, at equilibrium the value of autonomous consumption is
A) $400 billion.
B) $300 billion.
C) $200 billion.
D) $100 billion.
Figure 24.1Refer to Figure 24.1. Suppose that the consumption function is C = 400 + 0.5Yd and taxes are $200 billion, at equilibrium the value of autonomous consumption is
A) $400 billion.
B) $300 billion.
C) $200 billion.
D) $100 billion.
فتح الحزمة
افتح القفل للوصول البطاقات البالغ عددها 360 في هذه المجموعة.
فتح الحزمة
k this deck
61
[Y = C + I + G] when ________ in the income-expenditure model.
A) net exports are included
B) net imports are included
C) government is included
D) investment is excluded
A) net exports are included
B) net imports are included
C) government is included
D) investment is excluded
فتح الحزمة
افتح القفل للوصول البطاقات البالغ عددها 360 في هذه المجموعة.
فتح الحزمة
k this deck
62
Ryan's income is $1,700 and his net taxes are $700. His disposable income is
A) $2,400.
B) $1,700.
C) $1,000.
D) $700.
A) $2,400.
B) $1,700.
C) $1,000.
D) $700.
فتح الحزمة
افتح القفل للوصول البطاقات البالغ عددها 360 في هذه المجموعة.
فتح الحزمة
k this deck
63
In 2016, the city of Sylvester collected $800,000 in taxes and spent $200,000. In 2016, the city of Sylvester had a
A) budget surplus of $200,000.
B) budget surplus of $600,000.
C) budget deficit of $200,000.
D) budget surplus of $1,000,000.
A) budget surplus of $200,000.
B) budget surplus of $600,000.
C) budget deficit of $200,000.
D) budget surplus of $1,000,000.
فتح الحزمة
افتح القفل للوصول البطاقات البالغ عددها 360 في هذه المجموعة.
فتح الحزمة
k this deck
64
The formula for the aggregate consumption function is [C = a + b(Y - T)] ________ the income-expenditure model.
A) after government is subtracted from
B) after net exports are added to
C) when consumption is left out of
D) after government is added to
A) after government is subtracted from
B) after net exports are added to
C) when consumption is left out of
D) after government is added to
فتح الحزمة
افتح القفل للوصول البطاقات البالغ عددها 360 في هذه المجموعة.
فتح الحزمة
k this deck
65
The aggregate consumption function is C = 200 + 0.9Yd. If income is $1,500 and net taxes are $300, consumption equals
A) 1,280.
B) 1,820.
C) 2,000.
D) 2,180.
A) 1,280.
B) 1,820.
C) 2,000.
D) 2,180.
فتح الحزمة
افتح القفل للوصول البطاقات البالغ عددها 360 في هذه المجموعة.
فتح الحزمة
k this deck
66
Refer to the information provided in Table 24.3 below to answer the question(s) that follow.
Table 24.3
Refer to Table 24.3. At an output level of $1,200 billion, there is an unplanned inventory change of
A) positive $100 billion.
B) zero.
C) negative $200 billion.
D) positive $200 billion.
Table 24.3
Refer to Table 24.3. At an output level of $1,200 billion, there is an unplanned inventory change of
A) positive $100 billion.
B) zero.
C) negative $200 billion.
D) positive $200 billion.
فتح الحزمة
افتح القفل للوصول البطاقات البالغ عددها 360 في هذه المجموعة.
فتح الحزمة
k this deck
67
Refer to the information provided in Table 24.3 below to answer the question(s) that follow.
Table 24.3
Refer to Table 24.3. At an output level of $1,200 billion, the level of aggregate expenditure is
A) $1,100 billion.
B) $1,250 billion.
C) $1,400 billion.
D) $1,450 billion.
Table 24.3
Refer to Table 24.3. At an output level of $1,200 billion, the level of aggregate expenditure is
A) $1,100 billion.
B) $1,250 billion.
C) $1,400 billion.
D) $1,450 billion.
فتح الحزمة
افتح القفل للوصول البطاقات البالغ عددها 360 في هذه المجموعة.
فتح الحزمة
k this deck
68
The spending and taxing policies used by the government to influence the economy refer to
A) monetary policy.
B) ad hoc policy.
C) fiscal policy.
D) trade policy.
A) monetary policy.
B) ad hoc policy.
C) fiscal policy.
D) trade policy.
فتح الحزمة
افتح القفل للوصول البطاقات البالغ عددها 360 في هذه المجموعة.
فتح الحزمة
k this deck
69
The aggregate consumption function is C = 1,200 + 0.4Yd. If income is $3,000 and net taxes are $400, consumption equals
A) 1,760.
B) 2,240.
C) 2,560.
D) 2,760.
A) 1,760.
B) 2,240.
C) 2,560.
D) 2,760.
فتح الحزمة
افتح القفل للوصول البطاقات البالغ عددها 360 في هذه المجموعة.
فتح الحزمة
k this deck
70
The aggregate consumption function is C = 150 + 0.75Yd. If income is $500 and net taxes are zero, consumption equals
A) 275.
B) 350.
C) 525.
D) 650.
A) 275.
B) 350.
C) 525.
D) 650.
فتح الحزمة
افتح القفل للوصول البطاقات البالغ عددها 360 في هذه المجموعة.
فتح الحزمة
k this deck
71
The ________ and the ________ determine tax revenues.
A) money supply; income tax rate
B) income of households; value of transfer payments
C) income tax rate; income of households
D) value of transfer payments; money supply
A) money supply; income tax rate
B) income of households; value of transfer payments
C) income tax rate; income of households
D) value of transfer payments; money supply
فتح الحزمة
افتح القفل للوصول البطاقات البالغ عددها 360 في هذه المجموعة.
فتح الحزمة
k this deck
72
Which of the following is correct regarding tax revenues?
A) They increase during recessions.
B) They do not change with changes in the tax rate.
C) They are the only revenue source in the government's budget.
D) They decrease during economic slowdowns.
A) They increase during recessions.
B) They do not change with changes in the tax rate.
C) They are the only revenue source in the government's budget.
D) They decrease during economic slowdowns.
فتح الحزمة
افتح القفل للوصول البطاقات البالغ عددها 360 في هذه المجموعة.
فتح الحزمة
k this deck
73
Disposable income
A) decreases when net taxes decrease.
B) decreases when income decreases.
C) increases when saving decreases.
D) all of the above
A) decreases when net taxes decrease.
B) decreases when income decreases.
C) increases when saving decreases.
D) all of the above
فتح الحزمة
افتح القفل للوصول البطاقات البالغ عددها 360 في هذه المجموعة.
فتح الحزمة
k this deck
74
For the economy to be in equilibrium
A) government purchases must equal tax revenue and saving must equal investment.
B) government purchases must equal the sum of tax revenue, saving and investment.
C) government purchases plus investment must equal saving plus tax revenue.
D) investment plus tax revenue must equal government purchases plus saving.
فتح الحزمة
افتح القفل للوصول البطاقات البالغ عددها 360 في هذه المجموعة.
فتح الحزمة
k this deck
75
The aggregate consumption function is C = 100 + 0.5Yd. If income is $2,000 and net taxes are $400, consumption equals
A) 900.
B) 1,300.
C) 3,300.
D) 4,900.
A) 900.
B) 1,300.
C) 3,300.
D) 4,900.
فتح الحزمة
افتح القفل للوصول البطاقات البالغ عددها 360 في هذه المجموعة.
فتح الحزمة
k this deck
76
Which of the following is a category of fiscal policy?
A) government policies regarding the purchase of goods and services
B) government policies regarding taxation
C) government policies regarding transfer payments and welfare benefits
D) all of the above
A) government policies regarding the purchase of goods and services
B) government policies regarding taxation
C) government policies regarding transfer payments and welfare benefits
D) all of the above
فتح الحزمة
افتح القفل للوصول البطاقات البالغ عددها 360 في هذه المجموعة.
فتح الحزمة
k this deck
77
If output is greater than planned aggregate expenditure, there will be
A) an unplanned increase in inventories.
B) an unplanned decrease in inventories.
C) no change in inventories.
D) a planned increase in inventories.
A) an unplanned increase in inventories.
B) an unplanned decrease in inventories.
C) no change in inventories.
D) a planned increase in inventories.
فتح الحزمة
افتح القفل للوصول البطاقات البالغ عددها 360 في هذه المجموعة.
فتح الحزمة
k this deck
78
Planned aggregate expenditure increases when ________ in the income-expenditure model.
A) the government sector is included
B) the government sector is excluded
C) investment is excluded
D) consumption is excluded
A) the government sector is included
B) the government sector is excluded
C) investment is excluded
D) consumption is excluded
فتح الحزمة
افتح القفل للوصول البطاقات البالغ عددها 360 في هذه المجموعة.
فتح الحزمة
k this deck
79
In 2016, the city of Springfield collected $375,000 in taxes and spent $450,000. In 2016, the city of Springfield had a
A) budget surplus of $825,000.
B) budget surplus of $75,000.
C) budget deficit of $125,000.
D) budget deficit of $75,000.
A) budget surplus of $825,000.
B) budget surplus of $75,000.
C) budget deficit of $125,000.
D) budget deficit of $75,000.
فتح الحزمة
افتح القفل للوصول البطاقات البالغ عددها 360 في هذه المجموعة.
فتح الحزمة
k this deck
80
The government budget deficit or surplus is the difference between what a government ________ and what it ________ in a year.
A) pays for imports; spends on exports
B) spends; collects in taxes
C) earns from transfers; pays in transfers
D) spends on programs; gives away in foreign aid
A) pays for imports; spends on exports
B) spends; collects in taxes
C) earns from transfers; pays in transfers
D) spends on programs; gives away in foreign aid
فتح الحزمة
افتح القفل للوصول البطاقات البالغ عددها 360 في هذه المجموعة.
فتح الحزمة
k this deck
فتح الحزمة
افتح القفل للوصول البطاقات البالغ عددها 360 في هذه المجموعة.


