Deck 5: Forecasting
ملء الشاشة (f)
سؤال
سؤال
سؤال
سؤال
سؤال
سؤال
سؤال
سؤال
سؤال
سؤال
سؤال
سؤال
سؤال
سؤال
سؤال
سؤال
سؤال
سؤال
سؤال
سؤال
سؤال
سؤال
سؤال
سؤال
سؤال
سؤال
سؤال
سؤال
سؤال
سؤال
سؤال
سؤال
سؤال
سؤال
سؤال
سؤال
سؤال
سؤال
سؤال
سؤال
سؤال
سؤال
سؤال
سؤال
سؤال
سؤال
سؤال
سؤال
سؤال
سؤال
سؤال
سؤال
سؤال
سؤال
سؤال
سؤال
سؤال
سؤال
سؤال
سؤال
سؤال
Calculate (a) MAD, (b) MSE, and (c) MAPE for the following forecast versus actual sales figures. (Please round to four decimal places for MAPE.) 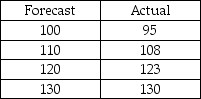
سؤال
سؤال
For the data below: 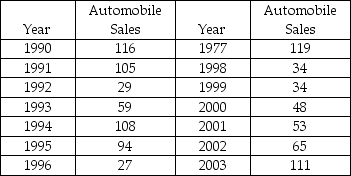 (a) Determine the least squares regression line.
(b) Determine the predicted value for 2004.
(c) Determine the MAD.
(d) Determine the unadjusted forecasting MSE.
(a) Determine the least squares regression line.(b) Determine the predicted value for 2004.
(c) Determine the MAD.
(d) Determine the unadjusted forecasting MSE.
سؤال
سؤال
Given the following data and seasonal index: 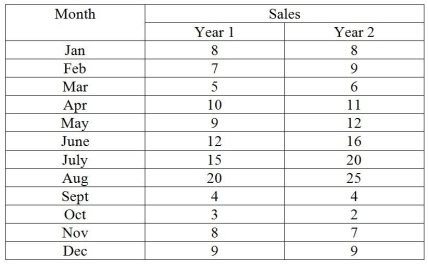 (a) Compute the seasonal index using only year 1 data.
(b) Determine the deseasonalized demand values using year 2 data and year 1's seasonal indices.
(c) Determine the trend line on year 2's deseasonalized data.
(d) Forecast the sales for the first 3 months of year 3, adjusting for seasonality.
(a) Compute the seasonal index using only year 1 data.(b) Determine the deseasonalized demand values using year 2 data and year 1's seasonal indices.
(c) Determine the trend line on year 2's deseasonalized data.
(d) Forecast the sales for the first 3 months of year 3, adjusting for seasonality.
سؤال
Use simple exponential smoothing with α = 0.33 to forecast the tire sales for February through May. Assume that the forecast for January was for 22 sets of tires. 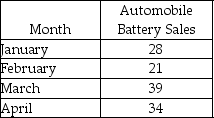
سؤال
The following table represents the number of applicants at popular private college in the last four years. 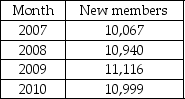 Assuming α = 0.2, β = 0.3, an initial forecast of 10,000 for 2007, and an initial trend adjustment of 0 for 2007, use exponential smoothing with trend adjustment to come up with a forecast for 2011 on the number of applicants.
Assuming α = 0.2, β = 0.3, an initial forecast of 10,000 for 2007, and an initial trend adjustment of 0 for 2007, use exponential smoothing with trend adjustment to come up with a forecast for 2011 on the number of applicants. سؤال
Given the following data, if MAD = 1.25, determine what the actual demand must have been in period 2 (A2). 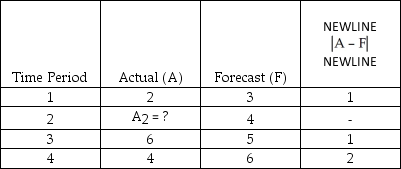
سؤال
The following table represents the new members that have been acquired by a fitness center. 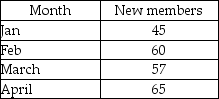 Assuming α = 0.3, β = 0.4, an initial forecast of 40 for January, and an initial trend adjustment of 0 for January, use exponential smoothing with trend adjustment to come up with a forecast for May on new members.
Assuming α = 0.3, β = 0.4, an initial forecast of 40 for January, and an initial trend adjustment of 0 for January, use exponential smoothing with trend adjustment to come up with a forecast for May on new members. سؤال
Use the sales data given below to determine: 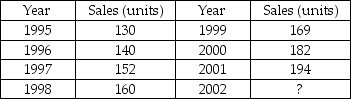 (a) the least squares trend line.
(b) the predicted value for 2002 sales.
(c) the MAD.
(d) the unadjusted forecasting MSE.
(a) the least squares trend line.(b) the predicted value for 2002 sales.
(c) the MAD.
(d) the unadjusted forecasting MSE.
سؤال
سؤال
سؤال
سؤال
The following table represents the actual vs. forecasted amount of new customers acquired by a major credit card company: 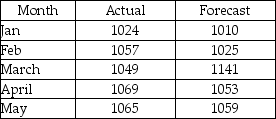 (a) What is the tracking signal?
(b) Based on the answer in part (a), comment on the accuracy of this forecast.
(a) What is the tracking signal?(b) Based on the answer in part (a), comment on the accuracy of this forecast.
سؤال
سؤال
Given the following gasoline data: 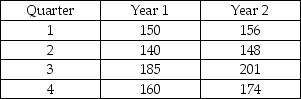 (a) Compute the seasonal index for each quarter.
(b) Suppose we expect year 3 to have annual demand of 800. What is the forecast value for each quarter in year 3?
(a) Compute the seasonal index for each quarter.(b) Suppose we expect year 3 to have annual demand of 800. What is the forecast value for each quarter in year 3?
سؤال
For the data below: 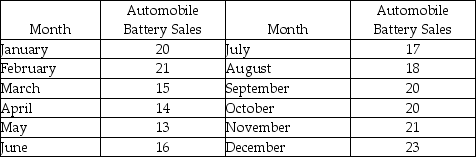 (a) Develop a scatter diagram.
(b) Develop a three-month moving average.
(c) Compute MAD.
(a) Develop a scatter diagram.(b) Develop a three-month moving average.
(c) Compute MAD.
سؤال
Use simple exponential smoothing with α = 0.3 to forecast battery sales for February through May. Assume that the forecast for January was for 22 batteries. 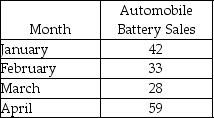
سؤال
For the data below: 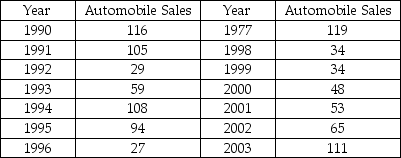 (a) Develop a scatter diagram.
(b) Develop a six-year moving average forecast.
(c) Find MAPE.
(a) Develop a scatter diagram.(b) Develop a six-year moving average forecast.
(c) Find MAPE.
سؤال
For the data below: 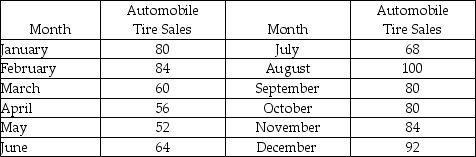 (a) Develop a scatter diagram.
(b) Compute a three-month moving average.
(c) Compute the MSE.
(a) Develop a scatter diagram.(b) Compute a three-month moving average.
(c) Compute the MSE.

فتح الحزمة
قم بالتسجيل لفتح البطاقات في هذه المجموعة!
Unlock Deck
Unlock Deck
1/101
العب
ملء الشاشة (f)
Deck 5: Forecasting
1
Time-series models attempt to predict the future by using historical data.
True
2
Regression is always a superior forecasting method to exponential smoothing, so regression should be used whenever the appropriate software is available.
False
3
The fewer the periods over which one takes a moving average, the more accurately the resulting forecast mirrors the actual data of the most recent time periods.
True
4
Four components of time series are trend, moving average, exponential smoothing, and seasonality.
فتح الحزمة
افتح القفل للوصول البطاقات البالغ عددها 101 في هذه المجموعة.
فتح الحزمة
k this deck
5
A trend-projection forecasting method is a causal forecasting method.
فتح الحزمة
افتح القفل للوصول البطاقات البالغ عددها 101 في هذه المجموعة.
فتح الحزمة
k this deck
6
An exponential forecasting method is a time-series forecasting method.
فتح الحزمة
افتح القفل للوصول البطاقات البالغ عددها 101 في هذه المجموعة.
فتح الحزمة
k this deck
7
Time-series models rely on judgment in an attempt to incorporate qualitative or subjective factors into the forecasting model.
فتح الحزمة
افتح القفل للوصول البطاقات البالغ عددها 101 في هذه المجموعة.
فتح الحزمة
k this deck
8
Qualitative models produce forecasts that are little better than simple guesses or coin tosses.
فتح الحزمة
افتح القفل للوصول البطاقات البالغ عددها 101 في هذه المجموعة.
فتح الحزمة
k this deck
9
A scatter diagram for a time series may be plotted on a two-dimensional graph with the horizontal axis representing the variable to be forecast (such as sales).
فتح الحزمة
افتح القفل للوصول البطاقات البالغ عددها 101 في هذه المجموعة.
فتح الحزمة
k this deck
10
Qualitative models attempt to incorporate judgmental or subjective factors into the forecasting model.
فتح الحزمة
افتح القفل للوصول البطاقات البالغ عددها 101 في هذه المجموعة.
فتح الحزمة
k this deck
11
A moving average forecasting method is a causal forecasting method.
فتح الحزمة
افتح القفل للوصول البطاقات البالغ عددها 101 في هذه المجموعة.
فتح الحزمة
k this deck
12
Time-series models enable the forecaster to include specific representations of various qualitative and quantitative factors.
فتح الحزمة
افتح القفل للوصول البطاقات البالغ عددها 101 في هذه المجموعة.
فتح الحزمة
k this deck
13
The Delphi method solicits input from customers or potential customers regarding their future purchasing plans.
فتح الحزمة
افتح القفل للوصول البطاقات البالغ عددها 101 في هذه المجموعة.
فتح الحزمة
k this deck
14
In a weighted moving average, the weights assigned must sum to 1.
فتح الحزمة
افتح القفل للوصول البطاقات البالغ عددها 101 في هذه المجموعة.
فتح الحزمة
k this deck
15
A medium-term forecast typically covers a two- to four-year time horizon.
فتح الحزمة
افتح القفل للوصول البطاقات البالغ عددها 101 في هذه المجموعة.
فتح الحزمة
k this deck
16
The naïve forecast for the next period is the actual value observed in the current period.
فتح الحزمة
افتح القفل للوصول البطاقات البالغ عددها 101 في هذه المجموعة.
فتح الحزمة
k this deck
17
A scatter diagram is useful to determine if a relationship exists between two variables.
فتح الحزمة
افتح القفل للوصول البطاقات البالغ عددها 101 في هذه المجموعة.
فتح الحزمة
k this deck
18
The most common quantitative causal model is regression analysis.
فتح الحزمة
افتح القفل للوصول البطاقات البالغ عددها 101 في هذه المجموعة.
فتح الحزمة
k this deck
19
The three categories of forecasting models are time series, quantitative, and qualitative.
فتح الحزمة
افتح القفل للوصول البطاقات البالغ عددها 101 في هذه المجموعة.
فتح الحزمة
k this deck
20
Mean absolute deviation (MAD) is simply the sum of forecast errors.
فتح الحزمة
افتح القفل للوصول البطاقات البالغ عددها 101 في هذه المجموعة.
فتح الحزمة
k this deck
21
A medium-term forecast is considered to cover what length of time?
A) 2-4 weeks
B) 1 month to 1 year
C) 2-4 years
D) 5-10 years
E) 20 years
A) 2-4 weeks
B) 1 month to 1 year
C) 2-4 years
D) 5-10 years
E) 20 years
فتح الحزمة
افتح القفل للوصول البطاقات البالغ عددها 101 في هذه المجموعة.
فتح الحزمة
k this deck
22
An advantage of exponential smoothing over a simple moving average is that exponential smoothing requires one to retain less data.
فتح الحزمة
افتح القفل للوصول البطاقات البالغ عددها 101 في هذه المجموعة.
فتح الحزمة
k this deck
23
Which of the following is considered a causal method of forecasting?
A) exponential smoothing
B) moving average
C) Holt's method
D) Delphi method
E) None of the above
A) exponential smoothing
B) moving average
C) Holt's method
D) Delphi method
E) None of the above
فتح الحزمة
افتح القفل للوصول البطاقات البالغ عددها 101 في هذه المجموعة.
فتح الحزمة
k this deck
24
Enrollment in a particular class for the last four semesters has been 120, 126, 110, and 130. Suppose a one-semester moving average was used to forecast enrollment (this is sometimes referred to as a naïve forecast). Thus, the forecast for the second semester would be 120, for the third semester it would be 126, and for the last semester it would be 110. What would the MSE be for this situation?
A) 196.00
B) 230.67
C) 100.00
D) 42.00
E) None of the above
A) 196.00
B) 230.67
C) 100.00
D) 42.00
E) None of the above
فتح الحزمة
افتح القفل للوصول البطاقات البالغ عددها 101 في هذه المجموعة.
فتح الحزمة
k this deck
25
Adaptive smoothing is analogous to exponential smoothing where the coefficients α and β are periodically updated to improve the forecast.
فتح الحزمة
افتح القفل للوصول البطاقات البالغ عددها 101 في هذه المجموعة.
فتح الحزمة
k this deck
26
A seasonal index of 1 means that the season is average.
فتح الحزمة
افتح القفل للوصول البطاقات البالغ عددها 101 في هذه المجموعة.
فتح الحزمة
k this deck
27
When the smoothing constant α = 1, the exponential smoothing model is equivalent to the naïve forecasting model.
فتح الحزمة
افتح القفل للوصول البطاقات البالغ عددها 101 في هذه المجموعة.
فتح الحزمة
k this deck
28
Scatter diagrams can be useful in spotting trends or cycles in data over time.
فتح الحزمة
افتح القفل للوصول البطاقات البالغ عددها 101 في هذه المجموعة.
فتح الحزمة
k this deck
29
Which of the following is a technique used to determine forecasting accuracy?
A) exponential smoothing
B) moving average
C) regression
D) Delphi method
E) mean absolute percent error
A) exponential smoothing
B) moving average
C) regression
D) Delphi method
E) mean absolute percent error
فتح الحزمة
افتح القفل للوصول البطاقات البالغ عددها 101 في هذه المجموعة.
فتح الحزمة
k this deck
30
A graphical plot with sales on the Y axis and time on the X axis is a
A) catter diagram.
B) trend projection.
C) radar chart.
D) line graph.
E) bar chart.
A) catter diagram.
B) trend projection.
C) radar chart.
D) line graph.
E) bar chart.
فتح الحزمة
افتح القفل للوصول البطاقات البالغ عددها 101 في هذه المجموعة.
فتح الحزمة
k this deck
31
In a second order exponential smoothing, a low β gives less weight to more recent trends.
فتح الحزمة
افتح القفل للوصول البطاقات البالغ عددها 101 في هذه المجموعة.
فتح الحزمة
k this deck
32
The process of isolating linear trend and seasonal factors to develop a more accurate forecast is called regression.
فتح الحزمة
افتح القفل للوصول البطاقات البالغ عددها 101 في هذه المجموعة.
فتح الحزمة
k this deck
33
Which of the following is not classified as a qualitative forecasting model?
A) exponential smoothing
B) Delphi method
C) jury of executive opinion
D) sales force composite
E) consumer market survey
A) exponential smoothing
B) Delphi method
C) jury of executive opinion
D) sales force composite
E) consumer market survey
فتح الحزمة
افتح القفل للوصول البطاقات البالغ عددها 101 في هذه المجموعة.
فتح الحزمة
k this deck
34
A judgmental forecasting technique that uses decision makers, staff personnel, and respondent to determine a forecast is called
A) exponential smoothing.
B) the Delphi method.
C) jury of executive opinion.
D) sales force composite.
E) consumer market survey.
A) exponential smoothing.
B) the Delphi method.
C) jury of executive opinion.
D) sales force composite.
E) consumer market survey.
فتح الحزمة
افتح القفل للوصول البطاقات البالغ عددها 101 في هذه المجموعة.
فتح الحزمة
k this deck
35
Which of the following statements about scatter diagrams is true?
A) Time is always plotted on the y-axis.
B) It can depict the relationship among three variables simultaneously.
C) It is helpful when forecasting with qualitative data.
D) The variable to be forecasted is placed on the y-axis.
E) It is not a good tool for understanding time-series data.
A) Time is always plotted on the y-axis.
B) It can depict the relationship among three variables simultaneously.
C) It is helpful when forecasting with qualitative data.
D) The variable to be forecasted is placed on the y-axis.
E) It is not a good tool for understanding time-series data.
فتح الحزمة
افتح القفل للوصول البطاقات البالغ عددها 101 في هذه المجموعة.
فتح الحزمة
k this deck
36
When the smoothing constant α = 0, the exponential smoothing model is equivalent to the naïve forecasting model.
فتح الحزمة
افتح القفل للوصول البطاقات البالغ عددها 101 في هذه المجموعة.
فتح الحزمة
k this deck
37
When is the exponential smoothing model equivalent to the naïve forecasting model?
A) α = 0
B) α = 0.5
C) α = 1
D) during the first period in which it is used
E) never
A) α = 0
B) α = 0.5
C) α = 1
D) during the first period in which it is used
E) never
فتح الحزمة
افتح القفل للوصول البطاقات البالغ عددها 101 في هذه المجموعة.
فتح الحزمة
k this deck
38
A seasonal index must be between -1 and +1.
فتح الحزمة
افتح القفل للوصول البطاقات البالغ عددها 101 في هذه المجموعة.
فتح الحزمة
k this deck
39
Exponential smoothing cannot be used for data with a trend.
فتح الحزمة
افتح القفل للوصول البطاقات البالغ عددها 101 في هذه المجموعة.
فتح الحزمة
k this deck
40
Bias is the average error of a forecast model.
فتح الحزمة
افتح القفل للوصول البطاقات البالغ عددها 101 في هذه المجموعة.
فتح الحزمة
k this deck
41
Which of the following methods tells whether the forecast tends to be too high or too low?
A) MAD
B) MSE
C) MAPE
D) decomposition
E) bias
A) MAD
B) MSE
C) MAPE
D) decomposition
E) bias
فتح الحزمة
افتح القفل للوصول البطاقات البالغ عددها 101 في هذه المجموعة.
فتح الحزمة
k this deck
42
The computer monitoring of tracking signals and self-adjustment is referred to as
A) exponential smoothing.
B) adaptive smoothing.
C) trend projections.
D) trend smoothing.
E) running sum of forecast errors (RFSE).
A) exponential smoothing.
B) adaptive smoothing.
C) trend projections.
D) trend smoothing.
E) running sum of forecast errors (RFSE).
فتح الحزمة
افتح القفل للوصول البطاقات البالغ عددها 101 في هذه المجموعة.
فتح الحزمة
k this deck
43
Enrollment in a particular class for the last four semesters has been 120, 126, 110, and 130 (listed from oldest to most recent). Develop a forecast of enrollment next semester using exponential smoothing with an alpha = 0.2. Assume that an initial forecast for the first semester was 120 (so the forecast and the actual were the same).
A) 118.96
B) 121.17
C) 130
D) 120
E) None of the above
A) 118.96
B) 121.17
C) 130
D) 120
E) None of the above
فتح الحزمة
افتح القفل للوصول البطاقات البالغ عددها 101 في هذه المجموعة.
فتح الحزمة
k this deck
44
Demand for soccer balls at a new sporting goods store is forecasted using the following regression equation: Y = 98 + 2.2X where X is the number of months that the store has been in existence. Let April be represented by X = 4. April is assumed to have a seasonality index of 1.15. What is the forecast for soccer ball demand for the month of April (rounded to the nearest integer)?
A) 123
B) 107
C) 100
D) 115
E) None of the above
A) 123
B) 107
C) 100
D) 115
E) None of the above
فتح الحزمة
افتح القفل للوصول البطاقات البالغ عددها 101 في هذه المجموعة.
فتح الحزمة
k this deck
45
As one increases the number of periods used in the calculation of a moving average,
A) greater emphasis is placed on more recent data.
B) less emphasis is placed on more recent data.
C) the emphasis placed on more recent data remains the same.
D) it requires a computer to automate the calculations.
E) one is usually looking for a long-term prediction.
A) greater emphasis is placed on more recent data.
B) less emphasis is placed on more recent data.
C) the emphasis placed on more recent data remains the same.
D) it requires a computer to automate the calculations.
E) one is usually looking for a long-term prediction.
فتح الحزمة
افتح القفل للوصول البطاقات البالغ عددها 101 في هذه المجموعة.
فتح الحزمة
k this deck
46
Which of the following is not a characteristic of trend projections?
A) The variable being predicted is the Y variable.
B) Time is the X variable.
C) It is useful for predicting the value of one variable based on time trend.
D) A negative intercept term always implies that the dependent variable is decreasing over time.
E) They are often developed using linear regression.
فتح الحزمة
افتح القفل للوصول البطاقات البالغ عددها 101 في هذه المجموعة.
فتح الحزمة
k this deck
47
Daily demand for newspapers for the last 10 days has been as follows: 12, 13, 16, 15, 12, 18, 14, 12, 13, 15 (listed from oldest to most recent). Forecast sales for the next day using a three-day weighted moving average where the weights are 3, 1, and 1 (the highest weight is for the most recent number).
A) 12.8
B) 13.0
C) 70.0
D) 14.0
E) None of the above
A) 12.8
B) 13.0
C) 70.0
D) 14.0
E) None of the above
فتح الحزمة
افتح القفل للوصول البطاقات البالغ عددها 101 في هذه المجموعة.
فتح الحزمة
k this deck
48
Which of the following methods produces a particularly stiff penalty in periods with large forecast errors?
A) MAD
B) MSE
C) MAPE
D) decomposition
E) bias
A) MAD
B) MSE
C) MAPE
D) decomposition
E) bias
فتح الحزمة
افتح القفل للوصول البطاقات البالغ عددها 101 في هذه المجموعة.
فتح الحزمة
k this deck
49
Daily demand for newspapers for the last 10 days has been as follows: 12, 13, 16, 15, 12, 18, 14, 12, 13, 15 (listed from oldest to most recent). Forecast sales for the next day using a two-day weighted moving average where the weights are 3 and 1 are
A) 14.5.
B) 13.5.
C) 14.
D) 12.25.
E) 12.75.
A) 14.5.
B) 13.5.
C) 14.
D) 12.25.
E) 12.75.
فتح الحزمة
افتح القفل للوصول البطاقات البالغ عددها 101 في هذه المجموعة.
فتح الحزمة
k this deck
50
Sales for boxes of Girl Scout cookies over a 4-month period were forecasted as follows: 100, 120, 115, and 123. The actual results over the 4-month period were as follows: 110, 114, 119, 115. What was the MSE of the 4-month forecast?
A) 0
B) 5
C) 7
D) 108
E) None of the above
A) 0
B) 5
C) 7
D) 108
E) None of the above
فتح الحزمة
افتح القفل للوصول البطاقات البالغ عددها 101 في هذه المجموعة.
فتح الحزمة
k this deck
51
Assume that you have tried three different forecasting models. For the first, the MAD = 2.5, for the second, the MSE = 10.5, and for the third, the MAPE = 2.7. We can then say:
A) the third method is the best.
B) the second method is the best.
C) methods one and three are preferable to method two.
D) method two is least preferred.
E) None of the above
A) the third method is the best.
B) the second method is the best.
C) methods one and three are preferable to method two.
D) method two is least preferred.
E) None of the above
فتح الحزمة
افتح القفل للوصول البطاقات البالغ عددها 101 في هذه المجموعة.
فتح الحزمة
k this deck
52
Daily demand for newspapers for the last 10 days has been as follows: 12, 13, 16, 15, 12, 18, 14, 12, 13, 15 (listed from oldest to most recent). Forecast sales for the next day using a two-day moving average.
A) 14
B) 13
C) 15
D) 28
E) 12.5
A) 14
B) 13
C) 15
D) 28
E) 12.5
فتح الحزمة
افتح القفل للوصول البطاقات البالغ عددها 101 في هذه المجموعة.
فتح الحزمة
k this deck
53
A time-series forecasting model in which the forecast for the next period is the actual value for the current period is the
A) Delphi model.
B) Holt's model.
C) naïve model.
D) exponential smoothing model.
E) weighted moving average.
A) Delphi model.
B) Holt's model.
C) naïve model.
D) exponential smoothing model.
E) weighted moving average.
فتح الحزمة
افتح القفل للوصول البطاقات البالغ عددها 101 في هذه المجموعة.
فتح الحزمة
k this deck
54
Which of the following is not considered to be one of the components of a time series?
A) trend
B) seasonality
C) variance
D) cycles
E) random variations
A) trend
B) seasonality
C) variance
D) cycles
E) random variations
فتح الحزمة
افتح القفل للوصول البطاقات البالغ عددها 101 في هذه المجموعة.
فتح الحزمة
k this deck
55
Sales for boxes of Girl Scout cookies over a 4-month period were forecasted as follows: 100, 120, 115, and 123. The actual results over the 4-month period were as follows: 110, 114, 119, 115. What was the MAD of the 4-month forecast?
A) 0
B) 5
C) 7
D) 108
E) None of the above
A) 0
B) 5
C) 7
D) 108
E) None of the above
فتح الحزمة
افتح القفل للوصول البطاقات البالغ عددها 101 في هذه المجموعة.
فتح الحزمة
k this deck
56
Which of the following methods gives an indication of the percentage of forecast error?
A) MAD
B) MSE
C) MAPE
D) decomposition
E) bias
A) MAD
B) MSE
C) MAPE
D) decomposition
E) bias
فتح الحزمة
افتح القفل للوصول البطاقات البالغ عددها 101 في هذه المجموعة.
فتح الحزمة
k this deck
57
When both trend and seasonal components are present in time series, which of the following is most appropriate?
A) the use of centered moving averages
B) the use of moving averages
C) the use of simple exponential smoothing
D) the use of weighted moving averages
E) the use of double smoothing
A) the use of centered moving averages
B) the use of moving averages
C) the use of simple exponential smoothing
D) the use of weighted moving averages
E) the use of double smoothing
فتح الحزمة
افتح القفل للوصول البطاقات البالغ عددها 101 في هذه المجموعة.
فتح الحزمة
k this deck
58
Enrollment in a particular class for the last four semesters has been 122, 128, 100, and 155 (listed from oldest to most recent). The best forecast of enrollment next semester, based on a three-semester moving average, would be
A) 116.7.
B) 126.3.
C) 168.3.
D) 135.0.
E) 127.7.
A) 116.7.
B) 126.3.
C) 168.3.
D) 135.0.
E) 127.7.
فتح الحزمة
افتح القفل للوصول البطاقات البالغ عددها 101 في هذه المجموعة.
فتح الحزمة
k this deck
59
In picking the smoothing constant for an exponential smoothing model, we should look for a value that
A) produces a nice-looking curve.
B) equals the utility level that matches with our degree of risk aversion.
C) produces values which compare well with actual values based on a standard measure of error.
D) causes the least computational effort.
E) None of the above
A) produces a nice-looking curve.
B) equals the utility level that matches with our degree of risk aversion.
C) produces values which compare well with actual values based on a standard measure of error.
D) causes the least computational effort.
E) None of the above
فتح الحزمة
افتح القفل للوصول البطاقات البالغ عددها 101 في هذه المجموعة.
فتح الحزمة
k this deck
60
In the exponential smoothing with trend adjustment forecasting method, is the
A) slope of the trend line.
B) new forecast.
C) Y-axis intercept.
D) independent variable.
E) trend smoothing constant.
A) slope of the trend line.
B) new forecast.
C) Y-axis intercept.
D) independent variable.
E) trend smoothing constant.
فتح الحزمة
افتح القفل للوصول البطاقات البالغ عددها 101 في هذه المجموعة.
فتح الحزمة
k this deck
61
Calculate (a) MAD, (b) MSE, and (c) MAPE for the following forecast versus actual sales figures. (Please round to four decimal places for MAPE.)
فتح الحزمة
افتح القفل للوصول البطاقات البالغ عددها 101 في هذه المجموعة.
فتح الحزمة
k this deck
62
A tracking signal was calculated for a particular set of demand forecasts. This tracking signal was positive. This would indicate that
A) demand is greater than the forecast.
B) demand is less than the forecast.
C) demand is equal to the forecast.
D) the MAD is negative.
E) None of the above
A) demand is greater than the forecast.
B) demand is less than the forecast.
C) demand is equal to the forecast.
D) the MAD is negative.
E) None of the above
فتح الحزمة
افتح القفل للوصول البطاقات البالغ عددها 101 في هذه المجموعة.
فتح الحزمة
k this deck
63
For the data below: (a) Determine the least squares regression line.
(b) Determine the predicted value for 2004.
(c) Determine the MAD.
(d) Determine the unadjusted forecasting MSE.
(a) Determine the least squares regression line.(b) Determine the predicted value for 2004.
(c) Determine the MAD.
(d) Determine the unadjusted forecasting MSE.
فتح الحزمة
افتح القفل للوصول البطاقات البالغ عددها 101 في هذه المجموعة.
فتح الحزمة
k this deck
64
A seasonal index of ________ indicates that the season is average.
A) 10
B) 100
C) 0.5
D) 0
E) 1
A) 10
B) 100
C) 0.5
D) 0
E) 1
فتح الحزمة
افتح القفل للوصول البطاقات البالغ عددها 101 في هذه المجموعة.
فتح الحزمة
k this deck
65
Given the following data and seasonal index: (a) Compute the seasonal index using only year 1 data.
(b) Determine the deseasonalized demand values using year 2 data and year 1's seasonal indices.
(c) Determine the trend line on year 2's deseasonalized data.
(d) Forecast the sales for the first 3 months of year 3, adjusting for seasonality.
(a) Compute the seasonal index using only year 1 data.(b) Determine the deseasonalized demand values using year 2 data and year 1's seasonal indices.
(c) Determine the trend line on year 2's deseasonalized data.
(d) Forecast the sales for the first 3 months of year 3, adjusting for seasonality.
فتح الحزمة
افتح القفل للوصول البطاقات البالغ عددها 101 في هذه المجموعة.
فتح الحزمة
k this deck
66
Use simple exponential smoothing with α = 0.33 to forecast the tire sales for February through May. Assume that the forecast for January was for 22 sets of tires.
فتح الحزمة
افتح القفل للوصول البطاقات البالغ عددها 101 في هذه المجموعة.
فتح الحزمة
k this deck
67
The following table represents the number of applicants at popular private college in the last four years. Assuming α = 0.2, β = 0.3, an initial forecast of 10,000 for 2007, and an initial trend adjustment of 0 for 2007, use exponential smoothing with trend adjustment to come up with a forecast for 2011 on the number of applicants.
Assuming α = 0.2, β = 0.3, an initial forecast of 10,000 for 2007, and an initial trend adjustment of 0 for 2007, use exponential smoothing with trend adjustment to come up with a forecast for 2011 on the number of applicants. فتح الحزمة
افتح القفل للوصول البطاقات البالغ عددها 101 في هذه المجموعة.
فتح الحزمة
k this deck
68
Given the following data, if MAD = 1.25, determine what the actual demand must have been in period 2 (A2).
فتح الحزمة
افتح القفل للوصول البطاقات البالغ عددها 101 في هذه المجموعة.
فتح الحزمة
k this deck
69
The following table represents the new members that have been acquired by a fitness center. Assuming α = 0.3, β = 0.4, an initial forecast of 40 for January, and an initial trend adjustment of 0 for January, use exponential smoothing with trend adjustment to come up with a forecast for May on new members.
Assuming α = 0.3, β = 0.4, an initial forecast of 40 for January, and an initial trend adjustment of 0 for January, use exponential smoothing with trend adjustment to come up with a forecast for May on new members. فتح الحزمة
افتح القفل للوصول البطاقات البالغ عددها 101 في هذه المجموعة.
فتح الحزمة
k this deck
70
Use the sales data given below to determine: (a) the least squares trend line.
(b) the predicted value for 2002 sales.
(c) the MAD.
(d) the unadjusted forecasting MSE.
(a) the least squares trend line.(b) the predicted value for 2002 sales.
(c) the MAD.
(d) the unadjusted forecasting MSE.
فتح الحزمة
افتح القفل للوصول البطاقات البالغ عددها 101 في هذه المجموعة.
فتح الحزمة
k this deck
71
The errors in a particular forecast are as follows: 4, -3, 2, 5, -1. What is the tracking signal of the forecast?
A) 0.4286
B) 2.3333
C) 5
D) 1.4
E) 2.5
A) 0.4286
B) 2.3333
C) 5
D) 1.4
E) 2.5
فتح الحزمة
افتح القفل للوصول البطاقات البالغ عددها 101 في هذه المجموعة.
فتح الحزمة
k this deck
72
Demand for a particular type of battery fluctuates from one week to the next. A study of the last six weeks provides the following demands (in dozens): 4, 5, 3, 2, 8, 10 (last week).
(a) Forecast demand for the next week using a two-week moving average.
(b) Forecast demand for the next week using a three-week moving average.
(a) Forecast demand for the next week using a two-week moving average.
(b) Forecast demand for the next week using a three-week moving average.
فتح الحزمة
افتح القفل للوصول البطاقات البالغ عددها 101 في هذه المجموعة.
فتح الحزمة
k this deck
73
Average starting salaries for students using a placement service at a university have been steadily increasing. A study of the last four graduating classes indicates the following average salaries: $30,000, $32,000, $34,500, and $36,000 (last graduating class). Predict the starting salary for the next graduating class using a simple exponential smoothing model with α = 0.25. Assume that the initial forecast was $30,000 (so that the forecast and the actual were the same).
فتح الحزمة
افتح القفل للوصول البطاقات البالغ عددها 101 في هذه المجموعة.
فتح الحزمة
k this deck
74
The following table represents the actual vs. forecasted amount of new customers acquired by a major credit card company: (a) What is the tracking signal?
(b) Based on the answer in part (a), comment on the accuracy of this forecast.
(a) What is the tracking signal?(b) Based on the answer in part (a), comment on the accuracy of this forecast.
فتح الحزمة
افتح القفل للوصول البطاقات البالغ عددها 101 في هذه المجموعة.
فتح الحزمة
k this deck
75
Daily high temperatures in the city of Houston for the last week have been: 93, 94, 93, 95, 92, 86, 98 (yesterday).
(a) Forecast the high temperature today using a three-day moving average.
(b) Forecast the high temperature today using a two-day moving average.
(c) Calculate the mean absolute deviation based on a two-day moving average, covering all days in which you can have a forecast and an actual temperature.
فتح الحزمة
افتح القفل للوصول البطاقات البالغ عددها 101 في هذه المجموعة.
فتح الحزمة
k this deck
76
Given the following gasoline data: (a) Compute the seasonal index for each quarter.
(b) Suppose we expect year 3 to have annual demand of 800. What is the forecast value for each quarter in year 3?
(a) Compute the seasonal index for each quarter.(b) Suppose we expect year 3 to have annual demand of 800. What is the forecast value for each quarter in year 3?
فتح الحزمة
افتح القفل للوصول البطاقات البالغ عددها 101 في هذه المجموعة.
فتح الحزمة
k this deck
77
For the data below: (a) Develop a scatter diagram.
(b) Develop a three-month moving average.
(c) Compute MAD.
(a) Develop a scatter diagram.(b) Develop a three-month moving average.
(c) Compute MAD.
فتح الحزمة
افتح القفل للوصول البطاقات البالغ عددها 101 في هذه المجموعة.
فتح الحزمة
k this deck
78
Use simple exponential smoothing with α = 0.3 to forecast battery sales for February through May. Assume that the forecast for January was for 22 batteries.
فتح الحزمة
افتح القفل للوصول البطاقات البالغ عددها 101 في هذه المجموعة.
فتح الحزمة
k this deck
79
For the data below: (a) Develop a scatter diagram.
(b) Develop a six-year moving average forecast.
(c) Find MAPE.
(a) Develop a scatter diagram.(b) Develop a six-year moving average forecast.
(c) Find MAPE.
فتح الحزمة
افتح القفل للوصول البطاقات البالغ عددها 101 في هذه المجموعة.
فتح الحزمة
k this deck
80
For the data below: (a) Develop a scatter diagram.
(b) Compute a three-month moving average.
(c) Compute the MSE.
(a) Develop a scatter diagram.(b) Compute a three-month moving average.
(c) Compute the MSE.
فتح الحزمة
افتح القفل للوصول البطاقات البالغ عددها 101 في هذه المجموعة.
فتح الحزمة
k this deck
فتح الحزمة
افتح القفل للوصول البطاقات البالغ عددها 101 في هذه المجموعة.


