Deck 3: Numerical Descriptive Measures
ملء الشاشة (f)
سؤال
سؤال
سؤال
سؤال
سؤال
سؤال
سؤال
سؤال
سؤال
سؤال
سؤال
سؤال
سؤال
سؤال
سؤال
سؤال
سؤال
سؤال
سؤال
سؤال
سؤال
سؤال
TABLE 2-6
A sample of 200 students at a Big-Ten university was taken after the midterm to ask them whether they went bar hopping the weekend before the midterm or spent the weekend studying,and whether they did well or poorly on the midterm.The following table contains the result.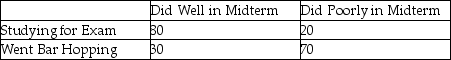
Referring to Table 2-6,________ percent of the students in the sample spent the weekend studying and did well on the midterm.
A)40
B)50
C)72.72
D)80
سؤال
TABLE 2-7
The Stem-and-Leaf display below contains data on the number of months between the date a civil suit is filed and when the case is actually adjudicated for 50 cases heard in superior court.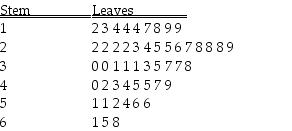
Referring to Table 2-7,locate the first leaf,i.e.,the lowest valued leaf with the lowest valued stem.This represents a wait of ________ months.
سؤال
سؤال
Data on the change in the cost of tuition,a shared dormitory room,and the most popular meal plan from one academic year to the next academic year for a sample of 100 public universities were collected.Below is the boxplot for the change in cost in dollars.The distribution of the change in cost is 
A)right-skewed.
B)left-skewed.
C)symmetrical.
D)None of the above.
A)right-skewed.
B)left-skewed.
C)symmetrical.
D)None of the above.
سؤال
TABLE 2-6
A sample of 200 students at a Big-Ten university was taken after the midterm to ask them whether they went bar hopping the weekend before the midterm or spent the weekend studying,and whether they did well or poorly on the midterm.The following table contains the result.
Referring to Table 2-6,of those who did well on the midterm in the sample,________ percent of them went bar hopping the weekend before the midterm.
A)15
B)27.27
C)30
D)50
سؤال
سؤال
A manufacturer of flashlight batteries took a sample of 130 batteries from a day's production and used them continuously until they were drained.The number of hours until failure were recorded.Given below is the boxplot of the number of hours it took to drain each of the 130 batteries.The distribution of the number of hours is 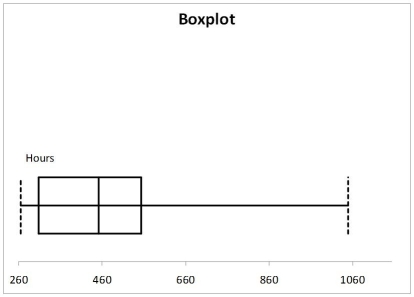
A)right-skewed.
B)left-skewed.
C)symmetrical.
D)None of the above.
A)right-skewed.
B)left-skewed.
C)symmetrical.
D)None of the above.
سؤال
Retailers are always interested in determining why a customer selected their store to make a purchase.A sporting goods retailer conducted a customer survey to determine why its customers shopped at the store.The results are shown in the bar chart below.What proportion of the customers responded that they shopped at the store because of the merchandise or the convenience? 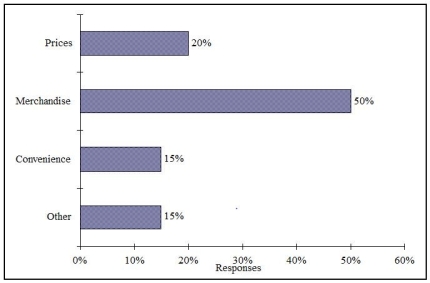
A)35%
B)50%
C)65%
D)85%
A)35%
B)50%
C)65%
D)85%
سؤال
سؤال
TABLE 2-6
A sample of 200 students at a Big-Ten university was taken after the midterm to ask them whether they went bar hopping the weekend before the midterm or spent the weekend studying,and whether they did well or poorly on the midterm.The following table contains the result.
Referring to Table 2-6,if the sample is a good representation of the population,we can expect ________ percent of those who did poorly on the midterm to have spent the weekend studying.
A)10
B)22
C)45
D)50
سؤال
TABLE 2-6
A sample of 200 students at a Big-Ten university was taken after the midterm to ask them whether they went bar hopping the weekend before the midterm or spent the weekend studying,and whether they did well or poorly on the midterm.The following table contains the result.
Referring to Table 2-6,if the sample is a good representation of the population,we can expect ________ percent of the students in the population to spend the weekend studying and do poorly on the midterm.
A)10
B)20
C)45
D)50
سؤال
سؤال
TABLE 2-6
A sample of 200 students at a Big-Ten university was taken after the midterm to ask them whether they went bar hopping the weekend before the midterm or spent the weekend studying,and whether they did well or poorly on the midterm.The following table contains the result.
Referring to Table 2-6,________ percent of the students in the sample went bar hopping the weekend before the midterm and did well on the midterm.
A)15
B)27.27
C)30
D)50
سؤال
TABLE 2-6
A sample of 200 students at a Big-Ten university was taken after the midterm to ask them whether they went bar hopping the weekend before the midterm or spent the weekend studying,and whether they did well or poorly on the midterm.The following table contains the result.
Referring to Table 2-6,of those who went bar hopping the weekend before the midterm in the sample,________ percent of them did well on the midterm.
A)15
B)27.27
C)30
D)55
سؤال
TABLE 2-7
The Stem-and-Leaf display below contains data on the number of months between the date a civil suit is filed and when the case is actually adjudicated for 50 cases heard in superior court.
Referring to Table 2-7,the civil suit with the longest wait between when the suit was filed and when it was adjudicated had a wait of ________ months.
سؤال
سؤال
سؤال
سؤال
TABLE 2-6
A sample of 200 students at a Big-Ten university was taken after the midterm to ask them whether they went bar hopping the weekend before the midterm or spent the weekend studying,and whether they did well or poorly on the midterm.The following table contains the result.
Referring to Table 2-6,if the sample is a good representation of the population,we can expect ________ percent of those who spent the weekend studying to do poorly on the midterm.
A)10
B)20
C)45
D)50
سؤال
TABLE 2-9
The frequency distribution below represents the rents of 250 randomly selected federally subsidized apartments in a small town.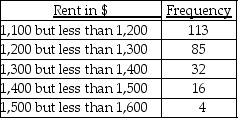
Referring to Table 2-9,________ of the apartments rented for at least $1,300.
The frequency distribution below represents the rents of 250 randomly selected federally subsidized apartments in a small town.
Referring to Table 2-9,________ of the apartments rented for at least $1,300.
سؤال
TABLE 2-8
The Stem-and-Leaf display represents the number of times in a year that a random sample of 100 "lifetime" members of a health club actually visited the facility.
Referring to Table 2-8,if a frequency distribution with equal sized classes was made from this data,and the first class was "0 but less than 10," the cumulative percentage of the next-to-last class would be ________.
سؤال
TABLE 2-7
The Stem-and-Leaf display below contains data on the number of months between the date a civil suit is filed and when the case is actually adjudicated for 50 cases heard in superior court.
Referring to Table 2-7,if a frequency distribution with equal sized classes was made from this data,and the first class was "10 but less than 20," the relative frequency of the third class would be ________.
سؤال
TABLE 2-8
The Stem-and-Leaf display represents the number of times in a year that a random sample of 100 "lifetime" members of a health club actually visited the facility.
Referring to Table 2-8,________ of the 100 members visited the health club no more than 12 times in a year.
The Stem-and-Leaf display represents the number of times in a year that a random sample of 100 "lifetime" members of a health club actually visited the facility.
Referring to Table 2-8,________ of the 100 members visited the health club no more than 12 times in a year.
سؤال
TABLE 2-7
The Stem-and-Leaf display below contains data on the number of months between the date a civil suit is filed and when the case is actually adjudicated for 50 cases heard in superior court.
Referring to Table 2-7,________ percent of the cases were not adjudicated within the first 4 years.
The Stem-and-Leaf display below contains data on the number of months between the date a civil suit is filed and when the case is actually adjudicated for 50 cases heard in superior court.
Referring to Table 2-7,________ percent of the cases were not adjudicated within the first 4 years.
سؤال
TABLE 2-8
The Stem-and-Leaf display represents the number of times in a year that a random sample of 100 "lifetime" members of a health club actually visited the facility.
Referring to Table 2-8,the person who has the largest leaf associated with the smallest stem visited the facility ________ times.
The Stem-and-Leaf display represents the number of times in a year that a random sample of 100 "lifetime" members of a health club actually visited the facility.
Referring to Table 2-8,the person who has the largest leaf associated with the smallest stem visited the facility ________ times.
سؤال
TABLE 2-7
The Stem-and-Leaf display below contains data on the number of months between the date a civil suit is filed and when the case is actually adjudicated for 50 cases heard in superior court.
Referring to Table 2-7,if a frequency distribution with equal sized classes was made from this data,and the first class was "10 but less than 20," the frequency of that class would be ________.
سؤال
TABLE 2-9
The frequency distribution below represents the rents of 250 randomly selected federally subsidized apartments in a small town.
Referring to Table 2-9,________ apartments rented for at least $1,200 but less than $1,400.
The frequency distribution below represents the rents of 250 randomly selected federally subsidized apartments in a small town.
Referring to Table 2-9,________ apartments rented for at least $1,200 but less than $1,400.
سؤال
TABLE 2-7
The Stem-and-Leaf display below contains data on the number of months between the date a civil suit is filed and when the case is actually adjudicated for 50 cases heard in superior court.
Referring to Table 2-7,________ percent of the cases were adjudicated within the first 2 years.
The Stem-and-Leaf display below contains data on the number of months between the date a civil suit is filed and when the case is actually adjudicated for 50 cases heard in superior court.
Referring to Table 2-7,________ percent of the cases were adjudicated within the first 2 years.
سؤال
TABLE 2-7
The Stem-and-Leaf display below contains data on the number of months between the date a civil suit is filed and when the case is actually adjudicated for 50 cases heard in superior court.
Referring to Table 2-7,if a frequency distribution with equal sized classes was made from this data,and the first class was "10 but less than 20," the cumulative percentage of the second class would be ________.
سؤال
TABLE 2-9
The frequency distribution below represents the rents of 250 randomly selected federally subsidized apartments in a small town.
Referring to Table 2-9,________ of the apartments rented for $1,400 or more.
The frequency distribution below represents the rents of 250 randomly selected federally subsidized apartments in a small town.
Referring to Table 2-9,________ of the apartments rented for $1,400 or more.
سؤال
TABLE 2-8
The Stem-and-Leaf display represents the number of times in a year that a random sample of 100 "lifetime" members of a health club actually visited the facility.
Referring to Table 2-8,the person who visited the health club more than anyone else in the sample visited the facility ________ times.
The Stem-and-Leaf display represents the number of times in a year that a random sample of 100 "lifetime" members of a health club actually visited the facility.
Referring to Table 2-8,the person who visited the health club more than anyone else in the sample visited the facility ________ times.
سؤال
TABLE 2-9
The frequency distribution below represents the rents of 250 randomly selected federally subsidized apartments in a small town.
Referring to Table 2-9,the class midpoint of the second class is ________.
The frequency distribution below represents the rents of 250 randomly selected federally subsidized apartments in a small town.
Referring to Table 2-9,the class midpoint of the second class is ________.
سؤال
TABLE 2-8
The Stem-and-Leaf display represents the number of times in a year that a random sample of 100 "lifetime" members of a health club actually visited the facility.
Referring to Table 2-8,if a frequency distribution with equal sized classes was made from this data,and the first class was "0 but less than 10," the frequency of the fifth class would be ________.
سؤال
TABLE 2-8
The Stem-and-Leaf display represents the number of times in a year that a random sample of 100 "lifetime" members of a health club actually visited the facility.
Referring to Table 2-8,if a frequency distribution with equal sized classes was made from this data,and the first class was "0 but less than 10," the class midpoint of the third class would be ________.
سؤال
TABLE 2-8
The Stem-and-Leaf display represents the number of times in a year that a random sample of 100 "lifetime" members of a health club actually visited the facility.
Referring to Table 2-8,________ of the 100 members visited the health club at least 52 times in a year.
The Stem-and-Leaf display represents the number of times in a year that a random sample of 100 "lifetime" members of a health club actually visited the facility.
Referring to Table 2-8,________ of the 100 members visited the health club at least 52 times in a year.
سؤال
TABLE 2-9
The frequency distribution below represents the rents of 250 randomly selected federally subsidized apartments in a small town.
Referring to Table 2-9,the relative frequency of the second class is ________.
The frequency distribution below represents the rents of 250 randomly selected federally subsidized apartments in a small town.
Referring to Table 2-9,the relative frequency of the second class is ________.
سؤال
TABLE 2-8
The Stem-and-Leaf display represents the number of times in a year that a random sample of 100 "lifetime" members of a health club actually visited the facility.
Referring to Table 2-8,if a frequency distribution with equal sized classes was made from this data,and the first class was "0 but less than 10," the relative frequency of the last class would be ________.
سؤال
TABLE 2-8
The Stem-and-Leaf display represents the number of times in a year that a random sample of 100 "lifetime" members of a health club actually visited the facility.
Referring to Table 2-8,the person who visited the health club less than anyone else in the sample visited the facility ________ times.
The Stem-and-Leaf display represents the number of times in a year that a random sample of 100 "lifetime" members of a health club actually visited the facility.
Referring to Table 2-8,the person who visited the health club less than anyone else in the sample visited the facility ________ times.
سؤال
TABLE 2-7
The Stem-and-Leaf display below contains data on the number of months between the date a civil suit is filed and when the case is actually adjudicated for 50 cases heard in superior court.
Referring to Table 2-7,the civil suit with the fourth shortest waiting time between when the suit was filed and when it was adjudicated had a wait of ________ months.
سؤال
TABLE 2-10
The histogram below represents scores achieved by 200 job applicants on a personality profile.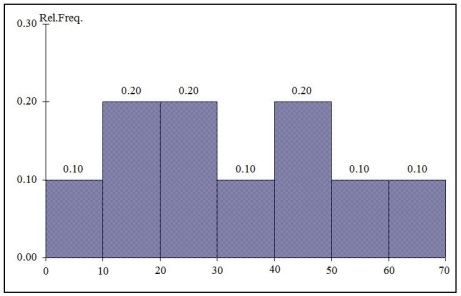
Referring to the histogram from Table 2-10,________ percent of the job applicants scored between 10 and 20.
The histogram below represents scores achieved by 200 job applicants on a personality profile.
Referring to the histogram from Table 2-10,________ percent of the job applicants scored between 10 and 20.
سؤال
سؤال
TABLE 2-10
The histogram below represents scores achieved by 200 job applicants on a personality profile.
Referring to the histogram from Table 2-10,________ percent of the applicants scored below 20 or at least 50.
The histogram below represents scores achieved by 200 job applicants on a personality profile.
Referring to the histogram from Table 2-10,________ percent of the applicants scored below 20 or at least 50.
سؤال
TABLE 2-10
The histogram below represents scores achieved by 200 job applicants on a personality profile.
Referring to the histogram from Table 2-10,________ percent of the job applicants scored below 50.
The histogram below represents scores achieved by 200 job applicants on a personality profile.
Referring to the histogram from Table 2-10,________ percent of the job applicants scored below 50.
سؤال
سؤال
TABLE 2-10
The histogram below represents scores achieved by 200 job applicants on a personality profile.
Referring to the histogram from Table 2-10,90% of the job applicants scored above or equal to ________.
The histogram below represents scores achieved by 200 job applicants on a personality profile.
Referring to the histogram from Table 2-10,90% of the job applicants scored above or equal to ________.
سؤال
سؤال
سؤال
سؤال
سؤال
سؤال
TABLE 2-10
The histogram below represents scores achieved by 200 job applicants on a personality profile.
Referring to the histogram from Table 2-10,________ percent of the applicants scored between 20 and below 50.
The histogram below represents scores achieved by 200 job applicants on a personality profile.
Referring to the histogram from Table 2-10,________ percent of the applicants scored between 20 and below 50.
سؤال
TABLE 2-9
The frequency distribution below represents the rents of 250 randomly selected federally subsidized apartments in a small town.
Referring to Table 2-9,the percentage of apartments renting for less than $1,400 is ________.
The frequency distribution below represents the rents of 250 randomly selected federally subsidized apartments in a small town.
Referring to Table 2-9,the percentage of apartments renting for less than $1,400 is ________.
سؤال
TABLE 2-10
The histogram below represents scores achieved by 200 job applicants on a personality profile.
Referring to the histogram from Table 2-10,half of the job applicants scored below ________.
The histogram below represents scores achieved by 200 job applicants on a personality profile.
Referring to the histogram from Table 2-10,half of the job applicants scored below ________.
سؤال
سؤال
سؤال
سؤال
TABLE 2-10
The histogram below represents scores achieved by 200 job applicants on a personality profile.
Referring to the histogram from Table 2-10,the number of job applicants who scored 50 or above is ________.
The histogram below represents scores achieved by 200 job applicants on a personality profile.
Referring to the histogram from Table 2-10,the number of job applicants who scored 50 or above is ________.
سؤال
TABLE 2-10
The histogram below represents scores achieved by 200 job applicants on a personality profile.
Referring to the histogram from Table 2-10,the number of job applicants who scored between 30 and below 60 is ________.
The histogram below represents scores achieved by 200 job applicants on a personality profile.
Referring to the histogram from Table 2-10,the number of job applicants who scored between 30 and below 60 is ________.
سؤال

فتح الحزمة
قم بالتسجيل لفتح البطاقات في هذه المجموعة!
Unlock Deck
Unlock Deck
1/184
العب
ملء الشاشة (f)
Deck 3: Numerical Descriptive Measures
1
Which descriptive summary measures are considered to be resistant statistics?
A)the arithmetic mean and standard deviation
B)the interquartile range and range
C)the mode and variance
D)the median and interquartile range
A)the arithmetic mean and standard deviation
B)the interquartile range and range
C)the mode and variance
D)the median and interquartile range
D
2
Which of the following statistics is not a measure of central tendency?
A)arithmetic mean.
B)median
C)mode
D)Q3
A)arithmetic mean.
B)median
C)mode
D)Q3
D
3
According to the empirical rule,if the data form a "bell-shaped" normal distribution,________ percent of the observations will be contained within 3 standard deviations around the arithmetic mean.
A)68.26
B)75.00
C)95.0
D)99.7
A)68.26
B)75.00
C)95.0
D)99.7
D
4
In perfectly symmetrical distributions,which of the following is NOT a correct statement?
A)The distance from Q1 to Q2 equals the distance from Q2 to Q3.
B)The distance from the smallest observation to Q1 is the same as the distance from Q3 to the largest observation.
C)The distance from the smallest observation to Q2 is the same as the distance from Q2 to the largest observation.
D)The distance from Q1 to Q3 is half of the distance from the smallest to the largest observation.
فتح الحزمة
افتح القفل للوصول البطاقات البالغ عددها 184 في هذه المجموعة.
فتح الحزمة
k this deck
5
Which of the following is not a measure of central tendency?
A)the arithmetic mean
B)the geometric mean
C)the mode
D)the interquartile range
A)the arithmetic mean
B)the geometric mean
C)the mode
D)the interquartile range
فتح الحزمة
افتح القفل للوصول البطاقات البالغ عددها 184 في هذه المجموعة.
فتح الحزمة
k this deck
6
Which of the following is not sensitive to extreme values?
A)the range
B)the standard deviation
C)the interquartile range
D)the coefficient of variation
A)the range
B)the standard deviation
C)the interquartile range
D)the coefficient of variation
فتح الحزمة
افتح القفل للوصول البطاقات البالغ عددها 184 في هذه المجموعة.
فتح الحزمة
k this deck
7
In a perfectly symmetrical bell-shaped "normal" distribution,
A)the arithmetic mean equals the median.
B)the median equals the mode.
C)the arithmetic mean equals the mode.
D)All of the above.
A)the arithmetic mean equals the median.
B)the median equals the mode.
C)the arithmetic mean equals the mode.
D)All of the above.
فتح الحزمة
افتح القفل للوصول البطاقات البالغ عددها 184 في هذه المجموعة.
فتح الحزمة
k this deck
8
In left-skewed distributions,which of the following is the correct statement?
A)The distance from Q1 to Q2 is smaller than the distance from Q2 to Q3.
B)The distance from the smallest observation to Q1 is larger than the distance from Q3 to the largest observation.
C)The distance from the smallest observation to Q2 is less than the distance from Q2 to the largest observation.
D)The distance from Q1 to Q3 is twice the distance from Q1 to Q2.
فتح الحزمة
افتح القفل للوصول البطاقات البالغ عددها 184 في هذه المجموعة.
فتح الحزمة
k this deck
9
The smaller the spread of scores around the arithmetic mean,
A)the smaller the interquartile range.
B)the smaller the standard deviation.
C)the smaller the coefficient of variation.
D)All of the above.
A)the smaller the interquartile range.
B)the smaller the standard deviation.
C)the smaller the coefficient of variation.
D)All of the above.
فتح الحزمة
افتح القفل للوصول البطاقات البالغ عددها 184 في هذه المجموعة.
فتح الحزمة
k this deck
10
According to the empirical rule,if the data form a "bell-shaped" normal distribution,________ percent of the observations will be contained within 2 standard deviations around the arithmetic mean.
A)68.26
B)88.89
C)93.75
D)95.44
A)68.26
B)88.89
C)93.75
D)95.44
فتح الحزمة
افتح القفل للوصول البطاقات البالغ عددها 184 في هذه المجموعة.
فتح الحزمة
k this deck
11
Which measure of central tendency can be used for both numerical and categorical variables?
A)arithmetic mean
B)median
C)mode
D)geometric mean
A)arithmetic mean
B)median
C)mode
D)geometric mean
فتح الحزمة
افتح القفل للوصول البطاقات البالغ عددها 184 في هذه المجموعة.
فتح الحزمة
k this deck
12
Which of the arithmetic mean,median,mode,and geometric mean are resistant measures of central tendency?
A)the arithmetic mean and median only
B)the median and mode only
C)the mode and geometric mean only
D)the arithmetic mean and mode only
A)the arithmetic mean and median only
B)the median and mode only
C)the mode and geometric mean only
D)the arithmetic mean and mode only
فتح الحزمة
افتح القفل للوصول البطاقات البالغ عددها 184 في هذه المجموعة.
فتح الحزمة
k this deck
13
In right-skewed distributions,which of the following is the correct statement?
A)The distance from Q1 to Q2 is greater than the distance from Q2 to Q3.
B)The distance from Q1 to Q2 is less than the distance from Q2 to Q3.
C)The arithmetic mean is less than the median.
D)The mode is greater than the arithmetic mean.
A)The distance from Q1 to Q2 is greater than the distance from Q2 to Q3.
B)The distance from Q1 to Q2 is less than the distance from Q2 to Q3.
C)The arithmetic mean is less than the median.
D)The mode is greater than the arithmetic mean.
فتح الحزمة
افتح القفل للوصول البطاقات البالغ عددها 184 في هذه المجموعة.
فتح الحزمة
k this deck
14
In a perfectly symmetrical distribution,
A)the range equals the interquartile range.
B)the interquartile range equals the arithmetic mean.
C)the median equals the arithmetic mean.
D)the variance equals the standard deviation.
A)the range equals the interquartile range.
B)the interquartile range equals the arithmetic mean.
C)the median equals the arithmetic mean.
D)the variance equals the standard deviation.
فتح الحزمة
افتح القفل للوصول البطاقات البالغ عددها 184 في هذه المجموعة.
فتح الحزمة
k this deck
15
Which of the following is sensitive to extreme values?
A)the median
B)the interquartile range
C)the arithmetic mean
D)the 1st quartile
A)the median
B)the interquartile range
C)the arithmetic mean
D)the 1st quartile
فتح الحزمة
افتح القفل للوصول البطاقات البالغ عددها 184 في هذه المجموعة.
فتح الحزمة
k this deck
16
Which of the following statements about the median is not true?
A)It is more affected by extreme values than the arithmetic mean.
B)It is a measure of central tendency.
C)It is equal to Q2.
D)It is equal to the mode in bell-shaped "normal" distributions.
A)It is more affected by extreme values than the arithmetic mean.
B)It is a measure of central tendency.
C)It is equal to Q2.
D)It is equal to the mode in bell-shaped "normal" distributions.
فتح الحزمة
افتح القفل للوصول البطاقات البالغ عددها 184 في هذه المجموعة.
فتح الحزمة
k this deck
17
When extreme values are present in a set of data,which of the following descriptive summary measures are most appropriate?
A)CV and range
B)arithmetic mean and standard deviation
C)interquartile range and median
D)variance and interquartile range
A)CV and range
B)arithmetic mean and standard deviation
C)interquartile range and median
D)variance and interquartile range
فتح الحزمة
افتح القفل للوصول البطاقات البالغ عددها 184 في هذه المجموعة.
فتح الحزمة
k this deck
18
In general,which of the following descriptive summary measures cannot be easily approximated from a boxplot?
A)the variance
B)the range
C)the interquartile range
D)the median
A)the variance
B)the range
C)the interquartile range
D)the median
فتح الحزمة
افتح القفل للوصول البطاقات البالغ عددها 184 في هذه المجموعة.
فتح الحزمة
k this deck
19
According to the empirical rule,if the data form a "bell-shaped" normal distribution,________ percent of the observations will be contained within 1 standard deviation around the arithmetic mean.
A)68.26
B)75.00
C)88.89
D)93.75
A)68.26
B)75.00
C)88.89
D)93.75
فتح الحزمة
افتح القفل للوصول البطاقات البالغ عددها 184 في هذه المجموعة.
فتح الحزمة
k this deck
20
In a right-skewed distribution,
A)the median equals the arithmetic mean.
B)the median is less than the arithmetic mean.
C)the median is greater than the arithmetic mean.
D)None of the above.
A)the median equals the arithmetic mean.
B)the median is less than the arithmetic mean.
C)the median is greater than the arithmetic mean.
D)None of the above.
فتح الحزمة
افتح القفل للوصول البطاقات البالغ عددها 184 في هذه المجموعة.
فتح الحزمة
k this deck
21
According to the Chebyshev rule,at least 93.75% of all observations in any data set are contained within a distance of how many standard deviations around the mean?
A)1
B)2
C)3
D)4
A)1
B)2
C)3
D)4
فتح الحزمة
افتح القفل للوصول البطاقات البالغ عددها 184 في هذه المجموعة.
فتح الحزمة
k this deck
22
TABLE 2-6
A sample of 200 students at a Big-Ten university was taken after the midterm to ask them whether they went bar hopping the weekend before the midterm or spent the weekend studying,and whether they did well or poorly on the midterm.The following table contains the result.
Referring to Table 2-6,________ percent of the students in the sample spent the weekend studying and did well on the midterm.
A)40
B)50
C)72.72
D)80
فتح الحزمة
افتح القفل للوصول البطاقات البالغ عددها 184 في هذه المجموعة.
فتح الحزمة
k this deck
23
TABLE 2-7
The Stem-and-Leaf display below contains data on the number of months between the date a civil suit is filed and when the case is actually adjudicated for 50 cases heard in superior court.
Referring to Table 2-7,locate the first leaf,i.e.,the lowest valued leaf with the lowest valued stem.This represents a wait of ________ months.
فتح الحزمة
افتح القفل للوصول البطاقات البالغ عددها 184 في هذه المجموعة.
فتح الحزمة
k this deck
24
You have collected data on the responses to two questions asked in a survey of 40 college students majoring in business-"What is your gender (Male = M; Female =
A)a contingency table
B)a stem-and-leaf display
C)a time-series plot
D)a Pareto chart
F)?" and "What is your major (Accountancy = A; Computer Information Systems = C; Marketing = M)?" Which of the following is the best for presenting the data?
A)a contingency table
B)a stem-and-leaf display
C)a time-series plot
D)a Pareto chart
F)?" and "What is your major (Accountancy = A; Computer Information Systems = C; Marketing = M)?" Which of the following is the best for presenting the data?
فتح الحزمة
افتح القفل للوصول البطاقات البالغ عددها 184 في هذه المجموعة.
فتح الحزمة
k this deck
25
Data on the change in the cost of tuition,a shared dormitory room,and the most popular meal plan from one academic year to the next academic year for a sample of 100 public universities were collected.Below is the boxplot for the change in cost in dollars.The distribution of the change in cost is
A)right-skewed.
B)left-skewed.
C)symmetrical.
D)None of the above.
A)right-skewed.
B)left-skewed.
C)symmetrical.
D)None of the above.
فتح الحزمة
افتح القفل للوصول البطاقات البالغ عددها 184 في هذه المجموعة.
فتح الحزمة
k this deck
26
TABLE 2-6
A sample of 200 students at a Big-Ten university was taken after the midterm to ask them whether they went bar hopping the weekend before the midterm or spent the weekend studying,and whether they did well or poorly on the midterm.The following table contains the result.
Referring to Table 2-6,of those who did well on the midterm in the sample,________ percent of them went bar hopping the weekend before the midterm.
A)15
B)27.27
C)30
D)50
فتح الحزمة
افتح القفل للوصول البطاقات البالغ عددها 184 في هذه المجموعة.
فتح الحزمة
k this deck
27
According to the Chebyshev rule,at least what percentage of the observations in any data set are contained within a distance of 2 standard deviations around the mean?
A)67%
B)75%
C)88.89%
D)95%
A)67%
B)75%
C)88.89%
D)95%
فتح الحزمة
افتح القفل للوصول البطاقات البالغ عددها 184 في هذه المجموعة.
فتح الحزمة
k this deck
28
A manufacturer of flashlight batteries took a sample of 130 batteries from a day's production and used them continuously until they were drained.The number of hours until failure were recorded.Given below is the boxplot of the number of hours it took to drain each of the 130 batteries.The distribution of the number of hours is
A)right-skewed.
B)left-skewed.
C)symmetrical.
D)None of the above.
A)right-skewed.
B)left-skewed.
C)symmetrical.
D)None of the above.
فتح الحزمة
افتح القفل للوصول البطاقات البالغ عددها 184 في هذه المجموعة.
فتح الحزمة
k this deck
29
Retailers are always interested in determining why a customer selected their store to make a purchase.A sporting goods retailer conducted a customer survey to determine why its customers shopped at the store.The results are shown in the bar chart below.What proportion of the customers responded that they shopped at the store because of the merchandise or the convenience?
A)35%
B)50%
C)65%
D)85%
A)35%
B)50%
C)65%
D)85%
فتح الحزمة
افتح القفل للوصول البطاقات البالغ عددها 184 في هذه المجموعة.
فتح الحزمة
k this deck
30
In a contingency table,the number of rows and columns
A)must always be the same.
B)must always be 2.
C)must add to 100%.
D)None of the above.
A)must always be the same.
B)must always be 2.
C)must add to 100%.
D)None of the above.
فتح الحزمة
افتح القفل للوصول البطاقات البالغ عددها 184 في هذه المجموعة.
فتح الحزمة
k this deck
31
TABLE 2-6
A sample of 200 students at a Big-Ten university was taken after the midterm to ask them whether they went bar hopping the weekend before the midterm or spent the weekend studying,and whether they did well or poorly on the midterm.The following table contains the result.
Referring to Table 2-6,if the sample is a good representation of the population,we can expect ________ percent of those who did poorly on the midterm to have spent the weekend studying.
A)10
B)22
C)45
D)50
فتح الحزمة
افتح القفل للوصول البطاقات البالغ عددها 184 في هذه المجموعة.
فتح الحزمة
k this deck
32
TABLE 2-6
A sample of 200 students at a Big-Ten university was taken after the midterm to ask them whether they went bar hopping the weekend before the midterm or spent the weekend studying,and whether they did well or poorly on the midterm.The following table contains the result.
Referring to Table 2-6,if the sample is a good representation of the population,we can expect ________ percent of the students in the population to spend the weekend studying and do poorly on the midterm.
A)10
B)20
C)45
D)50
فتح الحزمة
افتح القفل للوصول البطاقات البالغ عددها 184 في هذه المجموعة.
فتح الحزمة
k this deck
33
Which of the following is the easiest to compute?
A)the arithmetic mean
B)the median
C)the mode
D)the geometric mean
A)the arithmetic mean
B)the median
C)the mode
D)the geometric mean
فتح الحزمة
افتح القفل للوصول البطاقات البالغ عددها 184 في هذه المجموعة.
فتح الحزمة
k this deck
34
TABLE 2-6
A sample of 200 students at a Big-Ten university was taken after the midterm to ask them whether they went bar hopping the weekend before the midterm or spent the weekend studying,and whether they did well or poorly on the midterm.The following table contains the result.
Referring to Table 2-6,________ percent of the students in the sample went bar hopping the weekend before the midterm and did well on the midterm.
A)15
B)27.27
C)30
D)50
فتح الحزمة
افتح القفل للوصول البطاقات البالغ عددها 184 في هذه المجموعة.
فتح الحزمة
k this deck
35
TABLE 2-6
A sample of 200 students at a Big-Ten university was taken after the midterm to ask them whether they went bar hopping the weekend before the midterm or spent the weekend studying,and whether they did well or poorly on the midterm.The following table contains the result.
Referring to Table 2-6,of those who went bar hopping the weekend before the midterm in the sample,________ percent of them did well on the midterm.
A)15
B)27.27
C)30
D)55
فتح الحزمة
افتح القفل للوصول البطاقات البالغ عددها 184 في هذه المجموعة.
فتح الحزمة
k this deck
36
TABLE 2-7
The Stem-and-Leaf display below contains data on the number of months between the date a civil suit is filed and when the case is actually adjudicated for 50 cases heard in superior court.
Referring to Table 2-7,the civil suit with the longest wait between when the suit was filed and when it was adjudicated had a wait of ________ months.
فتح الحزمة
افتح القفل للوصول البطاقات البالغ عددها 184 في هذه المجموعة.
فتح الحزمة
k this deck
37
According to the Chebyshev rule,at least 75% of all observations in any data set are contained within a distance of how many standard deviations around the mean?
A)1
B)2
C)3
D)4
A)1
B)2
C)3
D)4
فتح الحزمة
افتح القفل للوصول البطاقات البالغ عددها 184 في هذه المجموعة.
فتح الحزمة
k this deck
38
You have collected data on the number of complaints for 6 different brands of automobiles sold in the United States over a 10-year period.Which of the following is the best for presenting the data?
A)a contingency table
B)a stem-and-leaf display
C)a time-series plot
D)a side-by-side bar chart
A)a contingency table
B)a stem-and-leaf display
C)a time-series plot
D)a side-by-side bar chart
فتح الحزمة
افتح القفل للوصول البطاقات البالغ عددها 184 في هذه المجموعة.
فتح الحزمة
k this deck
39
According to the Chebyshev rule,at least what percentage of the observations in any data set are contained within a distance of 3 standard deviations around the mean?
A)67%
B)75%
C)88.89%
D)99.7%
A)67%
B)75%
C)88.89%
D)99.7%
فتح الحزمة
افتح القفل للوصول البطاقات البالغ عددها 184 في هذه المجموعة.
فتح الحزمة
k this deck
40
TABLE 2-6
A sample of 200 students at a Big-Ten university was taken after the midterm to ask them whether they went bar hopping the weekend before the midterm or spent the weekend studying,and whether they did well or poorly on the midterm.The following table contains the result.
Referring to Table 2-6,if the sample is a good representation of the population,we can expect ________ percent of those who spent the weekend studying to do poorly on the midterm.
A)10
B)20
C)45
D)50
فتح الحزمة
افتح القفل للوصول البطاقات البالغ عددها 184 في هذه المجموعة.
فتح الحزمة
k this deck
41
TABLE 2-9
The frequency distribution below represents the rents of 250 randomly selected federally subsidized apartments in a small town.
Referring to Table 2-9,________ of the apartments rented for at least $1,300.
The frequency distribution below represents the rents of 250 randomly selected federally subsidized apartments in a small town.
Referring to Table 2-9,________ of the apartments rented for at least $1,300.
فتح الحزمة
افتح القفل للوصول البطاقات البالغ عددها 184 في هذه المجموعة.
فتح الحزمة
k this deck
42
TABLE 2-8
The Stem-and-Leaf display represents the number of times in a year that a random sample of 100 "lifetime" members of a health club actually visited the facility.
Referring to Table 2-8,if a frequency distribution with equal sized classes was made from this data,and the first class was "0 but less than 10," the cumulative percentage of the next-to-last class would be ________.
فتح الحزمة
افتح القفل للوصول البطاقات البالغ عددها 184 في هذه المجموعة.
فتح الحزمة
k this deck
43
TABLE 2-7
The Stem-and-Leaf display below contains data on the number of months between the date a civil suit is filed and when the case is actually adjudicated for 50 cases heard in superior court.
Referring to Table 2-7,if a frequency distribution with equal sized classes was made from this data,and the first class was "10 but less than 20," the relative frequency of the third class would be ________.
فتح الحزمة
افتح القفل للوصول البطاقات البالغ عددها 184 في هذه المجموعة.
فتح الحزمة
k this deck
44
TABLE 2-8
The Stem-and-Leaf display represents the number of times in a year that a random sample of 100 "lifetime" members of a health club actually visited the facility.
Referring to Table 2-8,________ of the 100 members visited the health club no more than 12 times in a year.
The Stem-and-Leaf display represents the number of times in a year that a random sample of 100 "lifetime" members of a health club actually visited the facility.
Referring to Table 2-8,________ of the 100 members visited the health club no more than 12 times in a year.
فتح الحزمة
افتح القفل للوصول البطاقات البالغ عددها 184 في هذه المجموعة.
فتح الحزمة
k this deck
45
TABLE 2-7
The Stem-and-Leaf display below contains data on the number of months between the date a civil suit is filed and when the case is actually adjudicated for 50 cases heard in superior court.
Referring to Table 2-7,________ percent of the cases were not adjudicated within the first 4 years.
The Stem-and-Leaf display below contains data on the number of months between the date a civil suit is filed and when the case is actually adjudicated for 50 cases heard in superior court.
Referring to Table 2-7,________ percent of the cases were not adjudicated within the first 4 years.
فتح الحزمة
افتح القفل للوصول البطاقات البالغ عددها 184 في هذه المجموعة.
فتح الحزمة
k this deck
46
TABLE 2-8
The Stem-and-Leaf display represents the number of times in a year that a random sample of 100 "lifetime" members of a health club actually visited the facility.
Referring to Table 2-8,the person who has the largest leaf associated with the smallest stem visited the facility ________ times.
The Stem-and-Leaf display represents the number of times in a year that a random sample of 100 "lifetime" members of a health club actually visited the facility.
Referring to Table 2-8,the person who has the largest leaf associated with the smallest stem visited the facility ________ times.
فتح الحزمة
افتح القفل للوصول البطاقات البالغ عددها 184 في هذه المجموعة.
فتح الحزمة
k this deck
47
TABLE 2-7
The Stem-and-Leaf display below contains data on the number of months between the date a civil suit is filed and when the case is actually adjudicated for 50 cases heard in superior court.
Referring to Table 2-7,if a frequency distribution with equal sized classes was made from this data,and the first class was "10 but less than 20," the frequency of that class would be ________.
فتح الحزمة
افتح القفل للوصول البطاقات البالغ عددها 184 في هذه المجموعة.
فتح الحزمة
k this deck
48
TABLE 2-9
The frequency distribution below represents the rents of 250 randomly selected federally subsidized apartments in a small town.
Referring to Table 2-9,________ apartments rented for at least $1,200 but less than $1,400.
The frequency distribution below represents the rents of 250 randomly selected federally subsidized apartments in a small town.
Referring to Table 2-9,________ apartments rented for at least $1,200 but less than $1,400.
فتح الحزمة
افتح القفل للوصول البطاقات البالغ عددها 184 في هذه المجموعة.
فتح الحزمة
k this deck
49
TABLE 2-7
The Stem-and-Leaf display below contains data on the number of months between the date a civil suit is filed and when the case is actually adjudicated for 50 cases heard in superior court.
Referring to Table 2-7,________ percent of the cases were adjudicated within the first 2 years.
The Stem-and-Leaf display below contains data on the number of months between the date a civil suit is filed and when the case is actually adjudicated for 50 cases heard in superior court.
Referring to Table 2-7,________ percent of the cases were adjudicated within the first 2 years.
فتح الحزمة
افتح القفل للوصول البطاقات البالغ عددها 184 في هذه المجموعة.
فتح الحزمة
k this deck
50
TABLE 2-7
The Stem-and-Leaf display below contains data on the number of months between the date a civil suit is filed and when the case is actually adjudicated for 50 cases heard in superior court.
Referring to Table 2-7,if a frequency distribution with equal sized classes was made from this data,and the first class was "10 but less than 20," the cumulative percentage of the second class would be ________.
فتح الحزمة
افتح القفل للوصول البطاقات البالغ عددها 184 في هذه المجموعة.
فتح الحزمة
k this deck
51
TABLE 2-9
The frequency distribution below represents the rents of 250 randomly selected federally subsidized apartments in a small town.
Referring to Table 2-9,________ of the apartments rented for $1,400 or more.
The frequency distribution below represents the rents of 250 randomly selected federally subsidized apartments in a small town.
Referring to Table 2-9,________ of the apartments rented for $1,400 or more.
فتح الحزمة
افتح القفل للوصول البطاقات البالغ عددها 184 في هذه المجموعة.
فتح الحزمة
k this deck
52
TABLE 2-8
The Stem-and-Leaf display represents the number of times in a year that a random sample of 100 "lifetime" members of a health club actually visited the facility.
Referring to Table 2-8,the person who visited the health club more than anyone else in the sample visited the facility ________ times.
The Stem-and-Leaf display represents the number of times in a year that a random sample of 100 "lifetime" members of a health club actually visited the facility.
Referring to Table 2-8,the person who visited the health club more than anyone else in the sample visited the facility ________ times.
فتح الحزمة
افتح القفل للوصول البطاقات البالغ عددها 184 في هذه المجموعة.
فتح الحزمة
k this deck
53
TABLE 2-9
The frequency distribution below represents the rents of 250 randomly selected federally subsidized apartments in a small town.
Referring to Table 2-9,the class midpoint of the second class is ________.
The frequency distribution below represents the rents of 250 randomly selected federally subsidized apartments in a small town.
Referring to Table 2-9,the class midpoint of the second class is ________.
فتح الحزمة
افتح القفل للوصول البطاقات البالغ عددها 184 في هذه المجموعة.
فتح الحزمة
k this deck
54
TABLE 2-8
The Stem-and-Leaf display represents the number of times in a year that a random sample of 100 "lifetime" members of a health club actually visited the facility.
Referring to Table 2-8,if a frequency distribution with equal sized classes was made from this data,and the first class was "0 but less than 10," the frequency of the fifth class would be ________.
فتح الحزمة
افتح القفل للوصول البطاقات البالغ عددها 184 في هذه المجموعة.
فتح الحزمة
k this deck
55
TABLE 2-8
The Stem-and-Leaf display represents the number of times in a year that a random sample of 100 "lifetime" members of a health club actually visited the facility.
Referring to Table 2-8,if a frequency distribution with equal sized classes was made from this data,and the first class was "0 but less than 10," the class midpoint of the third class would be ________.
فتح الحزمة
افتح القفل للوصول البطاقات البالغ عددها 184 في هذه المجموعة.
فتح الحزمة
k this deck
56
TABLE 2-8
The Stem-and-Leaf display represents the number of times in a year that a random sample of 100 "lifetime" members of a health club actually visited the facility.
Referring to Table 2-8,________ of the 100 members visited the health club at least 52 times in a year.
The Stem-and-Leaf display represents the number of times in a year that a random sample of 100 "lifetime" members of a health club actually visited the facility.
Referring to Table 2-8,________ of the 100 members visited the health club at least 52 times in a year.
فتح الحزمة
افتح القفل للوصول البطاقات البالغ عددها 184 في هذه المجموعة.
فتح الحزمة
k this deck
57
TABLE 2-9
The frequency distribution below represents the rents of 250 randomly selected federally subsidized apartments in a small town.
Referring to Table 2-9,the relative frequency of the second class is ________.
The frequency distribution below represents the rents of 250 randomly selected federally subsidized apartments in a small town.
Referring to Table 2-9,the relative frequency of the second class is ________.
فتح الحزمة
افتح القفل للوصول البطاقات البالغ عددها 184 في هذه المجموعة.
فتح الحزمة
k this deck
58
TABLE 2-8
The Stem-and-Leaf display represents the number of times in a year that a random sample of 100 "lifetime" members of a health club actually visited the facility.
Referring to Table 2-8,if a frequency distribution with equal sized classes was made from this data,and the first class was "0 but less than 10," the relative frequency of the last class would be ________.
فتح الحزمة
افتح القفل للوصول البطاقات البالغ عددها 184 في هذه المجموعة.
فتح الحزمة
k this deck
59
TABLE 2-8
The Stem-and-Leaf display represents the number of times in a year that a random sample of 100 "lifetime" members of a health club actually visited the facility.
Referring to Table 2-8,the person who visited the health club less than anyone else in the sample visited the facility ________ times.
The Stem-and-Leaf display represents the number of times in a year that a random sample of 100 "lifetime" members of a health club actually visited the facility.
Referring to Table 2-8,the person who visited the health club less than anyone else in the sample visited the facility ________ times.
فتح الحزمة
افتح القفل للوصول البطاقات البالغ عددها 184 في هذه المجموعة.
فتح الحزمة
k this deck
60
TABLE 2-7
The Stem-and-Leaf display below contains data on the number of months between the date a civil suit is filed and when the case is actually adjudicated for 50 cases heard in superior court.
Referring to Table 2-7,the civil suit with the fourth shortest waiting time between when the suit was filed and when it was adjudicated had a wait of ________ months.
فتح الحزمة
افتح القفل للوصول البطاقات البالغ عددها 184 في هذه المجموعة.
فتح الحزمة
k this deck
61
TABLE 2-10
The histogram below represents scores achieved by 200 job applicants on a personality profile.
Referring to the histogram from Table 2-10,________ percent of the job applicants scored between 10 and 20.
The histogram below represents scores achieved by 200 job applicants on a personality profile.
Referring to the histogram from Table 2-10,________ percent of the job applicants scored between 10 and 20.
فتح الحزمة
افتح القفل للوصول البطاقات البالغ عددها 184 في هذه المجموعة.
فتح الحزمة
k this deck
62
True or False: Percentage polygons are plotted at the boundaries of the class groupings.
فتح الحزمة
افتح القفل للوصول البطاقات البالغ عددها 184 في هذه المجموعة.
فتح الحزمة
k this deck
63
TABLE 2-10
The histogram below represents scores achieved by 200 job applicants on a personality profile.
Referring to the histogram from Table 2-10,________ percent of the applicants scored below 20 or at least 50.
The histogram below represents scores achieved by 200 job applicants on a personality profile.
Referring to the histogram from Table 2-10,________ percent of the applicants scored below 20 or at least 50.
فتح الحزمة
افتح القفل للوصول البطاقات البالغ عددها 184 في هذه المجموعة.
فتح الحزمة
k this deck
64
TABLE 2-10
The histogram below represents scores achieved by 200 job applicants on a personality profile.
Referring to the histogram from Table 2-10,________ percent of the job applicants scored below 50.
The histogram below represents scores achieved by 200 job applicants on a personality profile.
Referring to the histogram from Table 2-10,________ percent of the job applicants scored below 50.
فتح الحزمة
افتح القفل للوصول البطاقات البالغ عددها 184 في هذه المجموعة.
فتح الحزمة
k this deck
65
True or False: The stem-and-leaf display is often superior to the frequency distribution in that it maintains the original values for further analysis.
فتح الحزمة
افتح القفل للوصول البطاقات البالغ عددها 184 في هذه المجموعة.
فتح الحزمة
k this deck
66
TABLE 2-10
The histogram below represents scores achieved by 200 job applicants on a personality profile.
Referring to the histogram from Table 2-10,90% of the job applicants scored above or equal to ________.
The histogram below represents scores achieved by 200 job applicants on a personality profile.
Referring to the histogram from Table 2-10,90% of the job applicants scored above or equal to ________.
فتح الحزمة
افتح القفل للوصول البطاقات البالغ عددها 184 في هذه المجموعة.
فتح الحزمة
k this deck
67
True or False: Ogives are plotted at the midpoints of the class groupings.
فتح الحزمة
افتح القفل للوصول البطاقات البالغ عددها 184 في هذه المجموعة.
فتح الحزمة
k this deck
68
True or False: The main principle behind the Pareto chart is the ability to separate the "vital few" from the "trivial many."
فتح الحزمة
افتح القفل للوصول البطاقات البالغ عددها 184 في هذه المجموعة.
فتح الحزمة
k this deck
69
True or False: Apple Computer,Inc.collected information on the age of their customers.Suppose the youngest customer was 12 and the oldest was 72.To study the distribution of the age among its customers,it can use a Pareto chart.
فتح الحزمة
افتح القفل للوصول البطاقات البالغ عددها 184 في هذه المجموعة.
فتح الحزمة
k this deck
70
True or False: Apple Computer,Inc.collected information on the age of their customers.Suppose the youngest customer was 12 and the oldest was 72.To study the distribution of the age among its customers,it is best to use a pie chart.
فتح الحزمة
افتح القفل للوصول البطاقات البالغ عددها 184 في هذه المجموعة.
فتح الحزمة
k this deck
71
True or False: A Walmart store in a small town monitors customer complaints and organizes these complaints into six distinct categories.Over the past year,suppose the company has received 534 complaints.One possible graphical method for representing these data would be a Pareto chart.
فتح الحزمة
افتح القفل للوصول البطاقات البالغ عددها 184 في هذه المجموعة.
فتح الحزمة
k this deck
72
TABLE 2-10
The histogram below represents scores achieved by 200 job applicants on a personality profile.
Referring to the histogram from Table 2-10,________ percent of the applicants scored between 20 and below 50.
The histogram below represents scores achieved by 200 job applicants on a personality profile.
Referring to the histogram from Table 2-10,________ percent of the applicants scored between 20 and below 50.
فتح الحزمة
افتح القفل للوصول البطاقات البالغ عددها 184 في هذه المجموعة.
فتح الحزمة
k this deck
73
TABLE 2-9
The frequency distribution below represents the rents of 250 randomly selected federally subsidized apartments in a small town.
Referring to Table 2-9,the percentage of apartments renting for less than $1,400 is ________.
The frequency distribution below represents the rents of 250 randomly selected federally subsidized apartments in a small town.
Referring to Table 2-9,the percentage of apartments renting for less than $1,400 is ________.
فتح الحزمة
افتح القفل للوصول البطاقات البالغ عددها 184 في هذه المجموعة.
فتح الحزمة
k this deck
74
TABLE 2-10
The histogram below represents scores achieved by 200 job applicants on a personality profile.
Referring to the histogram from Table 2-10,half of the job applicants scored below ________.
The histogram below represents scores achieved by 200 job applicants on a personality profile.
Referring to the histogram from Table 2-10,half of the job applicants scored below ________.
فتح الحزمة
افتح القفل للوصول البطاقات البالغ عددها 184 في هذه المجموعة.
فتح الحزمة
k this deck
75
True or False: Histograms are used for numerical data while bar charts are suitable for categorical data.
فتح الحزمة
افتح القفل للوصول البطاقات البالغ عددها 184 في هذه المجموعة.
فتح الحزمة
k this deck
76
True or False: The relative frequency is the frequency in each class divided by the total number of observations.
فتح الحزمة
افتح القفل للوصول البطاقات البالغ عددها 184 في هذه المجموعة.
فتح الحزمة
k this deck
77
True or False: A histogram can have gaps between the bars,whereas bar charts cannot have gaps.
فتح الحزمة
افتح القفل للوصول البطاقات البالغ عددها 184 في هذه المجموعة.
فتح الحزمة
k this deck
78
TABLE 2-10
The histogram below represents scores achieved by 200 job applicants on a personality profile.
Referring to the histogram from Table 2-10,the number of job applicants who scored 50 or above is ________.
The histogram below represents scores achieved by 200 job applicants on a personality profile.
Referring to the histogram from Table 2-10,the number of job applicants who scored 50 or above is ________.
فتح الحزمة
افتح القفل للوصول البطاقات البالغ عددها 184 في هذه المجموعة.
فتح الحزمة
k this deck
79
TABLE 2-10
The histogram below represents scores achieved by 200 job applicants on a personality profile.
Referring to the histogram from Table 2-10,the number of job applicants who scored between 30 and below 60 is ________.
The histogram below represents scores achieved by 200 job applicants on a personality profile.
Referring to the histogram from Table 2-10,the number of job applicants who scored between 30 and below 60 is ________.
فتح الحزمة
افتح القفل للوصول البطاقات البالغ عددها 184 في هذه المجموعة.
فتح الحزمة
k this deck
80
True or False: Apple Computer,Inc.collected information on the age of their customers.Suppose the youngest customer was 12 and the oldest was 72.To study the distribution of the age among its customers,it can use a percentage polygon.
فتح الحزمة
افتح القفل للوصول البطاقات البالغ عددها 184 في هذه المجموعة.
فتح الحزمة
k this deck
فتح الحزمة
افتح القفل للوصول البطاقات البالغ عددها 184 في هذه المجموعة.


