Deck 12: Analysis of Variance
ملء الشاشة (f)
سؤال
For the hypothesis test,  ,with n1 = 4 and n2 = 4,the F-test statistic is 50.01.At the 0.01 level of significance,we would reject the null hypothesis.
,with n1 = 4 and n2 = 4,the F-test statistic is 50.01.At the 0.01 level of significance,we would reject the null hypothesis. سؤال
سؤال
سؤال
سؤال
سؤال
For the hypothesis test,  ,with n1 = 9 and n2 = 9,the F-test statistic is 4.53.At the 0.05 level of significance,we would reject the null hypothesis.
,with n1 = 9 and n2 = 9,the F-test statistic is 4.53.At the 0.05 level of significance,we would reject the null hypothesis. سؤال
سؤال
سؤال
For the hypothesis test,  ,with n1 = 10 and n2 = 10,the F-test statistic is 2.56.At the 0.01 level of significance,we would reject the null hypothesis.
,with n1 = 10 and n2 = 10,the F-test statistic is 2.56.At the 0.01 level of significance,we would reject the null hypothesis. سؤال
سؤال
سؤال
سؤال
سؤال
سؤال
سؤال
For the hypothesis test,  ,with n1 = 7 and n2 = 7,the F-test statistic is 2.56.At the 0.05 level of significance,we would reject the null hypothesis.
,with n1 = 7 and n2 = 7,the F-test statistic is 2.56.At the 0.05 level of significance,we would reject the null hypothesis. سؤال
سؤال
سؤال
سؤال
The alternate hypothesis used in ANOVA is  .
.
. سؤال
سؤال
سؤال
سؤال
سؤال
سؤال
سؤال
سؤال
سؤال
سؤال
سؤال
Suppose that an automobile manufacturer designed a radically new lightweight engine and wants to recommend the grade of gasoline that will have the best fuel economy.The four grades are: regular,below regular,premium,and super premium.The test car made three trial runs on the test track using each of the four grades and the miles per gallon recorded.At the 0.05 level,what is the critical value of F used to test the hypothesis that the miles per gallon for each fuel is the same? 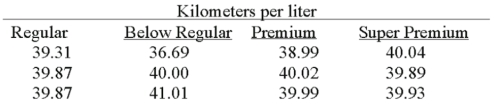 .
.
A)1.96
B)4.07
C)2.33
D)12.00
.A)1.96
B)4.07
C)2.33
D)12.00
سؤال
A manufacturer of automobile transmissions uses three different processes.Management ordered a study of the production costs to see if there is a difference among the three processes.A summary of the findings is shown below. 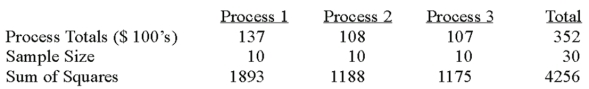 What is the sum of squares for the treatment?
A)67.80
B)58.07
C)149.34
D)23.47
What is the sum of squares for the treatment?A)67.80
B)58.07
C)149.34
D)23.47
سؤال
An experiment to determine the most effective way to teach safety principles applied four different teaching methods.Some employees were given programmed instruction booklets and worked through the course at their own pace.Other employees attended lectures.A third group watched a television presentation,and a fourth group was divided into small discussion groups.A high of 10 was possible.A sample of five tests was selected from each group.The test grade results were: 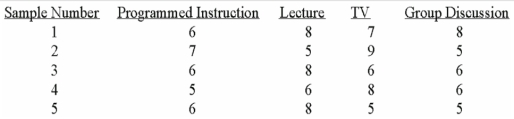 At the 0.01 level,what is the critical value?
A)1.00
B)1.96
C)3.24
D)5.29
At the 0.01 level,what is the critical value?A)1.00
B)1.96
C)3.24
D)5.29
سؤال
سؤال
سؤال
سؤال
سؤال
سؤال
Several employees have submitted different methods of assembling a subassembly.Sample data for each method are: 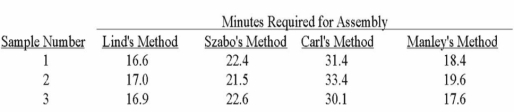 How many treatments are there?
A)3
B)4
C)12
D)0
How many treatments are there?A)3
B)4
C)12
D)0
سؤال
In ANOVA,an F statistic is used to test a null hypothesis such as: 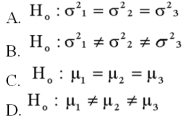
A)Option A
B)Option B
C)Option C
D)Option D
A)Option A
B)Option B
C)Option C
D)Option D
سؤال
A manufacturer of automobile transmissions uses three different processes.Management ordered a study of the production costs to see if there is a difference among the three processes.A summary of the findings is shown below. 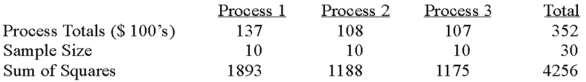 What are the degrees of freedom for the error sum of squares?
A)3
B)10
C)27
D)30
What are the degrees of freedom for the error sum of squares?A)3
B)10
C)27
D)30
سؤال
A manufacturer of automobile transmissions uses three different processes.Management ordered a study of the production costs to see if there is a difference among the three processes.A summary of the findings is shown below. 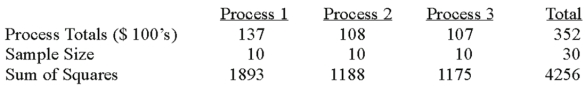 What is the critical value of F at the 5% level of significance?
A)19.45
B)3.00
C)3.35
D)3.39
What is the critical value of F at the 5% level of significance?A)19.45
B)3.00
C)3.35
D)3.39
سؤال
A manufacturer of automobile transmissions uses three different processes.Management ordered a study of the production costs to see if there is a difference among the three processes.A summary of the findings is shown below. 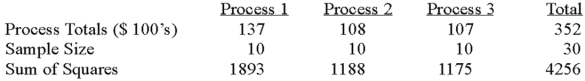 What is the calculated F?
A)0.086
B)1.168
C)11.56
D)13.50
What is the calculated F?A)0.086
B)1.168
C)11.56
D)13.50
سؤال
A manufacturer of automobile transmissions uses three different processes.Management ordered a study of the production costs to see if there is a difference among the three processes.A summary of the findings is shown below. 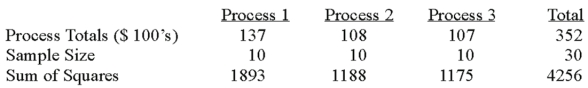 What is the sum of squares of the error?
A)67.80
B)58.07
C)149.34
D)23.47
What is the sum of squares of the error?A)67.80
B)58.07
C)149.34
D)23.47
سؤال
A manufacturer of automobile transmissions uses three different processes.Management ordered a study of the production costs to see if there is a difference among the three processes.A summary of the findings is shown below. 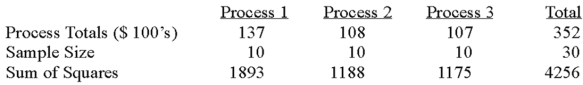 What are the degrees of freedom for the treatment sum of squares?
A)2
B)3
C)10
D)27
What are the degrees of freedom for the treatment sum of squares?A)2
B)3
C)10
D)27
سؤال
Two accounting professors decided to compare the variance of their grading procedures.To accomplish this they each graded the same 10 exams with the following results: 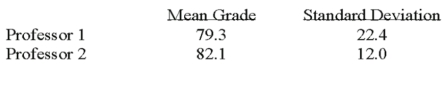 What is the critical value of F at the 0.01 level of significance?
A)5.85
B)5.35
C)6.51
D)4.03
What is the critical value of F at the 0.01 level of significance?A)5.85
B)5.35
C)6.51
D)4.03
سؤال
Given the following Analysis of Variance table for three treatments each with six observations. 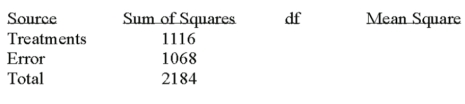 What is the computed value of F?
A)7.48
B)7.84
C)8.84
D)8.48
What is the computed value of F?A)7.48
B)7.84
C)8.84
D)8.48
سؤال
A manufacturer of automobile transmissions uses three different processes.Management ordered a study of the production costs to see if there is a difference among the three processes.A summary of the findings is shown below. 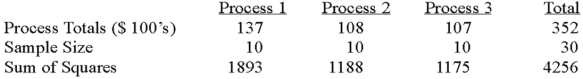 What is the mean square for error?
A)2.511
B)2.151
C)33.9
D)29.035
What is the mean square for error?A)2.511
B)2.151
C)33.9
D)29.035
سؤال
Given the following Analysis of Variance table for three treatments each with six observations. 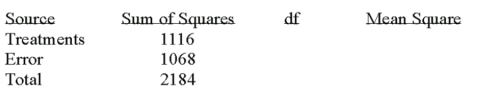 What are the degrees of freedom for the treatment and error sum of squares?
A)3 and 18
B)2 and 17
C)3 and 15
D)2 and 15
What are the degrees of freedom for the treatment and error sum of squares?A)3 and 18
B)2 and 17
C)3 and 15
D)2 and 15
سؤال
Two accounting professors decided to compare the variance of their grading procedures.To accomplish this they each graded the same 10 exams with the following results: 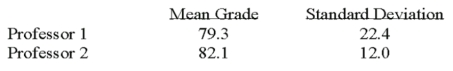 What are the degrees of freedom for the numerator of the F ratio?
A)8
B)9
C)10
D)18
E)20
What are the degrees of freedom for the numerator of the F ratio?A)8
B)9
C)10
D)18
E)20
سؤال
A manufacturer of automobile transmissions uses three different processes.Management ordered a study of the production costs to see if there is a difference among the three processes.A summary of the findings is shown below. 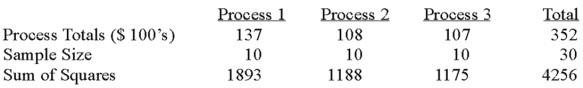 What is the critical value of F at the 1% level of significance?
A)99.46
B)5.49
C)5.39
D)4.61
What is the critical value of F at the 1% level of significance?A)99.46
B)5.49
C)5.39
D)4.61
سؤال
Two accounting professors decided to compare the variance of their grading procedures.To accomplish this they each graded the same 10 exams with the following results: 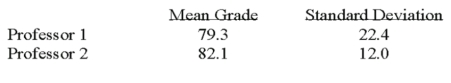 What are the degrees of freedom for the denominator of the F ratio?
A)20
B)18
C)10
D)9
E)8
What are the degrees of freedom for the denominator of the F ratio?A)20
B)18
C)10
D)9
E)8
سؤال
A manufacturer of automobile transmissions uses three different processes.Management ordered a study of the production costs to see if there is a difference among the three processes.A summary of the findings is shown below. 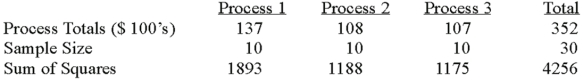 What is the decision?
A)Reject H0 - there is a difference in treatment means
B)Fail to reject H0 - there is a difference in treatment means
C)Reject H0 - there is a difference in errors
D)Fail to reject H0 - there is a difference in errors
What is the decision?A)Reject H0 - there is a difference in treatment means
B)Fail to reject H0 - there is a difference in treatment means
C)Reject H0 - there is a difference in errors
D)Fail to reject H0 - there is a difference in errors
سؤال
Given the following Analysis of Variance table for three treatments each with six observations. 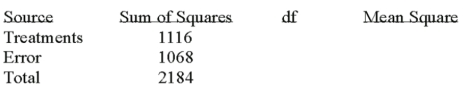 What is the mean square for treatments?
A)71.2
B)71.4
C)558
D)534
What is the mean square for treatments?A)71.2
B)71.4
C)558
D)534
سؤال
Given the following Analysis of Variance table for three treatments each with six observations. 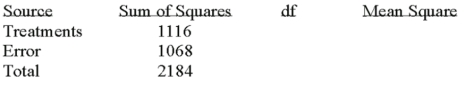 What is the critical value of F at the 5% level of significance?
A)3.29
B)3.68
C)3.59
D)3.20
What is the critical value of F at the 5% level of significance?A)3.29
B)3.68
C)3.59
D)3.20
سؤال
Given the following Analysis of Variance table for three treatments each with six observations. 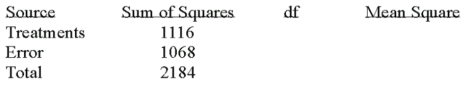 What is the decision regarding the null hypothesis?
A)Reject H0 - there is a difference in treatment means
B)Fail to reject H0 - there is a difference in treatment means
C)Reject H0 - there is a difference in errors
D)Fail to reject H0 - there is a difference in errors
What is the decision regarding the null hypothesis?A)Reject H0 - there is a difference in treatment means
B)Fail to reject H0 - there is a difference in treatment means
C)Reject H0 - there is a difference in errors
D)Fail to reject H0 - there is a difference in errors
سؤال
Two accounting professors decided to compare the variance of their grading procedures.To accomplish this they each graded the same 10 exams with the following results: 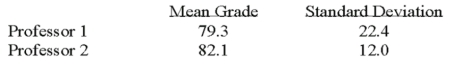 What is H1?
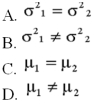
A)Option A
B)Option B
C)Option C
D)Option D
What is H1? A)Option A
B)Option B
C)Option C
D)Option D
سؤال
Two accounting professors decided to compare the variance of their grading procedures.To accomplish this they each graded the same 10 exams with the following results: 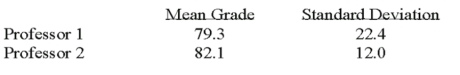 What is H0?
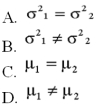
A)Option A
B)Option B
C)Option C
D)Option D
What is H0? A)Option A
B)Option B
C)Option C
D)Option D
سؤال
A manufacturer of automobile transmissions uses three different processes.Management ordered a study of the production costs to see if there is a difference among the three processes.A summary of the findings is shown below. 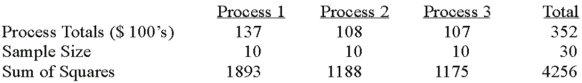 What are the total degrees of freedom?
A)27
B)28
C)29
D)30
What are the total degrees of freedom?A)27
B)28
C)29
D)30
سؤال
A manufacturer of automobile transmissions uses three different processes.Management ordered a study of the production costs to see if there is a difference among the three processes.A summary of the findings is shown below. 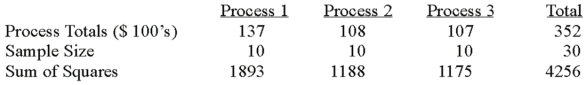 What is the mean square for treatments?
A)2.511
B)2.151
C)33.9
D)29.035
What is the mean square for treatments?A)2.511
B)2.151
C)33.9
D)29.035
سؤال
A random sample of 40 companies with assets over $10 million was selected and asked for their annual computer technology expense and industry.The ANOVA comparing the average computer technology expense among three industries rejected the null hypothesis.The Mean Square Error (MSE)was 195.The following table summarized the results: 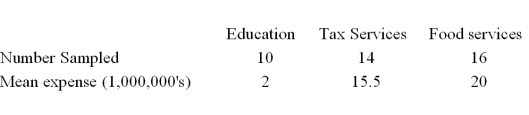 Based on the comparison between the mean computer technology expense for companies in the Tax Service and Food Service industries,the 95% confidence interval shows an interval of -14.85 to 5.85 for the difference.This result indicates that
A)There is no significant difference between the two expenses.
B)The interval contains a difference of 20.7.
C)Companies in the Tax Service industry spend significantly less than companies in the Food Service industry.
D)Companies in the Food Service industry spend significantly less than companies in the Tax Service industry.
Based on the comparison between the mean computer technology expense for companies in the Tax Service and Food Service industries,the 95% confidence interval shows an interval of -14.85 to 5.85 for the difference.This result indicates thatA)There is no significant difference between the two expenses.
B)The interval contains a difference of 20.7.
C)Companies in the Tax Service industry spend significantly less than companies in the Food Service industry.
D)Companies in the Food Service industry spend significantly less than companies in the Tax Service industry.
سؤال
A random sample of 30 executives from companies with assets over $1 million was selected and asked for their annual income and level of education.The ANOVA comparing the average income among three levels of education rejected the null hypothesis.The Mean Square Error (MSE)was 243.7.The following table summarized the results: 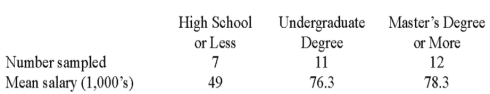 When comparing the mean annual incomes for executives with a High School education or less and Undergraduate Degree,the 95% confidence interval shows an interval of 11.7 to 42.7 for the difference.This result indicates that
A)There is no significant difference between the two incomes.
B)The interval contains a difference of zero.
C)Executives with an Undergraduate Degree earn significantly more than executives with a High School education or less.
D)Executives with an Undergraduate Degree earn significantly less than executives with a High School education or less.
When comparing the mean annual incomes for executives with a High School education or less and Undergraduate Degree,the 95% confidence interval shows an interval of 11.7 to 42.7 for the difference.This result indicates thatA)There is no significant difference between the two incomes.
B)The interval contains a difference of zero.
C)Executives with an Undergraduate Degree earn significantly more than executives with a High School education or less.
D)Executives with an Undergraduate Degree earn significantly less than executives with a High School education or less.
سؤال
A random sample of 16 companies was selected and asked for their annual dividend rate in three different industries: utilities,banking,and insurance.The ANOVA comparing the mean annual dividend rate among three industries rejected the null hypothesis.The Mean Square Error (MSE)was 3.36.The following table summarized the results: 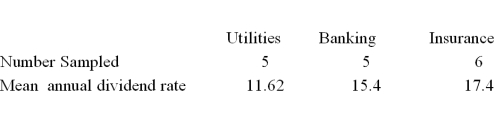 Based on the comparison between the mean annual dividend for companies in the utilities and insurance industries,
A)A confidence interval shows that the mean annual dividend rates are not significantly different.
B)The ANOVA results show that the mean annual dividend rates are significantly different.
C)A confidence interval shows that the mean annual dividend rates are significantly different.
D)The ANOVA results show that the mean annual dividend rates are not significantly different.
Based on the comparison between the mean annual dividend for companies in the utilities and insurance industries,A)A confidence interval shows that the mean annual dividend rates are not significantly different.
B)The ANOVA results show that the mean annual dividend rates are significantly different.
C)A confidence interval shows that the mean annual dividend rates are significantly different.
D)The ANOVA results show that the mean annual dividend rates are not significantly different.
سؤال
Two accounting professors decided to compare the variance of their grading procedures.To accomplish this they each graded the same 10 exams with the following results: 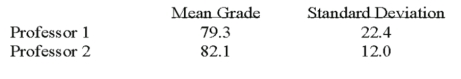 What is the critical value of F at the 0.05 level of significance?
A)5.85
B)5.35
C)3.18
D)4.03
What is the critical value of F at the 0.05 level of significance?A)5.85
B)5.35
C)3.18
D)4.03
سؤال
A random sample of 16 companies was selected and asked for their annual dividend rate in three different industries: utilities,banking,and insurance.The ANOVA comparing the mean annual dividend rate among three industries rejected the null hypothesis.The Mean Square Error (MSE)was 3.36.The following table summarized the results: 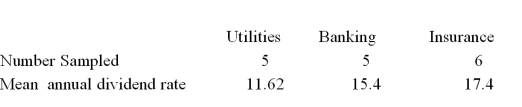 When comparing the mean annual dividend for companies in the utilities and insurance industries,the following 95% confidence interval can be constructed:
A)5.78 2.160 * 2.40
B)5.78 2.120 * 2.40
C)5.78 2.160 * 1.11
D)5.78 2.120 * 1.11
When comparing the mean annual dividend for companies in the utilities and insurance industries,the following 95% confidence interval can be constructed:A)5.78 2.160 * 2.40
B)5.78 2.120 * 2.40
C)5.78 2.160 * 1.11
D)5.78 2.120 * 1.11
سؤال
سؤال
سؤال
A random sample of 16 companies was selected and asked for their annual dividend rate in three different industries: utilities,banking,and insurance.The ANOVA comparing the mean annual dividend rate among three industries rejected the null hypothesis.The Mean Square Error (MSE)was 3.36.The following table summarized the results: 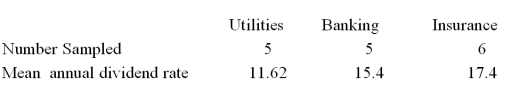 Based on the comparison between the mean annual dividend rate for companies in the utilities and banking,the 95% confidence interval shows an interval of 1.28 to 6.28 for the difference.This result indicates that
A)There is no significant difference between the two rates.
B)The interval contains a difference of 5.00.
C)The annual dividend rate in the utilities industry is significantly less than the annual dividend rate in banking industry.
D)The annual dividend rate in banking industry is significantly less than the annual dividend rate in utilities industry.
Based on the comparison between the mean annual dividend rate for companies in the utilities and banking,the 95% confidence interval shows an interval of 1.28 to 6.28 for the difference.This result indicates thatA)There is no significant difference between the two rates.
B)The interval contains a difference of 5.00.
C)The annual dividend rate in the utilities industry is significantly less than the annual dividend rate in banking industry.
D)The annual dividend rate in banking industry is significantly less than the annual dividend rate in utilities industry.
سؤال
Two accounting professors decided to compare the variance of their grading procedures.To accomplish this they each graded the same 10 exams with the following results: 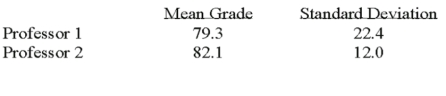 At the 5% level of significance,what is the decision regarding the null hypothesis?
A)Reject the null hypothesis and conclude the variance is different.
B)Fail to reject the null hypothesis and conclude no significant difference in the variance.
C)Reject the null hypothesis and conclude the variance is the same.
D)Fail to reject the null hypothesis and conclude the variance is the same.
At the 5% level of significance,what is the decision regarding the null hypothesis?A)Reject the null hypothesis and conclude the variance is different.
B)Fail to reject the null hypothesis and conclude no significant difference in the variance.
C)Reject the null hypothesis and conclude the variance is the same.
D)Fail to reject the null hypothesis and conclude the variance is the same.
سؤال
سؤال
A random sample of 30 executives from companies with assets over $1 million was selected and asked for their annual income and level of education.The ANOVA comparing the average income among three levels of education rejected the null hypothesis.The Mean Square Error (MSE)was 243.7.The following table summarized the results: 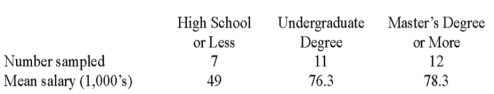 When comparing the mean annual incomes for executives with Undergraduate and Master's Degree or more,the following 95% confidence interval can be constructed:
A)2.0 2.052 * 6.51
B)2.0 3.182 * 6.51
C)2.0 2.052 * 42.46
D)2.0 3.182 * 42.46
When comparing the mean annual incomes for executives with Undergraduate and Master's Degree or more,the following 95% confidence interval can be constructed:A)2.0 2.052 * 6.51
B)2.0 3.182 * 6.51
C)2.0 2.052 * 42.46
D)2.0 3.182 * 42.46
سؤال
Two accounting professors decided to compare the variance of their grading procedures.To accomplish this they each graded the same 10 exams with the following results: 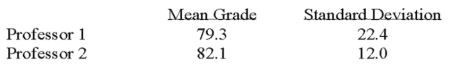 The calculated F ratio is
A)3.484
B)1.867
C)3.18
D)5.35
The calculated F ratio isA)3.484
B)1.867
C)3.18
D)5.35
سؤال
A random sample of 30 executives from companies with assets over $1 million was selected and asked for their annual income and level of education.The ANOVA comparing the average income among three levels of education rejected the null hypothesis.The Mean Square Error (MSE)was 243.7.The following table summarized the results: 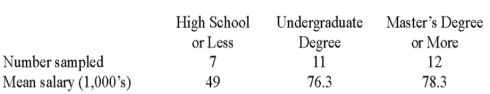 Based on the comparison between the mean annual incomes for executives with Undergraduate and Master's Degree or more,
A)A confidence interval shows that the mean annual incomes are not significantly different.
B)The ANOVA results show that the mean annual incomes are significantly different.
C)A confidence interval shows that the mean annual incomes are significantly different.
D)The ANOVA results show that the mean annual incomes are not significantly different.
Based on the comparison between the mean annual incomes for executives with Undergraduate and Master's Degree or more,A)A confidence interval shows that the mean annual incomes are not significantly different.
B)The ANOVA results show that the mean annual incomes are significantly different.
C)A confidence interval shows that the mean annual incomes are significantly different.
D)The ANOVA results show that the mean annual incomes are not significantly different.
سؤال
A random sample of 40 companies with assets over $10 million was selected and asked for their annual computer technology expense and industry.The ANOVA comparing the average computer technology expense among three industries rejected the null hypothesis.The Mean Square Error (MSE)was 195.The following table summarized the results: 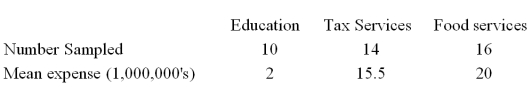 When comparing the mean annual computer technology expense for companies in the Education and Tax services industries,the following 95% confidence interval can be constructed:
A)13.5 2.026 * 5.78
B)13.5 2.021 * 5.78
C)13.5 2.026 * 13.96
D)13.5 2.021 * 13.96
When comparing the mean annual computer technology expense for companies in the Education and Tax services industries,the following 95% confidence interval can be constructed:A)13.5 2.026 * 5.78
B)13.5 2.021 * 5.78
C)13.5 2.026 * 13.96
D)13.5 2.021 * 13.96
سؤال
Two accounting professors decided to compare the variance of their grading procedures.To accomplish this they each graded the same 10 exams with the following results: 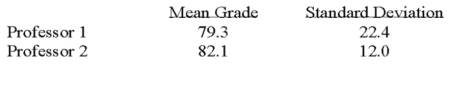 At the 1% level of significance,what is the decision?
A)Reject the null hypothesis and conclude the variance is different.
B)Fail to reject the null hypothesis and conclude the variance is different.
C)Reject the null hypothesis and conclude the variance is the same.
D)Fail to reject the null hypothesis and conclude the variance is the same.
At the 1% level of significance,what is the decision?A)Reject the null hypothesis and conclude the variance is different.
B)Fail to reject the null hypothesis and conclude the variance is different.
C)Reject the null hypothesis and conclude the variance is the same.
D)Fail to reject the null hypothesis and conclude the variance is the same.
سؤال
سؤال
A random sample of 40 companies with assets over $10 million was selected and asked for their annual computer technology expense and industry.The ANOVA comparing the average computer technology expense among three industries rejected the null hypothesis.The Mean Square Error (MSE)was 195.The following table summarized the results: 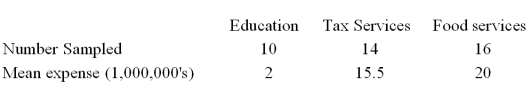 Based on the comparison between the mean computer technology expense for companies in the Education and Tax services industries,
A)A confidence interval shows that the mean annual computer technology expenses are not significantly different.
B)The ANOVA results show that the mean annual computer technology expenses are significantly different.
C)A confidence interval shows that the mean annual computer technology expenses are significantly different.
D)The ANOVA results show that the mean annual computer technology expenses are not significantly different.
Based on the comparison between the mean computer technology expense for companies in the Education and Tax services industries,A)A confidence interval shows that the mean annual computer technology expenses are not significantly different.
B)The ANOVA results show that the mean annual computer technology expenses are significantly different.
C)A confidence interval shows that the mean annual computer technology expenses are significantly different.
D)The ANOVA results show that the mean annual computer technology expenses are not significantly different.
سؤال
سؤال
سؤال

فتح الحزمة
قم بالتسجيل لفتح البطاقات في هذه المجموعة!
Unlock Deck
Unlock Deck
1/94
العب
ملء الشاشة (f)
Deck 12: Analysis of Variance
1
For the hypothesis test, ,with n1 = 4 and n2 = 4,the F-test statistic is 50.01.At the 0.01 level of significance,we would reject the null hypothesis.
,with n1 = 4 and n2 = 4,the F-test statistic is 50.01.At the 0.01 level of significance,we would reject the null hypothesis.True
2
If the computed value of F is 0.99 and the critical value is 3.89,we would not reject the null hypothesis.
True
3
The alternate hypothesis for ANOVA states that not all the means are equal.
True
4
The shape of the F distribution is determined by the degrees of freedom for the F-statistic,one for the numerator and one for the denominator.
فتح الحزمة
افتح القفل للوصول البطاقات البالغ عددها 94 في هذه المجموعة.
فتح الحزمة
k this deck
5
To employ ANOVA,the populations should have approximately equal standard deviations.
فتح الحزمة
افتح القفل للوصول البطاقات البالغ عددها 94 في هذه المجموعة.
فتح الحزمة
k this deck
6
For the hypothesis test, ,with n1 = 9 and n2 = 9,the F-test statistic is 4.53.At the 0.05 level of significance,we would reject the null hypothesis.
,with n1 = 9 and n2 = 9,the F-test statistic is 4.53.At the 0.05 level of significance,we would reject the null hypothesis. فتح الحزمة
افتح القفل للوصول البطاقات البالغ عددها 94 في هذه المجموعة.
فتح الحزمة
k this deck
7
The test statistic used in ANOVA is Student's t.
فتح الحزمة
افتح القفل للوصول البطاقات البالغ عددها 94 في هذه المجموعة.
فتح الحزمة
k this deck
8
To employ ANOVA,the populations being studied must be approximately normally distributed.
فتح الحزمة
افتح القفل للوصول البطاقات البالغ عددها 94 في هذه المجموعة.
فتح الحزمة
k this deck
9
For the hypothesis test, ,with n1 = 10 and n2 = 10,the F-test statistic is 2.56.At the 0.01 level of significance,we would reject the null hypothesis.
,with n1 = 10 and n2 = 10,the F-test statistic is 2.56.At the 0.01 level of significance,we would reject the null hypothesis. فتح الحزمة
افتح القفل للوصول البطاقات البالغ عددها 94 في هذه المجموعة.
فتح الحزمة
k this deck
10
There is one,unique F distribution for a F-statistic with 29 degrees of freedom in the numerator and 28 degrees of freedom in the denominator.
فتح الحزمة
افتح القفل للوصول البطاقات البالغ عددها 94 في هذه المجموعة.
فتح الحزمة
k this deck
11
For an ANOVA test,rejection of the null hypothesis does not identify which treatment means differ significantly.
فتح الحزمة
افتح القفل للوصول البطاقات البالغ عددها 94 في هذه المجموعة.
فتح الحزمة
k this deck
12
The F distribution's curve is positively skewed.
فتح الحزمة
افتح القفل للوصول البطاقات البالغ عددها 94 في هذه المجموعة.
فتح الحزمة
k this deck
13
Like Student's t distribution,a change in the degrees of freedom causes a change in the shape of the F distribution.
فتح الحزمة
افتح القفل للوصول البطاقات البالغ عددها 94 في هذه المجموعة.
فتح الحزمة
k this deck
14
If the computed value of F is 4.01 and the critical value is 2.67,we would conclude that all the population means are equal.
فتح الحزمة
افتح القفل للوصول البطاقات البالغ عددها 94 في هذه المجموعة.
فتح الحزمة
k this deck
15
If we want to determine which treatment means differ,we compute a confidence interval for the difference between each pair of means.
فتح الحزمة
افتح القفل للوصول البطاقات البالغ عددها 94 في هذه المجموعة.
فتح الحزمة
k this deck
16
For the hypothesis test, ,with n1 = 7 and n2 = 7,the F-test statistic is 2.56.At the 0.05 level of significance,we would reject the null hypothesis.
,with n1 = 7 and n2 = 7,the F-test statistic is 2.56.At the 0.05 level of significance,we would reject the null hypothesis. فتح الحزمة
افتح القفل للوصول البطاقات البالغ عددها 94 في هذه المجموعة.
فتح الحزمة
k this deck
17
In an ANOVA table,k represents the total number of sample observations and n represents the total number of treatments.
فتح الحزمة
افتح القفل للوصول البطاقات البالغ عددها 94 في هذه المجموعة.
فتح الحزمة
k this deck
18
One characteristic of the F distribution is that F cannot be negative.
فتح الحزمة
افتح القفل للوصول البطاقات البالغ عددها 94 في هذه المجموعة.
فتح الحزمة
k this deck
19
One characteristic of the F distribution is that the computed F can only range between -1 and +1.
فتح الحزمة
افتح القفل للوصول البطاقات البالغ عددها 94 في هذه المجموعة.
فتح الحزمة
k this deck
20
The alternate hypothesis used in ANOVA is .
. فتح الحزمة
افتح القفل للوصول البطاقات البالغ عددها 94 في هذه المجموعة.
فتح الحزمة
k this deck
21
In ANOVA analysis,when the null hypothesis is rejected,we can test for differences between treatment means by
A)constructing confidence intervals.
B)adding another treatment.
C)doing an additional ANOVA.
D)doing a t test.
A)constructing confidence intervals.
B)adding another treatment.
C)doing an additional ANOVA.
D)doing a t test.
فتح الحزمة
افتح القفل للوصول البطاقات البالغ عددها 94 في هذه المجموعة.
فتح الحزمة
k this deck
22
An F statistic is:
A)a ratio of two means.
B)a ratio of two variances.
C)the difference between three means.
D)a population parameter.
A)a ratio of two means.
B)a ratio of two variances.
C)the difference between three means.
D)a population parameter.
فتح الحزمة
افتح القفل للوصول البطاقات البالغ عددها 94 في هذه المجموعة.
فتح الحزمة
k this deck
23
A large department store examined a sample of the 18 credit card sales and recorded the amounts charged for each of three types of credit cards: MasterCard,Visa and Discover.Six MasterCard sales,seven Visa and five Discover sales were recorded.The store used an ANOVA to test if the mean sales for each credit card were equal.What are the degrees of freedom for the F statistic?
A)18 in the numerator,3 in the denominator
B)3 in the numerator,18 in the denominator
C)2 in the numerator,15 in the denominator
D)6 in the numerator,15 in the denominator
A)18 in the numerator,3 in the denominator
B)3 in the numerator,18 in the denominator
C)2 in the numerator,15 in the denominator
D)6 in the numerator,15 in the denominator
فتح الحزمة
افتح القفل للوصول البطاقات البالغ عددها 94 في هذه المجموعة.
فتح الحزمة
k this deck
24
Three different fertilizers were applied to a field of celery.In computing F,how many degrees of freedom are there in the numerator?
A)0
B)1
C)2
D)3
A)0
B)1
C)2
D)3
فتح الحزمة
افتح القفل للوصول البطاقات البالغ عددها 94 في هذه المجموعة.
فتح الحزمة
k this deck
25
When testing for differences between treatment means,a confidence interval is based on
A)the mean square error.
B)the standard deviation.
C)the sum of squared errors.
D)the standard error of the mean.
A)the mean square error.
B)the standard deviation.
C)the sum of squared errors.
D)the standard error of the mean.
فتح الحزمة
افتح القفل للوصول البطاقات البالغ عددها 94 في هذه المجموعة.
فتح الحزمة
k this deck
26
When testing for differences between treatment means,the t statistic is based on:
A)The treatment degrees of freedom.
B)The total degrees of freedom.
C)The error degrees of freedom.
D)The ratio of treatment and error degrees of freedom.
A)The treatment degrees of freedom.
B)The total degrees of freedom.
C)The error degrees of freedom.
D)The ratio of treatment and error degrees of freedom.
فتح الحزمة
افتح القفل للوصول البطاقات البالغ عددها 94 في هذه المجموعة.
فتح الحزمة
k this deck
27
If the endpoints of a confidence interval for the difference between a pair of treatment means are both positive numbers,then we reject the null hypothesis that there is no difference in the pair of treatment means.
فتح الحزمة
افتح القفل للوصول البطاقات البالغ عددها 94 في هذه المجموعة.
فتح الحزمة
k this deck
28
Which statement is correct about the F distribution?
A)Cannot be negative
B)Cannot be positive
C)Is the same as the t distribution
D)Is the same as the z distribution
A)Cannot be negative
B)Cannot be positive
C)Is the same as the t distribution
D)Is the same as the z distribution
فتح الحزمة
افتح القفل للوصول البطاقات البالغ عددها 94 في هذه المجموعة.
فتح الحزمة
k this deck
29
An electronics company wants to compare the quality of their cell phones to the cell phones from three competitors.They sample 10 phones from each company and count the number of defects for each phone.If ANOVA were used to compare the average number of defects,the treatments would be defined as:
A)The number of cell phones sampled.
B)The average number of defects.
C)The total number of phones.
D)The four companies.
A)The number of cell phones sampled.
B)The average number of defects.
C)The total number of phones.
D)The four companies.
فتح الحزمة
افتح القفل للوصول البطاقات البالغ عددها 94 في هذه المجموعة.
فتح الحزمة
k this deck
30
Analysis of variance is used to
A)compare nominal data.
B)compute t test.
C)compare population proportions.
D)simultaneously compare several population means.
A)compare nominal data.
B)compute t test.
C)compare population proportions.
D)simultaneously compare several population means.
فتح الحزمة
افتح القفل للوصول البطاقات البالغ عددها 94 في هذه المجموعة.
فتح الحزمة
k this deck
31
Suppose that an automobile manufacturer designed a radically new lightweight engine and wants to recommend the grade of gasoline that will have the best fuel economy.The four grades are: regular,below regular,premium,and super premium.The test car made three trial runs on the test track using each of the four grades and the miles per gallon recorded.At the 0.05 level,what is the critical value of F used to test the hypothesis that the miles per gallon for each fuel is the same? .
A)1.96
B)4.07
C)2.33
D)12.00
.A)1.96
B)4.07
C)2.33
D)12.00
فتح الحزمة
افتح القفل للوصول البطاقات البالغ عددها 94 في هذه المجموعة.
فتح الحزمة
k this deck
32
A manufacturer of automobile transmissions uses three different processes.Management ordered a study of the production costs to see if there is a difference among the three processes.A summary of the findings is shown below. What is the sum of squares for the treatment?
A)67.80
B)58.07
C)149.34
D)23.47
What is the sum of squares for the treatment?A)67.80
B)58.07
C)149.34
D)23.47
فتح الحزمة
افتح القفل للوصول البطاقات البالغ عددها 94 في هذه المجموعة.
فتح الحزمة
k this deck
33
An experiment to determine the most effective way to teach safety principles applied four different teaching methods.Some employees were given programmed instruction booklets and worked through the course at their own pace.Other employees attended lectures.A third group watched a television presentation,and a fourth group was divided into small discussion groups.A high of 10 was possible.A sample of five tests was selected from each group.The test grade results were: At the 0.01 level,what is the critical value?
A)1.00
B)1.96
C)3.24
D)5.29
At the 0.01 level,what is the critical value?A)1.00
B)1.96
C)3.24
D)5.29
فتح الحزمة
افتح القفل للوصول البطاقات البالغ عددها 94 في هذه المجموعة.
فتح الحزمة
k this deck
34
What distribution does the F distribution approach as the sample size increases?
A)Binomial
B)Normal
C)Poisson
D)Exponential
A)Binomial
B)Normal
C)Poisson
D)Exponential
فتح الحزمة
افتح القفل للوصول البطاقات البالغ عددها 94 في هذه المجموعة.
فتح الحزمة
k this deck
35
If a confidence interval for the difference between a pair of treatment means includes 0,then we fail to reject the null hypothesis that there is no difference in the pair of treatment means.
فتح الحزمة
افتح القفل للوصول البطاقات البالغ عددها 94 في هذه المجموعة.
فتح الحزمة
k this deck
36
When the null hypothesis for an ANOVA analysis comparing four treatment means,is rejected,
A)4 comparisons of treatment means can be made.
B)8 comparisons of treatment means can be made.
C)12 comparisons of treatment means can be made.
D)16 comparisons of treatment means can be made.
A)4 comparisons of treatment means can be made.
B)8 comparisons of treatment means can be made.
C)12 comparisons of treatment means can be made.
D)16 comparisons of treatment means can be made.
فتح الحزمة
افتح القفل للوصول البطاقات البالغ عددها 94 في هذه المجموعة.
فتح الحزمة
k this deck
37
When testing for differences between treatment means,the degrees of freedom for the t statistic are:
A)k
B)( n - 1 )
C)( n - k )
D)( 1/n1 + 1/n2 )
A)k
B)( n - 1 )
C)( n - k )
D)( 1/n1 + 1/n2 )
فتح الحزمة
افتح القفل للوصول البطاقات البالغ عددها 94 في هذه المجموعة.
فتح الحزمة
k this deck
38
If an ANOVA test is conducted and the null hypothesis is rejected,what does this indicate?
A)Too many degrees of freedom
B)No difference between the population means
C)A difference between at least one pair of population means
D)All population means are different
A)Too many degrees of freedom
B)No difference between the population means
C)A difference between at least one pair of population means
D)All population means are different
فتح الحزمة
افتح القفل للوصول البطاقات البالغ عددها 94 في هذه المجموعة.
فتح الحزمة
k this deck
39
Several employees have submitted different methods of assembling a subassembly.Sample data for each method are: How many treatments are there?
A)3
B)4
C)12
D)0
How many treatments are there?A)3
B)4
C)12
D)0
فتح الحزمة
افتح القفل للوصول البطاقات البالغ عددها 94 في هذه المجموعة.
فتح الحزمة
k this deck
40
In ANOVA,an F statistic is used to test a null hypothesis such as:
A)Option A
B)Option B
C)Option C
D)Option D
A)Option A
B)Option B
C)Option C
D)Option D
فتح الحزمة
افتح القفل للوصول البطاقات البالغ عددها 94 في هذه المجموعة.
فتح الحزمة
k this deck
41
A manufacturer of automobile transmissions uses three different processes.Management ordered a study of the production costs to see if there is a difference among the three processes.A summary of the findings is shown below. What are the degrees of freedom for the error sum of squares?
A)3
B)10
C)27
D)30
What are the degrees of freedom for the error sum of squares?A)3
B)10
C)27
D)30
فتح الحزمة
افتح القفل للوصول البطاقات البالغ عددها 94 في هذه المجموعة.
فتح الحزمة
k this deck
42
A manufacturer of automobile transmissions uses three different processes.Management ordered a study of the production costs to see if there is a difference among the three processes.A summary of the findings is shown below. What is the critical value of F at the 5% level of significance?
A)19.45
B)3.00
C)3.35
D)3.39
What is the critical value of F at the 5% level of significance?A)19.45
B)3.00
C)3.35
D)3.39
فتح الحزمة
افتح القفل للوصول البطاقات البالغ عددها 94 في هذه المجموعة.
فتح الحزمة
k this deck
43
A manufacturer of automobile transmissions uses three different processes.Management ordered a study of the production costs to see if there is a difference among the three processes.A summary of the findings is shown below. What is the calculated F?
A)0.086
B)1.168
C)11.56
D)13.50
What is the calculated F?A)0.086
B)1.168
C)11.56
D)13.50
فتح الحزمة
افتح القفل للوصول البطاقات البالغ عددها 94 في هذه المجموعة.
فتح الحزمة
k this deck
44
A manufacturer of automobile transmissions uses three different processes.Management ordered a study of the production costs to see if there is a difference among the three processes.A summary of the findings is shown below. What is the sum of squares of the error?
A)67.80
B)58.07
C)149.34
D)23.47
What is the sum of squares of the error?A)67.80
B)58.07
C)149.34
D)23.47
فتح الحزمة
افتح القفل للوصول البطاقات البالغ عددها 94 في هذه المجموعة.
فتح الحزمة
k this deck
45
A manufacturer of automobile transmissions uses three different processes.Management ordered a study of the production costs to see if there is a difference among the three processes.A summary of the findings is shown below. What are the degrees of freedom for the treatment sum of squares?
A)2
B)3
C)10
D)27
What are the degrees of freedom for the treatment sum of squares?A)2
B)3
C)10
D)27
فتح الحزمة
افتح القفل للوصول البطاقات البالغ عددها 94 في هذه المجموعة.
فتح الحزمة
k this deck
46
Two accounting professors decided to compare the variance of their grading procedures.To accomplish this they each graded the same 10 exams with the following results: What is the critical value of F at the 0.01 level of significance?
A)5.85
B)5.35
C)6.51
D)4.03
What is the critical value of F at the 0.01 level of significance?A)5.85
B)5.35
C)6.51
D)4.03
فتح الحزمة
افتح القفل للوصول البطاقات البالغ عددها 94 في هذه المجموعة.
فتح الحزمة
k this deck
47
Given the following Analysis of Variance table for three treatments each with six observations. What is the computed value of F?
A)7.48
B)7.84
C)8.84
D)8.48
What is the computed value of F?A)7.48
B)7.84
C)8.84
D)8.48
فتح الحزمة
افتح القفل للوصول البطاقات البالغ عددها 94 في هذه المجموعة.
فتح الحزمة
k this deck
48
A manufacturer of automobile transmissions uses three different processes.Management ordered a study of the production costs to see if there is a difference among the three processes.A summary of the findings is shown below. What is the mean square for error?
A)2.511
B)2.151
C)33.9
D)29.035
What is the mean square for error?A)2.511
B)2.151
C)33.9
D)29.035
فتح الحزمة
افتح القفل للوصول البطاقات البالغ عددها 94 في هذه المجموعة.
فتح الحزمة
k this deck
49
Given the following Analysis of Variance table for three treatments each with six observations. What are the degrees of freedom for the treatment and error sum of squares?
A)3 and 18
B)2 and 17
C)3 and 15
D)2 and 15
What are the degrees of freedom for the treatment and error sum of squares?A)3 and 18
B)2 and 17
C)3 and 15
D)2 and 15
فتح الحزمة
افتح القفل للوصول البطاقات البالغ عددها 94 في هذه المجموعة.
فتح الحزمة
k this deck
50
Two accounting professors decided to compare the variance of their grading procedures.To accomplish this they each graded the same 10 exams with the following results: What are the degrees of freedom for the numerator of the F ratio?
A)8
B)9
C)10
D)18
E)20
What are the degrees of freedom for the numerator of the F ratio?A)8
B)9
C)10
D)18
E)20
فتح الحزمة
افتح القفل للوصول البطاقات البالغ عددها 94 في هذه المجموعة.
فتح الحزمة
k this deck
51
A manufacturer of automobile transmissions uses three different processes.Management ordered a study of the production costs to see if there is a difference among the three processes.A summary of the findings is shown below. What is the critical value of F at the 1% level of significance?
A)99.46
B)5.49
C)5.39
D)4.61
What is the critical value of F at the 1% level of significance?A)99.46
B)5.49
C)5.39
D)4.61
فتح الحزمة
افتح القفل للوصول البطاقات البالغ عددها 94 في هذه المجموعة.
فتح الحزمة
k this deck
52
Two accounting professors decided to compare the variance of their grading procedures.To accomplish this they each graded the same 10 exams with the following results: What are the degrees of freedom for the denominator of the F ratio?
A)20
B)18
C)10
D)9
E)8
What are the degrees of freedom for the denominator of the F ratio?A)20
B)18
C)10
D)9
E)8
فتح الحزمة
افتح القفل للوصول البطاقات البالغ عددها 94 في هذه المجموعة.
فتح الحزمة
k this deck
53
A manufacturer of automobile transmissions uses three different processes.Management ordered a study of the production costs to see if there is a difference among the three processes.A summary of the findings is shown below. What is the decision?
A)Reject H0 - there is a difference in treatment means
B)Fail to reject H0 - there is a difference in treatment means
C)Reject H0 - there is a difference in errors
D)Fail to reject H0 - there is a difference in errors
What is the decision?A)Reject H0 - there is a difference in treatment means
B)Fail to reject H0 - there is a difference in treatment means
C)Reject H0 - there is a difference in errors
D)Fail to reject H0 - there is a difference in errors
فتح الحزمة
افتح القفل للوصول البطاقات البالغ عددها 94 في هذه المجموعة.
فتح الحزمة
k this deck
54
Given the following Analysis of Variance table for three treatments each with six observations. What is the mean square for treatments?
A)71.2
B)71.4
C)558
D)534
What is the mean square for treatments?A)71.2
B)71.4
C)558
D)534
فتح الحزمة
افتح القفل للوصول البطاقات البالغ عددها 94 في هذه المجموعة.
فتح الحزمة
k this deck
55
Given the following Analysis of Variance table for three treatments each with six observations. What is the critical value of F at the 5% level of significance?
A)3.29
B)3.68
C)3.59
D)3.20
What is the critical value of F at the 5% level of significance?A)3.29
B)3.68
C)3.59
D)3.20
فتح الحزمة
افتح القفل للوصول البطاقات البالغ عددها 94 في هذه المجموعة.
فتح الحزمة
k this deck
56
Given the following Analysis of Variance table for three treatments each with six observations. What is the decision regarding the null hypothesis?
A)Reject H0 - there is a difference in treatment means
B)Fail to reject H0 - there is a difference in treatment means
C)Reject H0 - there is a difference in errors
D)Fail to reject H0 - there is a difference in errors
What is the decision regarding the null hypothesis?A)Reject H0 - there is a difference in treatment means
B)Fail to reject H0 - there is a difference in treatment means
C)Reject H0 - there is a difference in errors
D)Fail to reject H0 - there is a difference in errors
فتح الحزمة
افتح القفل للوصول البطاقات البالغ عددها 94 في هذه المجموعة.
فتح الحزمة
k this deck
57
Two accounting professors decided to compare the variance of their grading procedures.To accomplish this they each graded the same 10 exams with the following results: What is H1?
A)Option A
B)Option B
C)Option C
D)Option D
What is H1? A)Option A
B)Option B
C)Option C
D)Option D
فتح الحزمة
افتح القفل للوصول البطاقات البالغ عددها 94 في هذه المجموعة.
فتح الحزمة
k this deck
58
Two accounting professors decided to compare the variance of their grading procedures.To accomplish this they each graded the same 10 exams with the following results: What is H0?
A)Option A
B)Option B
C)Option C
D)Option D
What is H0? A)Option A
B)Option B
C)Option C
D)Option D
فتح الحزمة
افتح القفل للوصول البطاقات البالغ عددها 94 في هذه المجموعة.
فتح الحزمة
k this deck
59
A manufacturer of automobile transmissions uses three different processes.Management ordered a study of the production costs to see if there is a difference among the three processes.A summary of the findings is shown below. What are the total degrees of freedom?
A)27
B)28
C)29
D)30
What are the total degrees of freedom?A)27
B)28
C)29
D)30
فتح الحزمة
افتح القفل للوصول البطاقات البالغ عددها 94 في هذه المجموعة.
فتح الحزمة
k this deck
60
A manufacturer of automobile transmissions uses three different processes.Management ordered a study of the production costs to see if there is a difference among the three processes.A summary of the findings is shown below. What is the mean square for treatments?
A)2.511
B)2.151
C)33.9
D)29.035
What is the mean square for treatments?A)2.511
B)2.151
C)33.9
D)29.035
فتح الحزمة
افتح القفل للوصول البطاقات البالغ عددها 94 في هذه المجموعة.
فتح الحزمة
k this deck
61
A random sample of 40 companies with assets over $10 million was selected and asked for their annual computer technology expense and industry.The ANOVA comparing the average computer technology expense among three industries rejected the null hypothesis.The Mean Square Error (MSE)was 195.The following table summarized the results: Based on the comparison between the mean computer technology expense for companies in the Tax Service and Food Service industries,the 95% confidence interval shows an interval of -14.85 to 5.85 for the difference.This result indicates that
A)There is no significant difference between the two expenses.
B)The interval contains a difference of 20.7.
C)Companies in the Tax Service industry spend significantly less than companies in the Food Service industry.
D)Companies in the Food Service industry spend significantly less than companies in the Tax Service industry.
Based on the comparison between the mean computer technology expense for companies in the Tax Service and Food Service industries,the 95% confidence interval shows an interval of -14.85 to 5.85 for the difference.This result indicates thatA)There is no significant difference between the two expenses.
B)The interval contains a difference of 20.7.
C)Companies in the Tax Service industry spend significantly less than companies in the Food Service industry.
D)Companies in the Food Service industry spend significantly less than companies in the Tax Service industry.
فتح الحزمة
افتح القفل للوصول البطاقات البالغ عددها 94 في هذه المجموعة.
فتح الحزمة
k this deck
62
A random sample of 30 executives from companies with assets over $1 million was selected and asked for their annual income and level of education.The ANOVA comparing the average income among three levels of education rejected the null hypothesis.The Mean Square Error (MSE)was 243.7.The following table summarized the results: When comparing the mean annual incomes for executives with a High School education or less and Undergraduate Degree,the 95% confidence interval shows an interval of 11.7 to 42.7 for the difference.This result indicates that
A)There is no significant difference between the two incomes.
B)The interval contains a difference of zero.
C)Executives with an Undergraduate Degree earn significantly more than executives with a High School education or less.
D)Executives with an Undergraduate Degree earn significantly less than executives with a High School education or less.
When comparing the mean annual incomes for executives with a High School education or less and Undergraduate Degree,the 95% confidence interval shows an interval of 11.7 to 42.7 for the difference.This result indicates thatA)There is no significant difference between the two incomes.
B)The interval contains a difference of zero.
C)Executives with an Undergraduate Degree earn significantly more than executives with a High School education or less.
D)Executives with an Undergraduate Degree earn significantly less than executives with a High School education or less.
فتح الحزمة
افتح القفل للوصول البطاقات البالغ عددها 94 في هذه المجموعة.
فتح الحزمة
k this deck
63
A random sample of 16 companies was selected and asked for their annual dividend rate in three different industries: utilities,banking,and insurance.The ANOVA comparing the mean annual dividend rate among three industries rejected the null hypothesis.The Mean Square Error (MSE)was 3.36.The following table summarized the results: Based on the comparison between the mean annual dividend for companies in the utilities and insurance industries,
A)A confidence interval shows that the mean annual dividend rates are not significantly different.
B)The ANOVA results show that the mean annual dividend rates are significantly different.
C)A confidence interval shows that the mean annual dividend rates are significantly different.
D)The ANOVA results show that the mean annual dividend rates are not significantly different.
Based on the comparison between the mean annual dividend for companies in the utilities and insurance industries,A)A confidence interval shows that the mean annual dividend rates are not significantly different.
B)The ANOVA results show that the mean annual dividend rates are significantly different.
C)A confidence interval shows that the mean annual dividend rates are significantly different.
D)The ANOVA results show that the mean annual dividend rates are not significantly different.
فتح الحزمة
افتح القفل للوصول البطاقات البالغ عددها 94 في هذه المجموعة.
فتح الحزمة
k this deck
64
Two accounting professors decided to compare the variance of their grading procedures.To accomplish this they each graded the same 10 exams with the following results: What is the critical value of F at the 0.05 level of significance?
A)5.85
B)5.35
C)3.18
D)4.03
What is the critical value of F at the 0.05 level of significance?A)5.85
B)5.35
C)3.18
D)4.03
فتح الحزمة
افتح القفل للوصول البطاقات البالغ عددها 94 في هذه المجموعة.
فتح الحزمة
k this deck
65
A random sample of 16 companies was selected and asked for their annual dividend rate in three different industries: utilities,banking,and insurance.The ANOVA comparing the mean annual dividend rate among three industries rejected the null hypothesis.The Mean Square Error (MSE)was 3.36.The following table summarized the results: When comparing the mean annual dividend for companies in the utilities and insurance industries,the following 95% confidence interval can be constructed:
A)5.78 2.160 * 2.40
B)5.78 2.120 * 2.40
C)5.78 2.160 * 1.11
D)5.78 2.120 * 1.11
When comparing the mean annual dividend for companies in the utilities and insurance industries,the following 95% confidence interval can be constructed:A)5.78 2.160 * 2.40
B)5.78 2.120 * 2.40
C)5.78 2.160 * 1.11
D)5.78 2.120 * 1.11
فتح الحزمة
افتح القفل للوصول البطاقات البالغ عددها 94 في هذه المجموعة.
فتح الحزمة
k this deck
66
The F distribution is a ______________ distribution.
فتح الحزمة
افتح القفل للوصول البطاقات البالغ عددها 94 في هذه المجموعة.
فتح الحزمة
k this deck
67
What are the minimum and maximum of values of an F distribution? _______ and _______
فتح الحزمة
افتح القفل للوصول البطاقات البالغ عددها 94 في هذه المجموعة.
فتح الحزمة
k this deck
68
A random sample of 16 companies was selected and asked for their annual dividend rate in three different industries: utilities,banking,and insurance.The ANOVA comparing the mean annual dividend rate among three industries rejected the null hypothesis.The Mean Square Error (MSE)was 3.36.The following table summarized the results: Based on the comparison between the mean annual dividend rate for companies in the utilities and banking,the 95% confidence interval shows an interval of 1.28 to 6.28 for the difference.This result indicates that
A)There is no significant difference between the two rates.
B)The interval contains a difference of 5.00.
C)The annual dividend rate in the utilities industry is significantly less than the annual dividend rate in banking industry.
D)The annual dividend rate in banking industry is significantly less than the annual dividend rate in utilities industry.
Based on the comparison between the mean annual dividend rate for companies in the utilities and banking,the 95% confidence interval shows an interval of 1.28 to 6.28 for the difference.This result indicates thatA)There is no significant difference between the two rates.
B)The interval contains a difference of 5.00.
C)The annual dividend rate in the utilities industry is significantly less than the annual dividend rate in banking industry.
D)The annual dividend rate in banking industry is significantly less than the annual dividend rate in utilities industry.
فتح الحزمة
افتح القفل للوصول البطاقات البالغ عددها 94 في هذه المجموعة.
فتح الحزمة
k this deck
69
Two accounting professors decided to compare the variance of their grading procedures.To accomplish this they each graded the same 10 exams with the following results: At the 5% level of significance,what is the decision regarding the null hypothesis?
A)Reject the null hypothesis and conclude the variance is different.
B)Fail to reject the null hypothesis and conclude no significant difference in the variance.
C)Reject the null hypothesis and conclude the variance is the same.
D)Fail to reject the null hypothesis and conclude the variance is the same.
At the 5% level of significance,what is the decision regarding the null hypothesis?A)Reject the null hypothesis and conclude the variance is different.
B)Fail to reject the null hypothesis and conclude no significant difference in the variance.
C)Reject the null hypothesis and conclude the variance is the same.
D)Fail to reject the null hypothesis and conclude the variance is the same.
فتح الحزمة
افتح القفل للوصول البطاقات البالغ عددها 94 في هذه المجموعة.
فتح الحزمة
k this deck
70
All values in a F distribution must be ______________.
فتح الحزمة
افتح القفل للوصول البطاقات البالغ عددها 94 في هذه المجموعة.
فتح الحزمة
k this deck
71
A random sample of 30 executives from companies with assets over $1 million was selected and asked for their annual income and level of education.The ANOVA comparing the average income among three levels of education rejected the null hypothesis.The Mean Square Error (MSE)was 243.7.The following table summarized the results: When comparing the mean annual incomes for executives with Undergraduate and Master's Degree or more,the following 95% confidence interval can be constructed:
A)2.0 2.052 * 6.51
B)2.0 3.182 * 6.51
C)2.0 2.052 * 42.46
D)2.0 3.182 * 42.46
When comparing the mean annual incomes for executives with Undergraduate and Master's Degree or more,the following 95% confidence interval can be constructed:A)2.0 2.052 * 6.51
B)2.0 3.182 * 6.51
C)2.0 2.052 * 42.46
D)2.0 3.182 * 42.46
فتح الحزمة
افتح القفل للوصول البطاقات البالغ عددها 94 في هذه المجموعة.
فتح الحزمة
k this deck
72
Two accounting professors decided to compare the variance of their grading procedures.To accomplish this they each graded the same 10 exams with the following results: The calculated F ratio is
A)3.484
B)1.867
C)3.18
D)5.35
The calculated F ratio isA)3.484
B)1.867
C)3.18
D)5.35
فتح الحزمة
افتح القفل للوصول البطاقات البالغ عددها 94 في هذه المجموعة.
فتح الحزمة
k this deck
73
A random sample of 30 executives from companies with assets over $1 million was selected and asked for their annual income and level of education.The ANOVA comparing the average income among three levels of education rejected the null hypothesis.The Mean Square Error (MSE)was 243.7.The following table summarized the results: Based on the comparison between the mean annual incomes for executives with Undergraduate and Master's Degree or more,
A)A confidence interval shows that the mean annual incomes are not significantly different.
B)The ANOVA results show that the mean annual incomes are significantly different.
C)A confidence interval shows that the mean annual incomes are significantly different.
D)The ANOVA results show that the mean annual incomes are not significantly different.
Based on the comparison between the mean annual incomes for executives with Undergraduate and Master's Degree or more,A)A confidence interval shows that the mean annual incomes are not significantly different.
B)The ANOVA results show that the mean annual incomes are significantly different.
C)A confidence interval shows that the mean annual incomes are significantly different.
D)The ANOVA results show that the mean annual incomes are not significantly different.
فتح الحزمة
افتح القفل للوصول البطاقات البالغ عددها 94 في هذه المجموعة.
فتح الحزمة
k this deck
74
A random sample of 40 companies with assets over $10 million was selected and asked for their annual computer technology expense and industry.The ANOVA comparing the average computer technology expense among three industries rejected the null hypothesis.The Mean Square Error (MSE)was 195.The following table summarized the results: When comparing the mean annual computer technology expense for companies in the Education and Tax services industries,the following 95% confidence interval can be constructed:
A)13.5 2.026 * 5.78
B)13.5 2.021 * 5.78
C)13.5 2.026 * 13.96
D)13.5 2.021 * 13.96
When comparing the mean annual computer technology expense for companies in the Education and Tax services industries,the following 95% confidence interval can be constructed:A)13.5 2.026 * 5.78
B)13.5 2.021 * 5.78
C)13.5 2.026 * 13.96
D)13.5 2.021 * 13.96
فتح الحزمة
افتح القفل للوصول البطاقات البالغ عددها 94 في هذه المجموعة.
فتح الحزمة
k this deck
75
Two accounting professors decided to compare the variance of their grading procedures.To accomplish this they each graded the same 10 exams with the following results: At the 1% level of significance,what is the decision?
A)Reject the null hypothesis and conclude the variance is different.
B)Fail to reject the null hypothesis and conclude the variance is different.
C)Reject the null hypothesis and conclude the variance is the same.
D)Fail to reject the null hypothesis and conclude the variance is the same.
At the 1% level of significance,what is the decision?A)Reject the null hypothesis and conclude the variance is different.
B)Fail to reject the null hypothesis and conclude the variance is different.
C)Reject the null hypothesis and conclude the variance is the same.
D)Fail to reject the null hypothesis and conclude the variance is the same.
فتح الحزمة
افتح القفل للوصول البطاقات البالغ عددها 94 في هذه المجموعة.
فتح الحزمة
k this deck
76
What is the shape of the F distribution? ______________________
فتح الحزمة
افتح القفل للوصول البطاقات البالغ عددها 94 في هذه المجموعة.
فتح الحزمة
k this deck
77
A random sample of 40 companies with assets over $10 million was selected and asked for their annual computer technology expense and industry.The ANOVA comparing the average computer technology expense among three industries rejected the null hypothesis.The Mean Square Error (MSE)was 195.The following table summarized the results: Based on the comparison between the mean computer technology expense for companies in the Education and Tax services industries,
A)A confidence interval shows that the mean annual computer technology expenses are not significantly different.
B)The ANOVA results show that the mean annual computer technology expenses are significantly different.
C)A confidence interval shows that the mean annual computer technology expenses are significantly different.
D)The ANOVA results show that the mean annual computer technology expenses are not significantly different.
Based on the comparison between the mean computer technology expense for companies in the Education and Tax services industries,A)A confidence interval shows that the mean annual computer technology expenses are not significantly different.
B)The ANOVA results show that the mean annual computer technology expenses are significantly different.
C)A confidence interval shows that the mean annual computer technology expenses are significantly different.
D)The ANOVA results show that the mean annual computer technology expenses are not significantly different.
فتح الحزمة
افتح القفل للوصول البطاقات البالغ عددها 94 في هذه المجموعة.
فتح الحزمة
k this deck
78
What test statistic is used to compare two variances? ________________
فتح الحزمة
افتح القفل للوصول البطاقات البالغ عددها 94 في هذه المجموعة.
فتح الحزمة
k this deck
79
The F-distribution is useful when testing a requirement of two-sample tests of hypothesis.What is the assumption? ________________
فتح الحزمة
افتح القفل للوصول البطاقات البالغ عددها 94 في هذه المجموعة.
فتح الحزمة
k this deck
80
ANOVA requires that the populations should be _______,_______,and ______.
فتح الحزمة
افتح القفل للوصول البطاقات البالغ عددها 94 في هذه المجموعة.
فتح الحزمة
k this deck
فتح الحزمة
افتح القفل للوصول البطاقات البالغ عددها 94 في هذه المجموعة.


