Deck 5: Cost Behavior and Estimation
ملء الشاشة (f)
سؤال
سؤال
سؤال
سؤال
سؤال
سؤال
سؤال
سؤال
سؤال
سؤال
سؤال
سؤال
سؤال
سؤال
سؤال
سؤال
سؤال
سؤال
سؤال
سؤال
سؤال
سؤال
سؤال
سؤال
سؤال
سؤال
سؤال
سؤال
سؤال
سؤال
سؤال
The per-unit amount of three different production costs for Thunderbird, Inc., are as follows: 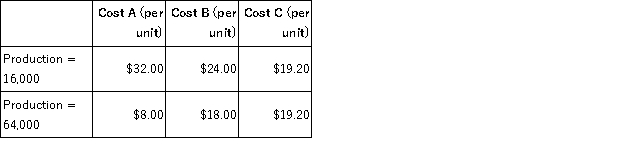 What type of cost is each?
A) Cost A is fixed, Cost B is mixed, Cost C is variable.
B) Cost A is fixed, Cost B is variable, Cost C is mixed.
C) Cost A is variable, Cost B is mixed, Cost C is fixed.
D) Cost A is variable, Cost B is fixed, Cost C is mixeD.
A variable cost stays the same per unit but increases in total when production increases, a fixed cost decreases per unit but stays the same in total when production increases, and a mixed cost decreases per unit and increases in total when production increases.
What type of cost is each?A) Cost A is fixed, Cost B is mixed, Cost C is variable.
B) Cost A is fixed, Cost B is variable, Cost C is mixed.
C) Cost A is variable, Cost B is mixed, Cost C is fixed.
D) Cost A is variable, Cost B is fixed, Cost C is mixeD.
A variable cost stays the same per unit but increases in total when production increases, a fixed cost decreases per unit but stays the same in total when production increases, and a mixed cost decreases per unit and increases in total when production increases.
سؤال
سؤال
سؤال
سؤال
سؤال
سؤال
سؤال
Onini, Inc. produces one product with two production levels: 20,000 units and 80,000 units. At each production level, Onini's per-unit costs for Costs A, B, and C are: 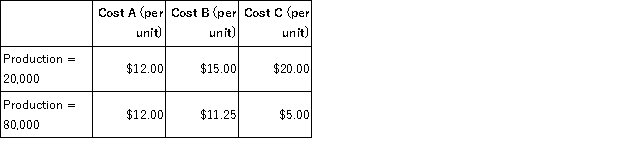 What type of cost is each?
A) Cost A is fixed, Cost B is mixed, and Cost C is variable.
B) Cost A is fixed, Cost B is variable, and Cost C is mixed.
C) Cost A is variable, Cost B is mixed, and Cost C is fixed.
D) Cost A is variable, Cost B is fixed, and Cost C is mixeD.
A variable cost stays the same per unit but increases in total when production increases, a fixed cost decreases per unit but stays the same in total when production increases, and a mixed cost decreases per unit and increases in total when production increases.
What type of cost is each?A) Cost A is fixed, Cost B is mixed, and Cost C is variable.
B) Cost A is fixed, Cost B is variable, and Cost C is mixed.
C) Cost A is variable, Cost B is mixed, and Cost C is fixed.
D) Cost A is variable, Cost B is fixed, and Cost C is mixeD.
A variable cost stays the same per unit but increases in total when production increases, a fixed cost decreases per unit but stays the same in total when production increases, and a mixed cost decreases per unit and increases in total when production increases.
سؤال
سؤال
سؤال
سؤال
سؤال
سؤال
سؤال
سؤال
سؤال
سؤال
سؤال
سؤال
سؤال
سؤال
سؤال
سؤال
سؤال
سؤال
سؤال
سؤال
سؤال
سؤال
سؤال
سؤال
سؤال
سؤال
سؤال
سؤال
Star, Inc. used Excel to run a least-squares regression analysis, which resulted in the following output: 
 What is Star's variable cost per unit?
A) $0.92
B) $2.84
C) $11.57
D) $12.55
What is Star's variable cost per unit?A) $0.92
B) $2.84
C) $11.57
D) $12.55
سؤال
سؤال
سؤال
سؤال
سؤال
سؤال
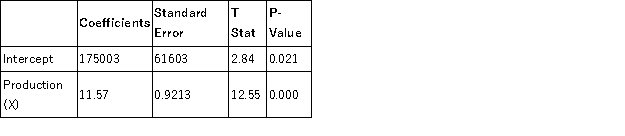
Star, Inc. used Excel to run a least-squares regression analysis, which resulted in the following output: 
 What is Star's formula for estimating costs?
A) Total cost = $175,003 + ($11.57 × Production)
B) Total cost = $61,603 + ($0.92 × Production)
C) Total cost = $175,003 + ($61,603 × Production)
D) Total cost = $11.57 + ($0.9213 × Production)
What is Star's formula for estimating costs?A) Total cost = $175,003 + ($11.57 × Production)
B) Total cost = $61,603 + ($0.92 × Production)
C) Total cost = $175,003 + ($61,603 × Production)
D) Total cost = $11.57 + ($0.9213 × Production)
سؤال
سؤال
سؤال
سؤال
سؤال
Star, Inc. used Excel to run a least-squares regression analysis, which resulted in the following output: 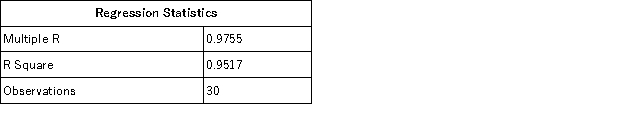
 What total cost would Star predict for a month in which production is 2,000 units?
A) $23,140
B) $63,446
C) $175,003
D) $198,143
What total cost would Star predict for a month in which production is 2,000 units?A) $23,140
B) $63,446
C) $175,003
D) $198,143
سؤال
Star, Inc. used Excel to run a least-squares regression analysis, which resulted in the following output: 
 What is Star's total fixed cost?
A) $61,603
B) $92,130
C) $175,003
D) $236,606
What is Star's total fixed cost?A) $61,603
B) $92,130
C) $175,003
D) $236,606
سؤال
سؤال

فتح الحزمة
قم بالتسجيل لفتح البطاقات في هذه المجموعة!
Unlock Deck
Unlock Deck
1/127
العب
ملء الشاشة (f)
Deck 5: Cost Behavior and Estimation
1
Variable costing uses a contribution margin income statement
True
2
Contribution margin is defined as sales revenue less variable costs
True
3
The contribution margin income statement is appropriate for external users
False
4
The relevant range is:
A) the range in which costs remain variable.
B) the range of activity over which we expect our assumptions about cost behavior to hold true.
C) the range of activity based on the volume-based cost driver.
D) the range in which costs remain fixeD.
The relevant range is the range of activity over which we expect our assumptions about cost behavior to hold true.
فتح الحزمة
افتح القفل للوصول البطاقات البالغ عددها 127 في هذه المجموعة.
فتح الحزمة
k this deck
5
R-square tells managers how much of the variability in activity is caused by variability in cost
فتح الحزمة
افتح القفل للوصول البطاقات البالغ عددها 127 في هذه المجموعة.
فتح الحزمة
k this deck
6
The contribution margin ratio is calculated as total contribution margin divided by total sales revenue
فتح الحزمة
افتح القفل للوصول البطاقات البالغ عددها 127 في هذه المجموعة.
فتح الحزمة
k this deck
7
A scattergraph is useful in recognizing unusual patterns in the cost data
فتح الحزمة
افتح القفل للوصول البطاقات البالغ عددها 127 في هذه المجموعة.
فتح الحزمة
k this deck
8
Cost behavior is:
A) the way in which costs change when the activity level changes.
B) the difference between sales revenue and fixed costs.
C) the same as absorption costing.
D) the amount of sales necessary to achieve a specific profit.
A) the way in which costs change when the activity level changes.
B) the difference between sales revenue and fixed costs.
C) the same as absorption costing.
D) the amount of sales necessary to achieve a specific profit.
فتح الحزمة
افتح القفل للوصول البطاقات البالغ عددها 127 في هذه المجموعة.
فتح الحزمة
k this deck
9
The high-low method requires three observations of costs to calculate the cost formula
فتح الحزمة
افتح القفل للوصول البطاقات البالغ عددها 127 في هذه المجموعة.
فتح الحزمة
k this deck
10
Which of the following statements is correct about relevant range?
A) The relevant range only applies to fixed costs in the context of "step costs."
B) The relevant range determines production levels for the company.
C) The relevant range helps managers make decisions based on normal operations, but the relevant range is not prescriptive beyond the range.
D) The relevant range is useful for operations managers, but not necessarily for cost managers within a production facility.
فتح الحزمة
افتح القفل للوصول البطاقات البالغ عددها 127 في هذه المجموعة.
فتح الحزمة
k this deck
11
Contribution margin plus variable cost per unit equals total sales revenue
فتح الحزمة
افتح القفل للوصول البطاقات البالغ عددها 127 في هذه المجموعة.
فتح الحزمة
k this deck
12
A fixed cost will stay constant on a per unit basis as the volume increases
فتح الحزمة
افتح القفل للوصول البطاقات البالغ عددها 127 في هذه المجموعة.
فتح الحزمة
k this deck
13
Full absorption costing divides fixed overhead between Cost of Goods Sold and period expenses
فتح الحزمة
افتح القفل للوصول البطاقات البالغ عددها 127 في هذه المجموعة.
فتح الحزمة
k this deck
14
Firms may choose to use absorption costing or variable costing for external financial reporting purposes
فتح الحزمة
افتح القفل للوصول البطاقات البالغ عددها 127 في هذه المجموعة.
فتح الحزمة
k this deck
15
A cost driver:
A) is the same as a fixed cost.
B) is an activity that causes total costs to change.
C) is the same as margin of safety.
D) is a method of calculating mixed costs.
A) is the same as a fixed cost.
B) is an activity that causes total costs to change.
C) is the same as margin of safety.
D) is a method of calculating mixed costs.
فتح الحزمة
افتح القفل للوصول البطاقات البالغ عددها 127 في هذه المجموعة.
فتح الحزمة
k this deck
16
The least-squares regression method uses all of the available data to find the best fitting line
فتح الحزمة
افتح القفل للوصول البطاقات البالغ عددها 127 في هذه المجموعة.
فتح الحزمة
k this deck
17
Step costs are fixed over some range of activity and then increase like a variable cost
فتح الحزمة
افتح القفل للوصول البطاقات البالغ عددها 127 في هذه المجموعة.
فتح الحزمة
k this deck
18
The unit contribution margin tells how much each additional unit sold will contribute to covering variable costs
فتح الحزمة
افتح القفل للوصول البطاقات البالغ عددها 127 في هذه المجموعة.
فتح الحزمة
k this deck
19
A variable cost increases in total as the volume increases
فتح الحزمة
افتح القفل للوصول البطاقات البالغ عددها 127 في هذه المجموعة.
فتح الحزمة
k this deck
20
A company's normal operating activity is to produce 500 units per month. During its first two months of operations, it produced 100 units per month. Following a great article about the product, product spiked to 1,000 units per month, but the spike only lasted for one month. Which of the following best approximates the company's relevant range?
A) 450 - 510 units
B) 100 - 1,000 units
C) 500 - 1,000 units
D) 100, 500, or 1,000 units
A) 450 - 510 units
B) 100 - 1,000 units
C) 500 - 1,000 units
D) 100, 500, or 1,000 units
فتح الحزمة
افتح القفل للوصول البطاقات البالغ عددها 127 في هذه المجموعة.
فتح الحزمة
k this deck
21
A step cost:
A) is a fixed cost over the relevant range and a variable cost everywhere else.
B) contains both fixed and variable components.
C) increases in direct proportion to changes in activity.
D) is fixed over some range of activity.
A) is a fixed cost over the relevant range and a variable cost everywhere else.
B) contains both fixed and variable components.
C) increases in direct proportion to changes in activity.
D) is fixed over some range of activity.
فتح الحزمة
افتح القفل للوصول البطاقات البالغ عددها 127 في هذه المجموعة.
فتح الحزمة
k this deck
22
The linearity assumption is:
A) the assumption that the relationship between fixed costs and variable costs can be approximated by a straight line.
B) the assumption that the relationship between fixed costs and variable costs can be approximated by a curved line.
C) realistic in all costing situations.
D) the assumption that total cost depends on activity level.
فتح الحزمة
افتح القفل للوصول البطاقات البالغ عددها 127 في هذه المجموعة.
فتح الحزمة
k this deck
23
A mixed cost:
A) is fixed over a wider range of activity than a step cost.
B) is a fixed cost over the relevant range and a variable cost everywhere else.
C) contains both fixed and variable components.
D) always increases on a per unit basis.
A) is fixed over a wider range of activity than a step cost.
B) is a fixed cost over the relevant range and a variable cost everywhere else.
C) contains both fixed and variable components.
D) always increases on a per unit basis.
فتح الحزمة
افتح القفل للوصول البطاقات البالغ عددها 127 في هذه المجموعة.
فتح الحزمة
k this deck
24
A graph of that provides a visual representation of the relationship between total cost and activity level is called a:
A) relevant range.
B) scattergraph.
C) contribution margin graph.
D) dependent variable.
A) relevant range.
B) scattergraph.
C) contribution margin graph.
D) dependent variable.
فتح الحزمة
افتح القفل للوصول البطاقات البالغ عددها 127 في هذه المجموعة.
فتح الحزمة
k this deck
25
All else being equal, if sales revenue doubles, variable costs will:
A) decrease in total.
B) increase in total.
C) decrease on a per unit basis.
D) increase on a per unit basis.
A) decrease in total.
B) increase in total.
C) decrease on a per unit basis.
D) increase on a per unit basis.
فتح الحزمة
افتح القفل للوصول البطاقات البالغ عددها 127 في هذه المجموعة.
فتح الحزمة
k this deck
26
Which of the following is a mixed cost?
A) A cost that is $32.00 per unit when production is 80,000, and $32.00 per unit when production is 128,000.
B) A cost that is $32.00 per unit when production is 80,000, and $40.00 per unit when production is 128,000.
C) A cost that is $32.00 per unit when production is 80,000, and $26.00 per unit when production is 128,000.
D) A cost that is $64.00 per unit when production is 80,000, and $64.00 per unit when production is 128,000.
فتح الحزمة
افتح القفل للوصول البطاقات البالغ عددها 127 في هذه المجموعة.
فتح الحزمة
k this deck
27
All else being equal, if sales revenue doubles, fixed costs will:
A) decrease in total.
B) increase in total.
C) decrease on a per unit basis.
D) increase on a per unit basis.
A) decrease in total.
B) increase in total.
C) decrease on a per unit basis.
D) increase on a per unit basis.
فتح الحزمة
افتح القفل للوصول البطاقات البالغ عددها 127 في هذه المجموعة.
فتح الحزمة
k this deck
28
Which of the following is the correct equation for total mixed costs under the linearity assumption?
A) Total Fixed Costs + (Variable Cost per Unit × Units of Activity)
B) Total Variable Costs + (Fixed Cost per Unit × Units of Activity)
C) (Total Fixed Costs × Units of Activity) + Total Variable Costs
D) (Total Fixed Costs × Units of Activity) + (Total Variable Costs × Units of Activity)
A) Total Fixed Costs + (Variable Cost per Unit × Units of Activity)
B) Total Variable Costs + (Fixed Cost per Unit × Units of Activity)
C) (Total Fixed Costs × Units of Activity) + Total Variable Costs
D) (Total Fixed Costs × Units of Activity) + (Total Variable Costs × Units of Activity)
فتح الحزمة
افتح القفل للوصول البطاقات البالغ عددها 127 في هذه المجموعة.
فتح الحزمة
k this deck
29
A mixed cost has:
A) either fixed or variable cost components, but not both.
B) only variable cost components, both within and outside of the relevant range.
C) only fixed cost components, both within and outside of the relevant range.
D) both fixed and variable cost components.
A) either fixed or variable cost components, but not both.
B) only variable cost components, both within and outside of the relevant range.
C) only fixed cost components, both within and outside of the relevant range.
D) both fixed and variable cost components.
فتح الحزمة
افتح القفل للوصول البطاقات البالغ عددها 127 في هذه المجموعة.
فتح الحزمة
k this deck
30
A cost that remains the same, in total, regardless of changes in activity level is a:
A) variable cost.
B) fixed cost.
C) mixed cost.
D) step cost.
A) variable cost.
B) fixed cost.
C) mixed cost.
D) step cost.
فتح الحزمة
افتح القفل للوصول البطاقات البالغ عددها 127 في هذه المجموعة.
فتح الحزمة
k this deck
31
The per-unit amount of three different production costs for Thunderbird, Inc., are as follows: What type of cost is each?
A) Cost A is fixed, Cost B is mixed, Cost C is variable.
B) Cost A is fixed, Cost B is variable, Cost C is mixed.
C) Cost A is variable, Cost B is mixed, Cost C is fixed.
D) Cost A is variable, Cost B is fixed, Cost C is mixeD.
A variable cost stays the same per unit but increases in total when production increases, a fixed cost decreases per unit but stays the same in total when production increases, and a mixed cost decreases per unit and increases in total when production increases.
What type of cost is each?A) Cost A is fixed, Cost B is mixed, Cost C is variable.
B) Cost A is fixed, Cost B is variable, Cost C is mixed.
C) Cost A is variable, Cost B is mixed, Cost C is fixed.
D) Cost A is variable, Cost B is fixed, Cost C is mixeD.
A variable cost stays the same per unit but increases in total when production increases, a fixed cost decreases per unit but stays the same in total when production increases, and a mixed cost decreases per unit and increases in total when production increases.
فتح الحزمة
افتح القفل للوصول البطاقات البالغ عددها 127 في هذه المجموعة.
فتح الحزمة
k this deck
32
Which of the following is a variable cost?
A) A cost that is $26,000 when production is 65,000, and $26,000 when production is 91,000.
B) A cost that is $26,000 when production is 65,000, and $36,400 when production is 91,000.
C) A cost that is $26,000 when production is 65,000, and $52,000 when production is 91,000.
D) A cost that is $52,000 when production is 65,000, and $52,000 when production is 91,000.
فتح الحزمة
افتح القفل للوصول البطاقات البالغ عددها 127 في هذه المجموعة.
فتح الحزمة
k this deck
33
Which of the following is a fixed cost?
A) A cost that is $28.00 per unit when production is 70,000, and $28.00 per unit when production is 112,000.
B) A cost that is $28.00 per unit when production is 70,000, and $17.50 per unit when production is 112,000.
C) A cost that is $28.00 per unit when production is 70,000, and $56.00 per unit when production is 112,000.
D) A cost that is $56.00 per unit when production is 70,000, and $56.00 per unit when production is 112,000.
فتح الحزمة
افتح القفل للوصول البطاقات البالغ عددها 127 في هذه المجموعة.
فتح الحزمة
k this deck
34
When Greenway, Inc. sells 48,000 units, its total fixed cost is $115,200. What is its total fixed cost when it sells 54,000 units?
A) $100,800
B) $115,200
C) $129,600
D) $134,800
A) $100,800
B) $115,200
C) $129,600
D) $134,800
فتح الحزمة
افتح القفل للوصول البطاقات البالغ عددها 127 في هذه المجموعة.
فتح الحزمة
k this deck
35
Mohave, Inc. produces approximately 4,000 units per month, and it places a quality assurance logo on each of its units. To use this logo, it must pay the quality assurance firm $5,000 per month plus $1 per unit. The cost to Mohave of using the quality assurance logo would be a:
A) fixed cost.
B) mixed cost.
C) variable cost.
D) step cost.
A) fixed cost.
B) mixed cost.
C) variable cost.
D) step cost.
فتح الحزمة
افتح القفل للوصول البطاقات البالغ عددها 127 في هذه المجموعة.
فتح الحزمة
k this deck
36
Which of the following statements is true?
A) Fixed costs are constant on a per unit basis.
B) Variable costs per unit decrease as activity volume increases.
C) Variable costs are constant in total dollars.
D) Fixed costs are constant in total dollars.
A) Fixed costs are constant on a per unit basis.
B) Variable costs per unit decrease as activity volume increases.
C) Variable costs are constant in total dollars.
D) Fixed costs are constant in total dollars.
فتح الحزمة
افتح القفل للوصول البطاقات البالغ عددها 127 في هذه المجموعة.
فتح الحزمة
k this deck
37
When Carter, Inc. sells 48,000 units, its total variable cost is $115,200. What is its total variable cost when it sells 54,000 units?
A) $100,800
B) $115,200
C) $129,600
D) $134,800
A) $100,800
B) $115,200
C) $129,600
D) $134,800
فتح الحزمة
افتح القفل للوصول البطاقات البالغ عددها 127 في هذه المجموعة.
فتح الحزمة
k this deck
38
Onini, Inc. produces one product with two production levels: 20,000 units and 80,000 units. At each production level, Onini's per-unit costs for Costs A, B, and C are: What type of cost is each?
A) Cost A is fixed, Cost B is mixed, and Cost C is variable.
B) Cost A is fixed, Cost B is variable, and Cost C is mixed.
C) Cost A is variable, Cost B is mixed, and Cost C is fixed.
D) Cost A is variable, Cost B is fixed, and Cost C is mixeD.
A variable cost stays the same per unit but increases in total when production increases, a fixed cost decreases per unit but stays the same in total when production increases, and a mixed cost decreases per unit and increases in total when production increases.
What type of cost is each?A) Cost A is fixed, Cost B is mixed, and Cost C is variable.
B) Cost A is fixed, Cost B is variable, and Cost C is mixed.
C) Cost A is variable, Cost B is mixed, and Cost C is fixed.
D) Cost A is variable, Cost B is fixed, and Cost C is mixeD.
A variable cost stays the same per unit but increases in total when production increases, a fixed cost decreases per unit but stays the same in total when production increases, and a mixed cost decreases per unit and increases in total when production increases.
فتح الحزمة
افتح القفل للوصول البطاقات البالغ عددها 127 في هذه المجموعة.
فتح الحزمة
k this deck
39
Stella, Inc. must perform maintenance on its production machinery after every 10,000 units produced. Production varies between 12,000 and 30,000 units a year. The cost of this maintenance would be classified as a
A) variable cost.
B) fixed cost.
C) step cost.
D) mixed cost.
A) variable cost.
B) fixed cost.
C) step cost.
D) mixed cost.
فتح الحزمة
افتح القفل للوصول البطاقات البالغ عددها 127 في هذه المجموعة.
فتح الحزمة
k this deck
40
A cost that changes, in total, in direct proportion to changes in activity levels is a(n):
A) absorption cost.
B) contribution margin.
C) fixed cost.
D) variable cost.
A) absorption cost.
B) contribution margin.
C) fixed cost.
D) variable cost.
فتح الحزمة
افتح القفل للوصول البطاقات البالغ عددها 127 في هذه المجموعة.
فتح الحزمة
k this deck
41
If a scattergraph contains points that do not fall in a perfect line:
A) the relationship between the variables is not good enough to warrant fitting a line to the data.
B) this is an indication that there is no relationship whatsoever between the variables.
C) the visual fit method and high-low methods should not be used, but least-squares regression can be used.
D) a straight line can still be used to approximate the relationship if a general linear trend can be discerneD.
A straight line may still be used to approximate the relationship if a general linear trend is discerneD.
The relationship need not be perfect to approximate a relationship, as long as there is a general linear trenD.
فتح الحزمة
افتح القفل للوصول البطاقات البالغ عددها 127 في هذه المجموعة.
فتح الحزمة
k this deck
42
Sparrow, Inc. used the high-low method to estimate that its fixed costs are $105,000. At its low level of activity, 50,000 units, average cost was $2.60 per unit. What would Sparrow predict as its variable cost per unit?
A) $0.50
B) $1.55
C) $2.10
D) $2.60
A) $0.50
B) $1.55
C) $2.10
D) $2.60
فتح الحزمة
افتح القفل للوصول البطاقات البالغ عددها 127 في هذه المجموعة.
فتح الحزمة
k this deck
43
Cypress, which uses the high-low method, had an average cost per unit of $5 at its lowest level of activity when sales equaled 10,000 units and an average cost per unit of $3.25 at its highest level of activity when sales equaled 24,000 units. Cypress would estimate fixed costs as:
A) $30,000
B) $6.25
C) $1.75
D) $50,000
A) $30,000
B) $6.25
C) $1.75
D) $50,000
فتح الحزمة
افتح القفل للوصول البطاقات البالغ عددها 127 في هذه المجموعة.
فتح الحزمة
k this deck
44
Palm, which uses the high-low method, had an average cost per unit of $50 at its lowest level of activity when sales equaled 1,000 units and an average cost per unit of $32.50 at its highest level of activity when sales equaled 2,000 units. Palm would estimate fixed costs as:
A) $30.00
B) $82.50
C) $17,500
D) $35,000
A) $30.00
B) $82.50
C) $17,500
D) $35,000
فتح الحزمة
افتح القفل للوصول البطاقات البالغ عددها 127 في هذه المجموعة.
فتح الحزمة
k this deck
45
The y-intercept of the cost line on a scattergraph represents:
A) fixed cost per unit.
B) total fixed cost.
C) variable cost per unit.
D) sales price per unit.
A) fixed cost per unit.
B) total fixed cost.
C) variable cost per unit.
D) sales price per unit.
فتح الحزمة
افتح القفل للوصول البطاقات البالغ عددها 127 في هذه المجموعة.
فتح الحزمة
k this deck
46
The cost estimating approach that involves "eye-balling" the closest fitting line to the data is the:
A) scattergraph method.
B) high-low method.
C) visual fit method.
D) regression analysis.
A) scattergraph method.
B) high-low method.
C) visual fit method.
D) regression analysis.
فتح الحزمة
افتح القفل للوصول البطاقات البالغ عددها 127 في هذه المجموعة.
فتح الحزمة
k this deck
47
Ajax uses the high-low method of estimating costs. Ajax had total costs of $50,000 at its lowest level of activity, when 5,000 units were sold. When, at its highest level of activity, sales equaled 12,000 units, total costs were $78,000. Ajax would estimate fixed costs as:
A) $28,000
B) $30,000
C) $64,000
D) $128,000
A) $28,000
B) $30,000
C) $64,000
D) $128,000
فتح الحزمة
افتح القفل للوصول البطاقات البالغ عددها 127 في هذه المجموعة.
فتح الحزمة
k this deck
48
Meadow uses the high-low method. It had total costs of $500,000 at its lowest level of activity when 5,000 units were sold. When, at its highest level of activity, sales equaled 12,000 units, total costs were $780,000. Meadow would estimate fixed costs as:
A) $280,000
B) $300,000
C) $640,000
D) $1,200,000
A) $280,000
B) $300,000
C) $640,000
D) $1,200,000
فتح الحزمة
افتح القفل للوصول البطاقات البالغ عددها 127 في هذه المجموعة.
فتح الحزمة
k this deck
49
Lark, which uses the high-low method, had total costs of $25,000 at its lowest level of activity when 5,000 units were sold. When, at its highest level of activity, sales equaled 12,000 units, total costs were $39,000. Lark would estimate fixed costs as:
A) $14,000
B) $15,000
C) $32,000
D) $60,000
A) $14,000
B) $15,000
C) $32,000
D) $60,000
فتح الحزمة
افتح القفل للوصول البطاقات البالغ عددها 127 في هذه المجموعة.
فتح الحزمة
k this deck
50
Carson, which uses the high-low method, reported total costs of $24 per unit at its lowest activity level, when production equaled 10,000 units. When production doubled, at its highest activity level, the total cost per unit dropped to $15. Carson would estimate variable cost per unit as:
A) $9.00
B) $6.00
C) $11.00
D) ($9.00)
A) $9.00
B) $6.00
C) $11.00
D) ($9.00)
فتح الحزمة
افتح القفل للوصول البطاقات البالغ عددها 127 في هذه المجموعة.
فتح الحزمة
k this deck
51
The cost estimating approach that uses the two most extreme activity observations is the:
A) scattergraph method.
B) high-low method.
C) visual fit method.
D) regression analysis.
A) scattergraph method.
B) high-low method.
C) visual fit method.
D) regression analysis.
فتح الحزمة
افتح القفل للوصول البطاقات البالغ عددها 127 في هذه المجموعة.
فتح الحزمة
k this deck
52
A scattergraph is a graph with:
A) total cost plotted on the vertical axis and activity on the horizontal axis.
B) activity plotted on the vertical axis and contribution margin on the horizontal axis.
C) contribution margin plotted on the vertical axis and sales revenues on the horizontal axis.
D) the vertical axis measured in units and the horizontal axis measured in dollars.
فتح الحزمة
افتح القفل للوصول البطاقات البالغ عددها 127 في هذه المجموعة.
فتح الحزمة
k this deck
53
The high-low method provides a reasonable estimate of the fixed and variable costs as long as:
A) it uses eight or more points (instead of simply two).
B) at least one of the two points falls within the relevant range.
C) the high and low points for both activity and total fixed costs are the same.
D) the high and low points reflect the general trend of the data.
A) it uses eight or more points (instead of simply two).
B) at least one of the two points falls within the relevant range.
C) the high and low points for both activity and total fixed costs are the same.
D) the high and low points reflect the general trend of the data.
فتح الحزمة
افتح القفل للوصول البطاقات البالغ عددها 127 في هذه المجموعة.
فتح الحزمة
k this deck
54
Elm uses the high-low method of estimating costs. Elm had total costs of $250,000 at its lowest level of activity, when 5,000 units were sold. When, at its highest level of activity, sales equaled 10,000 units, total costs were $390,000. Elm would estimate variable cost per unit as:
A) $70.00
B) $45.50
C) $28.00
D) $52.71
A) $70.00
B) $45.50
C) $28.00
D) $52.71
فتح الحزمة
افتح القفل للوصول البطاقات البالغ عددها 127 في هذه المجموعة.
فتح الحزمة
k this deck
55
The slope of the cost line on a scattergraph represents:
A) fixed cost per unit.
B) total fixed cost.
C) variable cost per unit.
D) sales price per unit.
A) fixed cost per unit.
B) total fixed cost.
C) variable cost per unit.
D) sales price per unit.
فتح الحزمة
افتح القفل للوصول البطاقات البالغ عددها 127 في هذه المجموعة.
فتح الحزمة
k this deck
56
The high-low method is a cost estimating approach that uses _______________ to find the cost line.
A) only two data points
B) all available data points
C) only four data points
D) personal intuition
A) only two data points
B) all available data points
C) only four data points
D) personal intuition
فتح الحزمة
افتح القفل للوصول البطاقات البالغ عددها 127 في هذه المجموعة.
فتح الحزمة
k this deck
57
Which of the following is true about the visual fit method?
A) The visual fit method is the most objective way to fit a line to cost data using a scattergraph.
B) Although a scattergraph can be created by hand, the visual fit method of determining total fixed costs and variable costs per unit must be completed by computer.
C) Assuming the relationship between total cost and activity is (mostly) linear the visual fit method is an approximation of total fixed costs and variable costs per unit.
D) If the scattergraph shows there is not a linear relationship between total costs and activity, the visual fit method can give a close approximation of total fixed costs and variable costs per unit.
فتح الحزمة
افتح القفل للوصول البطاقات البالغ عددها 127 في هذه المجموعة.
فتح الحزمة
k this deck
58
Georgia uses the high-low method of estimating costs. Georgia had total costs of $50,000 at its lowest level of activity, when 5,000 units were sold. When, at its highest level of activity, sales equaled 10,000 units, total costs were $78,000. Georgia would estimate variable cost per unit as:
A) $14.00
B) $9.10
C) $5.60
D) $10.54
A) $14.00
B) $9.10
C) $5.60
D) $10.54
فتح الحزمة
افتح القفل للوصول البطاقات البالغ عددها 127 في هذه المجموعة.
فتح الحزمة
k this deck
59
Holly Co. uses the high-low method. It had an average cost per unit of $10 at its lowest level of activity when sales equaled 10,000 units and an average cost per unit of $6.50 at its highest level of activity when sales equaled 20,000 units. Holly would estimate fixed costs as:
A) $70,000
B) $16.50
C) $8.25
D) $100,000
A) $70,000
B) $16.50
C) $8.25
D) $100,000
فتح الحزمة
افتح القفل للوصول البطاقات البالغ عددها 127 في هذه المجموعة.
فتح الحزمة
k this deck
60
Cardinal uses the high-low method of estimating costs. Cardinal had total costs of $25,000 at its lowest level of activity, when 5,000 units were sold. When, at its highest level of activity, sales equaled 10,000 units, total costs were $39,000. Cardinal would estimate variable cost per unit as:
A) $7.00
B) $4.55
C) $2.80
D) $5.26
A) $7.00
B) $4.55
C) $2.80
D) $5.26
فتح الحزمة
افتح القفل للوصول البطاقات البالغ عددها 127 في هذه المجموعة.
فتح الحزمة
k this deck
61
Total contribution margin is equal to:
A) total sales less fixed costs.
B) fixed costs plus net operating income.
C) variable costs plus net operating income.
D) total sales less net operating income.
A) total sales less fixed costs.
B) fixed costs plus net operating income.
C) variable costs plus net operating income.
D) total sales less net operating income.
فتح الحزمة
افتح القفل للوصول البطاقات البالغ عددها 127 في هذه المجموعة.
فتح الحزمة
k this deck
62
Fremont, which uses the high-low method, reported total costs of $10 per unit at its lowest production level, 5,000 units. When production tripled to its highest level, the total cost per unit dropped to $5. Fremont would estimate its total fixed cost as:
A) $5
B) $15
C) 50,000
D) $37,500
A) $5
B) $15
C) 50,000
D) $37,500
فتح الحزمة
افتح القفل للوصول البطاقات البالغ عددها 127 في هذه المجموعة.
فتح الحزمة
k this deck
63
Citrus, Inc. used the high-low method to estimate that its fixed costs are $210,000. At its low level of activity, 100,000 units, average cost was $2.60 per unit. What would Citrus predict its average cost per unit to be when production is 200,000 units?
A) $1.05
B) $1.55
C) $2.60
D) $5.20
A) $1.05
B) $1.55
C) $2.60
D) $5.20
فتح الحزمة
افتح القفل للوصول البطاقات البالغ عددها 127 في هذه المجموعة.
فتح الحزمة
k this deck
64
Regression analysis is a cost-estimating approach that uses _______________ to find the cost line.
A) only two data points
B) all available data points
C) only four data points
D) personal intuition
A) only two data points
B) all available data points
C) only four data points
D) personal intuition
فتح الحزمة
افتح القفل للوصول البطاقات البالغ عددها 127 في هذه المجموعة.
فتح الحزمة
k this deck
65
We generally need ___________ data points to get reliable regression results using the least-squares regression method.
A) at least 20
B) six to eight
C) as many as possible
D) only two
A) at least 20
B) six to eight
C) as many as possible
D) only two
فتح الحزمة
افتح القفل للوصول البطاقات البالغ عددها 127 في هذه المجموعة.
فتح الحزمة
k this deck
66
Star, Inc. used Excel to run a least-squares regression analysis, which resulted in the following output: What is Star's variable cost per unit?
A) $0.92
B) $2.84
C) $11.57
D) $12.55
What is Star's variable cost per unit?A) $0.92
B) $2.84
C) $11.57
D) $12.55
فتح الحزمة
افتح القفل للوصول البطاقات البالغ عددها 127 في هذه المجموعة.
فتح الحزمة
k this deck
67
McNeil uses the high-low method of estimating costs. McNeil had total costs of $50,000 at its lowest level of activity, when 5,000 units were sold. When, at its highest level of activity, sales equaled 12,000 units, total costs were $78,000. What would McNeil estimate its total cost to be if sales equaled 8,000 units?
A) $32,000
B) $52,000
C) $62,000
D) $80,000
A) $32,000
B) $52,000
C) $62,000
D) $80,000
فتح الحزمة
افتح القفل للوصول البطاقات البالغ عددها 127 في هذه المجموعة.
فتح الحزمة
k this deck
68
Carson, which uses the high-low method of estimating costs, reported total costs of $24 per unit when production was at its lowest level, at 10,000 units. When production doubled to its highest level, the total cost per unit dropped to $15. Carson would estimate its total fixed cost as:
A) $9
B) $33
C) $180,000
D) $585,000
A) $9
B) $33
C) $180,000
D) $585,000
فتح الحزمة
افتح القفل للوصول البطاقات البالغ عددها 127 في هذه المجموعة.
فتح الحزمة
k this deck
69
Using the results of the least-squares regression analysis, which value estimates total fixed costs?
A) R Square
B) Intercept
C) X Value
D) Multiple R
A) R Square
B) Intercept
C) X Value
D) Multiple R
فتح الحزمة
افتح القفل للوصول البطاقات البالغ عددها 127 في هذه المجموعة.
فتح الحزمة
k this deck
70
Orchid Corp. has a selling price of $15, variable costs of $10 per unit, and fixed costs of $25,000. If Orchid sells 13,000 units, contribution margin will equal:
A) $195,000
B) $145,000
C) $40,000
D) $65,000
A) $195,000
B) $145,000
C) $40,000
D) $65,000
فتح الحزمة
افتح القفل للوصول البطاقات البالغ عددها 127 في هذه المجموعة.
فتح الحزمة
k this deck
71
Winston uses the high-low method. It had an average cost per unit of $10 at its lowest level of activity when sales equaled 10,000 units and an average cost per unit of $6.50 at its highest level of activity when sales equaled 20,000 units. What would Winston estimate its total cost to be if sales equaled 8,000 units?
A) $24,000
B) $52,000
C) $70,000
D) $94,000
A) $24,000
B) $52,000
C) $70,000
D) $94,000
فتح الحزمة
افتح القفل للوصول البطاقات البالغ عددها 127 في هذه المجموعة.
فتح الحزمة
k this deck
72
Star, Inc. used Excel to run a least-squares regression analysis, which resulted in the following output: What is Star's formula for estimating costs?
A) Total cost = $175,003 + ($11.57 × Production)
B) Total cost = $61,603 + ($0.92 × Production)
C) Total cost = $175,003 + ($61,603 × Production)
D) Total cost = $11.57 + ($0.9213 × Production)
What is Star's formula for estimating costs?A) Total cost = $175,003 + ($11.57 × Production)
B) Total cost = $61,603 + ($0.92 × Production)
C) Total cost = $175,003 + ($61,603 × Production)
D) Total cost = $11.57 + ($0.9213 × Production)
فتح الحزمة
افتح القفل للوصول البطاقات البالغ عددها 127 في هذه المجموعة.
فتح الحزمة
k this deck
73
Which of the following is not correct about "R Square" in regression analysis?
A) R Square is a measure of "goodness of fit" of the model.
B) An R Square value of 1.0 indicates a perfect fit of the model.
C) R Square explains how much of the variability in x is explained by y.
D) R Square explains how much of the variability in y is explained by x.
A) R Square is a measure of "goodness of fit" of the model.
B) An R Square value of 1.0 indicates a perfect fit of the model.
C) R Square explains how much of the variability in x is explained by y.
D) R Square explains how much of the variability in y is explained by x.
فتح الحزمة
افتح القفل للوصول البطاقات البالغ عددها 127 في هذه المجموعة.
فتح الحزمة
k this deck
74
A statistical method for finding the best-fitting cost equation to a set of data is the:
A) scattergraph method.
B) high-low method.
C) visual fit method.
D) least-squares regression methoD.
Least-squares regression is the only statistical technique among those listeD.
A) scattergraph method.
B) high-low method.
C) visual fit method.
D) least-squares regression methoD.
Least-squares regression is the only statistical technique among those listeD.
فتح الحزمة
افتح القفل للوصول البطاقات البالغ عددها 127 في هذه المجموعة.
فتح الحزمة
k this deck
75
Fremont, which uses the high-low method, reported total costs of $10 per unit at its lowest production level, 5,000 units. When production tripled to its highest level, the total cost per unit dropped to $5. Fremont would estimate its variable cost per unit as:
A) $2.50
B) $5.00
C) $15.00
D) ($5.00)
A) $2.50
B) $5.00
C) $15.00
D) ($5.00)
فتح الحزمة
افتح القفل للوصول البطاقات البالغ عددها 127 في هذه المجموعة.
فتح الحزمة
k this deck
76
Using the results of the least-squares regression analysis, which value estimates variable cost per unit?
A) R Square
B) Intercept
C) X Value
D) Multiple R
A) R Square
B) Intercept
C) X Value
D) Multiple R
فتح الحزمة
افتح القفل للوصول البطاقات البالغ عددها 127 في هذه المجموعة.
فتح الحزمة
k this deck
77
Star, Inc. used Excel to run a least-squares regression analysis, which resulted in the following output: What total cost would Star predict for a month in which production is 2,000 units?
A) $23,140
B) $63,446
C) $175,003
D) $198,143
What total cost would Star predict for a month in which production is 2,000 units?A) $23,140
B) $63,446
C) $175,003
D) $198,143
فتح الحزمة
افتح القفل للوصول البطاقات البالغ عددها 127 في هذه المجموعة.
فتح الحزمة
k this deck
78
Star, Inc. used Excel to run a least-squares regression analysis, which resulted in the following output: What is Star's total fixed cost?
A) $61,603
B) $92,130
C) $175,003
D) $236,606
What is Star's total fixed cost?A) $61,603
B) $92,130
C) $175,003
D) $236,606
فتح الحزمة
افتح القفل للوصول البطاقات البالغ عددها 127 في هذه المجموعة.
فتح الحزمة
k this deck
79
Which of the following statements is correct about the high-low method?
A) The high-low method is complicated to apply.
B) The high-low method is effective for periods in which activity is particularly high or low.
C) Generally, managers can obtain more accurate information from other methods of cost analysis that use a larger number of data points.
D) Generally, managers use the high-low method because it has no drawbacks or limitations.
فتح الحزمة
افتح القفل للوصول البطاقات البالغ عددها 127 في هذه المجموعة.
فتح الحزمة
k this deck
80
Total contribution margin is defined as:
A) selling price times units sold.
B) cost to produce times units sold.
C) total sales revenues less total variable costs.
D) total variable costs less fixed costs.
A) selling price times units sold.
B) cost to produce times units sold.
C) total sales revenues less total variable costs.
D) total variable costs less fixed costs.
فتح الحزمة
افتح القفل للوصول البطاقات البالغ عددها 127 في هذه المجموعة.
فتح الحزمة
k this deck
فتح الحزمة
افتح القفل للوصول البطاقات البالغ عددها 127 في هذه المجموعة.


