Deck 13: Correlation
ملء الشاشة (f)
سؤال
سؤال
سؤال
سؤال
سؤال
سؤال
سؤال
سؤال
سؤال
سؤال
سؤال
سؤال
سؤال
سؤال
سؤال
سؤال
سؤال
سؤال
سؤال
سؤال
سؤال
سؤال
سؤال
سؤال
سؤال
سؤال
سؤال
سؤال
سؤال
سؤال
سؤال
سؤال
سؤال
سؤال
سؤال
سؤال
سؤال
سؤال
سؤال
سؤال
سؤال
سؤال
سؤال
Which of these statistics best describes the relationship in this scatterplot? 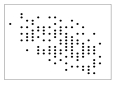
A) r = .00
B) r = .40
C) r = -1.00
D) r = -.50
A) r = .00
B) r = .40
C) r = -1.00
D) r = -.50
سؤال
سؤال
سؤال
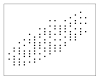
Which of these statistics BEST describes the relationship in this scatterplot? 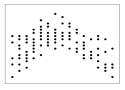
A) r = .00
B) r = .50
C) r = -.50
D) r = 1.00
A) r = .00
B) r = .50
C) r = -.50
D) r = 1.00
سؤال
Which of these statistics BEST describes the relationship in this scatterplot? 
A) r = .00
B) r = .50
C) r = -.50
D) r = 1.00
A) r = .00
B) r = .50
C) r = -.50
D) r = 1.00
سؤال
Which of these statistics BEST describes the relationship in this scatterplot? 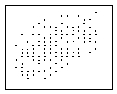
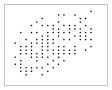
A) r = 1.00
B) r = .40
C) r = -.40
D) r = .00
A) r = 1.00
B) r = .40
C) r = -.40
D) r = .00
سؤال
سؤال
سؤال
Which of these statistics BEST describes the relationship in this scatterplot? 
A) r = .50
B) r = -.50
C) r = -1.00
D) r = .00
A) r = .50
B) r = -.50
C) r = -1.00
D) r = .00
سؤال
سؤال
سؤال
Which of these statistics best describes the relationship in this scatterplot? 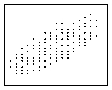
A) r = 1.00
B) r = .65
C) r = -.40
D) r = .00
A) r = 1.00
B) r = .65
C) r = -.40
D) r = .00
سؤال
سؤال
Which of these statistics BEST describes the relationship in this scatterplot? 
A) r = -1.00
B) r = .10
C) r = .50
D) r = -.45
A) r = -1.00
B) r = .10
C) r = .50
D) r = -.45
سؤال
سؤال
Which of these statistics BEST describes the relationship in this scatterplot? 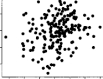
A) r = -1.00
B) r = .05
C) r = -.50
D) r = .45
A) r = -1.00
B) r = .05
C) r = -.50
D) r = .45
سؤال
سؤال
سؤال
سؤال
سؤال
سؤال
سؤال
سؤال
سؤال
سؤال
سؤال
سؤال
سؤال
سؤال
سؤال
سؤال
سؤال
سؤال
سؤال
سؤال
سؤال
سؤال

فتح الحزمة
قم بالتسجيل لفتح البطاقات في هذه المجموعة!
Unlock Deck
Unlock Deck
1/120
العب
ملء الشاشة (f)
Deck 13: Correlation
1
For which of these research situations would you most likely calculate a correlation coefficient?
A) independent variable = blood alcohol level; dependent variable = reaction time
B) independent variable = type of car owned; dependent variable = annual income
C) independent variable = gender; dependent variable = favorite type of music
D) independent variable = city of residence; dependent variable = political affiliation
independent variable = blood alcohol level; dependent variable = reaction time
2
You calculate a correlation coefficient (rather than a t-test for F-ratio) when ______.
A) the independent variable is categorical
B) the independent variable consists of more than two levels/groups
C) the dependent variable is categorical
D) the independent variable is continuous
A) the independent variable is categorical
B) the independent variable consists of more than two levels/groups
C) the dependent variable is categorical
D) the independent variable is continuous
the independent variable is continuous
3
For which of these research situations would you most likely calculate a correlation coefficient?
A) IV = political affiliation; DV = type of automobile owned
B) IV = favorite type of fast food; DV = weight
C) IV = number of children in family; DV = money spent on food per week
D) IV = annual income; DV = gender
A) IV = political affiliation; DV = type of automobile owned
B) IV = favorite type of fast food; DV = weight
C) IV = number of children in family; DV = money spent on food per week
D) IV = annual income; DV = gender
IV = number of children in family; DV = money spent on food per week
4
For which of these research situations would you MOST likely calculate a correlation coefficient?
A) independent variable = type of car owned; dependent variable = money spent on gasoline per week
B) independent variable = age; dependent variable = reaction time in milliseconds
C) independent variable = city of residence; dependent variable = miles driven per week
D) independent variable = college major; dependent variable = type of car owned
فتح الحزمة
افتح القفل للوصول البطاقات البالغ عددها 120 في هذه المجموعة.
فتح الحزمة
k this deck
5
Which of these is NOT one of the three aspects of the relationship between variables discussed in class?
A) direction
B) predictability
C) strength
D) nature
A) direction
B) predictability
C) strength
D) nature
فتح الحزمة
افتح القفل للوصول البطاقات البالغ عددها 120 في هذه المجموعة.
فتح الحزمة
k this deck
6
You would calculate a correlation coefficient (rather than t-test or F-ratio) when the independent variable is ______ (for example, measured at the ______ level of measurement).
A) categorical; ratio
B) categorical; interval
C) continuous; nominal
D) continuous; interval
A) categorical; ratio
B) categorical; interval
C) continuous; nominal
D) continuous; interval
فتح الحزمة
افتح القفل للوصول البطاقات البالغ عددها 120 في هذه المجموعة.
فتح الحزمة
k this deck
7
Which of these is the MAIN reason for creating a scatterplot between two variables?
A) to determine whether the relationship is statistically significant
B) to determine whether you need to collect more data
C) to determine if the relationship is linear
D) to determine the strength (+/-) of the correlation
A) to determine whether the relationship is statistically significant
B) to determine whether you need to collect more data
C) to determine if the relationship is linear
D) to determine the strength (+/-) of the correlation
فتح الحزمة
افتح القفل للوصول البطاقات البالغ عددها 120 في هذه المجموعة.
فتح الحزمة
k this deck
8
You calculate the correlation coefficient between two variables when the ______ is ______.
A) independent variable; categorical
B) number of groups; greater than two
C) dependent variable; categorical
D) independent variable; continuous
A) independent variable; categorical
B) number of groups; greater than two
C) dependent variable; categorical
D) independent variable; continuous
فتح الحزمة
افتح القفل للوصول البطاقات البالغ عددها 120 في هذه المجموعة.
فتح الحزمة
k this deck
9
For which of these reasons would you create a scatterplot between two variables?
A) to see if the group means are the same
B) to see if the variables are categorical or continuous
C) to calculate the degrees of freedom
D) to get a sense of the strength of the relationship
A) to see if the group means are the same
B) to see if the variables are categorical or continuous
C) to calculate the degrees of freedom
D) to get a sense of the strength of the relationship
فتح الحزمة
افتح القفل للوصول البطاقات البالغ عددها 120 في هذه المجموعة.
فتح الحزمة
k this deck
10
You calculate a correlation coefficient (rather than a t-test or F-ratio) when ______.
A) you are interested in comparing group means
B) the independent and dependent variables are both categorical
C) the independent and dependent variables are both continuous
D) the independent variable is categorical and the dependent variables is continuous
A) you are interested in comparing group means
B) the independent and dependent variables are both categorical
C) the independent and dependent variables are both continuous
D) the independent variable is categorical and the dependent variables is continuous
فتح الحزمة
افتح القفل للوصول البطاقات البالغ عددها 120 في هذه المجموعة.
فتح الحزمة
k this deck
11
For which of these research situations would you MOST likely calculate a correlation coefficient?
A) IV = self-esteem; DV = type of automobile owned
B) IV = number of friends; DV = hours a day spent on the Internet
C) IV = favorite type of movie; DV = favorite flavor of ice cream
D) IV = age at marriage; DV = current marital status (single, married, etc.)
A) IV = self-esteem; DV = type of automobile owned
B) IV = number of friends; DV = hours a day spent on the Internet
C) IV = favorite type of movie; DV = favorite flavor of ice cream
D) IV = age at marriage; DV = current marital status (single, married, etc.)
فتح الحزمة
افتح القفل للوصول البطاقات البالغ عددها 120 في هذه المجموعة.
فتح الحزمة
k this deck
12
For which of these research situations would you most likely calculate a correlation coefficient?
A) independent variable = gender; dependent variable = salary
B) independent variable = number of cars owned; dependent variable = money spent on gasoline per week
C) independent variable = city of residence; dependent variable = miles driven per week
D) independent variable = political affiliation; dependent variable = college major
فتح الحزمة
افتح القفل للوصول البطاقات البالغ عددها 120 في هذه المجموعة.
فتح الحزمة
k this deck
13
For which of these reasons would you create a scatterplot between two variables?
A) to see if the relationship is positive or negative
B) to determine the level of significance
C) to get an initial sense of whether or not the means of the groups are different from each other
D) to determine if the relationship is bidirectional
A) to see if the relationship is positive or negative
B) to determine the level of significance
C) to get an initial sense of whether or not the means of the groups are different from each other
D) to determine if the relationship is bidirectional
فتح الحزمة
افتح القفل للوصول البطاقات البالغ عددها 120 في هذه المجموعة.
فتح الحزمة
k this deck
14
You calculate a correlation coefficient (rather than a t-test or F-ratio) when the independent variable is ______ and the dependent variable is ______.
A) categorical; categorical
B) categorical; continuous
C) continuous; categorical
D) continuous; continuous
A) categorical; categorical
B) categorical; continuous
C) continuous; categorical
D) continuous; continuous
فتح الحزمة
افتح القفل للوصول البطاقات البالغ عددها 120 في هذه المجموعة.
فتح الحزمة
k this deck
15
For which of these research situations would you MOST likely calculate a correlation coefficient?
A) IV = city of residence; DV = annual salary
B) IV = ethnicity; DV = political affiliation
C) IV = number of siblings; DV = age at marriage
D) IV = age; DV = type of car owned
A) IV = city of residence; DV = annual salary
B) IV = ethnicity; DV = political affiliation
C) IV = number of siblings; DV = age at marriage
D) IV = age; DV = type of car owned
فتح الحزمة
افتح القفل للوصول البطاقات البالغ عددها 120 في هذه المجموعة.
فتح الحزمة
k this deck
16
For which of these reasons would you create a scatterplot between two variables?
A) to determine whether the relationship is linear
B) to decide if the relationship is statistically significant
C) to prove your research hypotheses
D) to determine if the alternative hypothesis should be one-tailed or two-tailed
A) to determine whether the relationship is linear
B) to decide if the relationship is statistically significant
C) to prove your research hypotheses
D) to determine if the alternative hypothesis should be one-tailed or two-tailed
فتح الحزمة
افتح القفل للوصول البطاقات البالغ عددها 120 في هذه المجموعة.
فتح الحزمة
k this deck
17
For which of these research situations would you most likely calculate a correlation coefficient?
A) independent variable = college major; dependent variable = income
B) independent variable = astrological sign; dependent variable = personality
C) independent variable = age; dependent variable = number of TV sets owned
D) independent variable = area code; dependent variable = money spent on gasoline per week
فتح الحزمة
افتح القفل للوصول البطاقات البالغ عددها 120 في هذه المجموعة.
فتح الحزمة
k this deck
18
For which of these research situations would you MOST likely calculate a correlation coefficient?
A) independent variable = blood type; dependent variable = political affiliation
B) independent variable = height; dependent variable = salary
C) independent variable = ethnicity; dependent variable = favorite food
D) independent variable = gender; dependent variable = type of car owned
A) independent variable = blood type; dependent variable = political affiliation
B) independent variable = height; dependent variable = salary
C) independent variable = ethnicity; dependent variable = favorite food
D) independent variable = gender; dependent variable = type of car owned
فتح الحزمة
افتح القفل للوصول البطاقات البالغ عددها 120 في هذه المجموعة.
فتح الحزمة
k this deck
19
You would calculate a correlation coefficient (rather than t-test or F-ratio) when the independent variable is ______ (measured at the ______ level of measurement).
A) categorical; ordinal
B) continuous; ratio
C) continuous; nominal
D) categorical; interval
A) categorical; ordinal
B) continuous; ratio
C) continuous; nominal
D) categorical; interval
فتح الحزمة
افتح القفل للوصول البطاقات البالغ عددها 120 في هذه المجموعة.
فتح الحزمة
k this deck
20
Which of these is NOT one of the three aspects or dimensions of the relationship between variables discussed in class?
A) strength
B) direction
C) causality
D) nature
A) strength
B) direction
C) causality
D) nature
فتح الحزمة
افتح القفل للوصول البطاقات البالغ عددها 120 في هذه المجموعة.
فتح الحزمة
k this deck
21
Goldilocks decides the porridge that is "just right" is neither too cold nor too hot. The relationship between porridge temperature and Goldilock's preferences may be described as ______.
A) nonlinear
B) zero
C) skewed
D) negative
A) nonlinear
B) zero
C) skewed
D) negative
فتح الحزمة
افتح القفل للوصول البطاقات البالغ عددها 120 في هذه المجموعة.
فتح الحزمة
k this deck
22
You believe the farther you sit from an instructor, the less likely he or she will call on you. This is an example of a ______ relationship.
A) negative
B) positive
C) skewed
D) nonlinear
A) negative
B) positive
C) skewed
D) nonlinear
فتح الحزمة
افتح القفل للوصول البطاقات البالغ عددها 120 في هذه المجموعة.
فتح الحزمة
k this deck
23
The ______ of a Pearson correlation coefficient (r) indicates the ______ of the relationship.
A) value; strength
B) value; direction
C) sign; strength
D) sign; nature (linear or nonlinear)
A) value; strength
B) value; direction
C) sign; strength
D) sign; nature (linear or nonlinear)
فتح الحزمة
افتح القفل للوصول البطاقات البالغ عددها 120 في هذه المجموعة.
فتح الحزمة
k this deck
24
A recent study found that the older the college student, the fewer the number of pages of assigned readings the student reads. The relationship between age of student and amount of reading may be described as ______.
A) curvilinear
B) positive
C) skewed
D) negative
A) curvilinear
B) positive
C) skewed
D) negative
فتح الحزمة
افتح القفل للوصول البطاقات البالغ عددها 120 في هذه المجموعة.
فتح الحزمة
k this deck
25
In examining the relationship between variables, the question "Should I portray the relationship between variables with a line or a curve?" pertains PRIMARILY to the ______ of the relationship.
A) direction
B) nature
C) strength
D) negativity
A) direction
B) nature
C) strength
D) negativity
فتح الحزمة
افتح القفل للوصول البطاقات البالغ عددها 120 في هذه المجموعة.
فتح الحزمة
k this deck
26
You believe that the longer students take to complete their education, the less they enjoy their time in college. This is an example of a ______ relationship.
A) linear
B) nonlinear
C) positive
D) negative
A) linear
B) nonlinear
C) positive
D) negative
فتح الحزمة
افتح القفل للوصول البطاقات البالغ عددها 120 في هذه المجموعة.
فتح الحزمة
k this deck
27
The Pearson correlation coefficient (r) assumes the relationship between two variables is ______.
A) linear
B) significant
C) normal
D) skewed
A) linear
B) significant
C) normal
D) skewed
فتح الحزمة
افتح القفل للوصول البطاقات البالغ عددها 120 في هذه المجموعة.
فتح الحزمة
k this deck
28
You believe faculty members call on students sitting in the middle of their classes more often than students sitting either in the front of the class or the back of the class. This is an example of a ______ relationship.
A) positive
B) negative
C) linear
D) nonlinear
A) positive
B) negative
C) linear
D) nonlinear
فتح الحزمة
افتح القفل للوصول البطاقات البالغ عددها 120 في هذه المجموعة.
فتح الحزمة
k this deck
29
You would look at the ______ of a Pearson correlation coefficient (r) to assess the ______ of the relationship between two variables.
A) sign (+/-); statistical significance
B) value; direction
C) value; strength
D) statistical significance; direction
A) sign (+/-); statistical significance
B) value; direction
C) value; strength
D) statistical significance; direction
فتح الحزمة
افتح القفل للوصول البطاقات البالغ عددها 120 في هذه المجموعة.
فتح الحزمة
k this deck
30
Which of these is NOT one of the three aspects of the relationship between variables discussed in Chapter 12?
A) reciprocity
B) direction
C) strength
D) nature
A) reciprocity
B) direction
C) strength
D) nature
فتح الحزمة
افتح القفل للوصول البطاقات البالغ عددها 120 في هذه المجموعة.
فتح الحزمة
k this deck
31
The ______ of a Pearson correlation (r) assesses the ______ of the relationship between two variables
A) linearity; predictability
B) probability; direction
C) numeric value; strength
D) sign (+/-); strength
A) linearity; predictability
B) probability; direction
C) numeric value; strength
D) sign (+/-); strength
فتح الحزمة
افتح القفل للوصول البطاقات البالغ عددها 120 في هذه المجموعة.
فتح الحزمة
k this deck
32
The ______ of a Pearson correlation coefficient (r) assesses the ______ of the relationship between two variables
A) numeric value; direction
B) level of significance; causality
C) sign (+/-); direction
D) sign (+/-); linearity
A) numeric value; direction
B) level of significance; causality
C) sign (+/-); direction
D) sign (+/-); linearity
فتح الحزمة
افتح القفل للوصول البطاقات البالغ عددها 120 في هذه المجموعة.
فتح الحزمة
k this deck
33
In calculating a Pearson correlation between two variables, you would examine the ______ to determine whether the relationship between the two variables is linear.
A) value of the correlation
B) level of significance of the correlation
C) scatterplot
D) descriptive statistics
A) value of the correlation
B) level of significance of the correlation
C) scatterplot
D) descriptive statistics
فتح الحزمة
افتح القفل للوصول البطاقات البالغ عددها 120 في هذه المجموعة.
فتح الحزمة
k this deck
34
The ______ of a Pearson correlation coefficient (r) indicates the ______ of the relationship.
A) sign (+/-); statistical significance
B) value; direction
C) sign (+/-); direction
D) range; nature (linear or nonlinear)
A) sign (+/-); statistical significance
B) value; direction
C) sign (+/-); direction
D) range; nature (linear or nonlinear)
فتح الحزمة
افتح القفل للوصول البطاقات البالغ عددها 120 في هذه المجموعة.
فتح الحزمة
k this deck
35
You believe students are less attentive in class when they either get too little or too much sleep as opposed to their average amount of sleep. This is an example of a ______ relationship.
A) positive
B) linear
C) negative
D) nonlinear
A) positive
B) linear
C) negative
D) nonlinear
فتح الحزمة
افتح القفل للوصول البطاقات البالغ عددها 120 في هذه المجموعة.
فتح الحزمة
k this deck
36
In examining the relationship between variables, the question "How well can I predict one variable from another?" pertains primarily to the ______ of the relationship.
A) direction
B) nature
C) strength
D) variability
A) direction
B) nature
C) strength
D) variability
فتح الحزمة
افتح القفل للوصول البطاقات البالغ عددها 120 في هذه المجموعة.
فتح الحزمة
k this deck
37
The Pearson correlation coefficient (r) assumes the relationship between two variables ______.
A) is one-tailed (directional)
B) is statistically significant
C) goes on to infinity in both directions
D) may be represented by a straight line
A) is one-tailed (directional)
B) is statistically significant
C) goes on to infinity in both directions
D) may be represented by a straight line
فتح الحزمة
افتح القفل للوصول البطاقات البالغ عددها 120 في هذه المجموعة.
فتح الحزمة
k this deck
38
The Pearson correlation coefficient (r) measures the ______ relationship between two variables.
A) directional
B) positive
C) two-tailed
D) linear
A) directional
B) positive
C) two-tailed
D) linear
فتح الحزمة
افتح القفل للوصول البطاقات البالغ عددها 120 في هذه المجموعة.
فتح الحزمة
k this deck
39
The Yerkes-Dodson law describes the relationship between one's level of arousal and task performance. According to this law, performance is better at a moderate level of arousal than at either a low or high level of arousal. This is an example of a ______ relationship.
A) positive
B) negative
C) linear
D) nonlinear
A) positive
B) negative
C) linear
D) nonlinear
فتح الحزمة
افتح القفل للوصول البطاقات البالغ عددها 120 في هذه المجموعة.
فتح الحزمة
k this deck
40
Which of these is NOT one of the three aspects of the relationship between variables discussed in Chapter 12?
A) inferential
B) direction
C) strength
D) nature
A) inferential
B) direction
C) strength
D) nature
فتح الحزمة
افتح القفل للوصول البطاقات البالغ عددها 120 في هذه المجموعة.
فتح الحزمة
k this deck
41
A recent study found that the more elementary students are involved in after-school activities, the less likely they are to get involved with gangs. Which of the following correlations reflects this relationship?
A) r = 1.00
B) r = .50
C) r = -.40
D) r = .00
A) r = 1.00
B) r = .50
C) r = -.40
D) r = .00
فتح الحزمة
افتح القفل للوصول البطاقات البالغ عددها 120 في هذه المجموعة.
فتح الحزمة
k this deck
42
A survey of Psychology majors finds that the more "real world" experience students gained, the less likely they were to go to graduate school. Which of the following correlations reflects this relationship?
A) r = 1.00
B) r = .50
C) r = -.40
D) r = .00
A) r = 1.00
B) r = .50
C) r = -.40
D) r = .00
فتح الحزمة
افتح القفل للوصول البطاقات البالغ عددها 120 في هذه المجموعة.
فتح الحزمة
k this deck
43
Which of these statistics best describes the relationship in this scatterplot?
A) r = .00
B) r = .40
C) r = -1.00
D) r = -.50
A) r = .00
B) r = .40
C) r = -1.00
D) r = -.50
فتح الحزمة
افتح القفل للوصول البطاقات البالغ عددها 120 في هذه المجموعة.
فتح الحزمة
k this deck
44
A correlation of ______ is BEST represented by ______.
A) .00; an ellipse (football shape)
B) 1.00; an ellipse (football shape)
C) .00; a circle
D) 1.00; a circle
A) .00; an ellipse (football shape)
B) 1.00; an ellipse (football shape)
C) .00; a circle
D) 1.00; a circle
فتح الحزمة
افتح القفل للوصول البطاقات البالغ عددها 120 في هذه المجموعة.
فتح الحزمة
k this deck
45
A recent study found that the more money schools are given to provide after-school activities, the less likely their students are to get involved with illegal activities. Which of the following correlations reflects this relationship?
A) r = .75
B) r = .30
C) r = -.35
D) r = .00
A) r = .75
B) r = .30
C) r = -.35
D) r = .00
فتح الحزمة
افتح القفل للوصول البطاقات البالغ عددها 120 في هذه المجموعة.
فتح الحزمة
k this deck
46
Which of these statistics BEST describes the relationship in this scatterplot?
A) r = .00
B) r = .50
C) r = -.50
D) r = 1.00
A) r = .00
B) r = .50
C) r = -.50
D) r = 1.00
فتح الحزمة
افتح القفل للوصول البطاقات البالغ عددها 120 في هذه المجموعة.
فتح الحزمة
k this deck
47
Which of these statistics BEST describes the relationship in this scatterplot?
A) r = .00
B) r = .50
C) r = -.50
D) r = 1.00
A) r = .00
B) r = .50
C) r = -.50
D) r = 1.00
فتح الحزمة
افتح القفل للوصول البطاقات البالغ عددها 120 في هذه المجموعة.
فتح الحزمة
k this deck
48
Which of these statistics BEST describes the relationship in this scatterplot?
A) r = 1.00
B) r = .40
C) r = -.40
D) r = .00
A) r = 1.00
B) r = .40
C) r = -.40
D) r = .00
فتح الحزمة
افتح القفل للوصول البطاقات البالغ عددها 120 في هذه المجموعة.
فتح الحزمة
k this deck
49
An instructor finds that, in general, the more other instructors use Powerpoint presentations and web sites, the less often students attend class. Which of the following correlations reflects this relationship?
A) r = .50
B) r = -.50
C) r = 1.00
D) r = -1.00
A) r = .50
B) r = -.50
C) r = 1.00
D) r = -1.00
فتح الحزمة
افتح القفل للوصول البطاقات البالغ عددها 120 في هذه المجموعة.
فتح الحزمة
k this deck
50
An instructor finds that, in general, the more time students spend on laptop computers during class, the less often students take notes. Which of the following correlations reflects this relationship?
A) r = .50
B) r = -.50
C) r = 1.00
D) r = -1.00
A) r = .50
B) r = -.50
C) r = 1.00
D) r = -1.00
فتح الحزمة
افتح القفل للوصول البطاقات البالغ عددها 120 في هذه المجموعة.
فتح الحزمة
k this deck
51
Which of these statistics BEST describes the relationship in this scatterplot?
A) r = .50
B) r = -.50
C) r = -1.00
D) r = .00
A) r = .50
B) r = -.50
C) r = -1.00
D) r = .00
فتح الحزمة
افتح القفل للوصول البطاقات البالغ عددها 120 في هذه المجموعة.
فتح الحزمة
k this deck
52
A Pearson correlation of ______ is BEST represented by ______.
A) .50; a line
B) 1.00; a circle
C) .00; a circle
D) -1.00; an ellipse (football shape)
A) .50; a line
B) 1.00; a circle
C) .00; a circle
D) -1.00; an ellipse (football shape)
فتح الحزمة
افتح القفل للوصول البطاقات البالغ عددها 120 في هذه المجموعة.
فتح الحزمة
k this deck
53
An instructor finds she is completely unable to predict student's performance in her class from her initial impression of them. Which of the following correlations BEST reflects the relationship between her impressions and their performance?
A) r = -1.00
B) r = .00
C) r = .40
D) r = -.50
A) r = -1.00
B) r = .00
C) r = .40
D) r = -.50
فتح الحزمة
افتح القفل للوصول البطاقات البالغ عددها 120 في هذه المجموعة.
فتح الحزمة
k this deck
54
Which of these statistics best describes the relationship in this scatterplot?
A) r = 1.00
B) r = .65
C) r = -.40
D) r = .00
A) r = 1.00
B) r = .65
C) r = -.40
D) r = .00
فتح الحزمة
افتح القفل للوصول البطاقات البالغ عددها 120 في هذه المجموعة.
فتح الحزمة
k this deck
55
A Pearson correlation of ______ is BEST represented by ______.
A) .50; an ellipse (football shape)
B) 1.00; a curve
C) .00; a line
D) -1.00; an ellipse (football shape)
A) .50; an ellipse (football shape)
B) 1.00; a curve
C) .00; a line
D) -1.00; an ellipse (football shape)
فتح الحزمة
افتح القفل للوصول البطاقات البالغ عددها 120 في هذه المجموعة.
فتح الحزمة
k this deck
56
Which of these statistics BEST describes the relationship in this scatterplot?
A) r = -1.00
B) r = .10
C) r = .50
D) r = -.45
A) r = -1.00
B) r = .10
C) r = .50
D) r = -.45
فتح الحزمة
افتح القفل للوصول البطاقات البالغ عددها 120 في هذه المجموعة.
فتح الحزمة
k this deck
57
An instructor finds the more often students ask for help in office hour visits, the greater the improvement in their performance across the semester. Which of the following correlations BEST reflects this relationship between asking for help and course performance?
A) r = -1.00
B) r = .05
C) r = -.50
D) r = .45
A) r = -1.00
B) r = .05
C) r = -.50
D) r = .45
فتح الحزمة
افتح القفل للوصول البطاقات البالغ عددها 120 في هذه المجموعة.
فتح الحزمة
k this deck
58
Which of these statistics BEST describes the relationship in this scatterplot?
A) r = -1.00
B) r = .05
C) r = -.50
D) r = .45
A) r = -1.00
B) r = .05
C) r = -.50
D) r = .45
فتح الحزمة
افتح القفل للوصول البطاقات البالغ عددها 120 في هذه المجموعة.
فتح الحزمة
k this deck
59
A correlation of ______ is BEST represented by ______.
A) .00; an ellipse (football-shape)
B) 1.00; a circle
C) .00; a line
D) 1.00; a line
A) .00; an ellipse (football-shape)
B) 1.00; a circle
C) .00; a line
D) 1.00; a line
فتح الحزمة
افتح القفل للوصول البطاقات البالغ عددها 120 في هذه المجموعة.
فتح الحزمة
k this deck
60
A researcher finds that the more hours students spend studying, the fewer mistakes they make on their assignments. Which of these statistics BEST describes this relationship?
A) r = 1.00
B) r = .50
C) r = -.50
D) r = .00
A) r = 1.00
B) r = .50
C) r = -.50
D) r = .00
فتح الحزمة
افتح القفل للوصول البطاقات البالغ عددها 120 في هذه المجموعة.
فتح الحزمة
k this deck
61
Which of the following statements BEST illustrates the concept of covariance?
A) "The two sample mean are significantly different from each other."
B) "The decision was made to not reject the null hypothesis."
C) "People with above-average incomes own more TVs than the average consumer."
D) "There is no relationship between money and happiness."
A) "The two sample mean are significantly different from each other."
B) "The decision was made to not reject the null hypothesis."
C) "People with above-average incomes own more TVs than the average consumer."
D) "There is no relationship between money and happiness."
فتح الحزمة
افتح القفل للوصول البطاقات البالغ عددها 120 في هذه المجموعة.
فتح الحزمة
k this deck
62
A researcher hypothesizes a positive relationship between drivers' use of cell phones and road rage incidents. How should the null hypothesis (H0) be stated?
A) H0: all μs are equal
B) H0: ρ = 0
C) H0: Cell phone = Road rage
D) H0: = 0
A) H0: all μs are equal
B) H0: ρ = 0
C) H0: Cell phone = Road rage
D) H0: = 0
فتح الحزمة
افتح القفل للوصول البطاقات البالغ عددها 120 في هذه المجموعة.
فتح الحزمة
k this deck
63
Gavin calculates a value of -.10 for a Pearson correlation. You would BEST describe this relationship as ______.
A) weak positive
B) weak negative
C) strong positive
D) strong negative
A) weak positive
B) weak negative
C) strong positive
D) strong negative
فتح الحزمة
افتح القفل للوصول البطاقات البالغ عددها 120 في هذه المجموعة.
فتح الحزمة
k this deck
64
In calculating the Pearson correlation (r), the ______ hypothesis implies ______.
A) null; the relationship is not linear
B) alternative; the two population means are not equal
C) null; the means are all equal to each other
D) alternative; there is a relationship
A) null; the relationship is not linear
B) alternative; the two population means are not equal
C) null; the means are all equal to each other
D) alternative; there is a relationship
فتح الحزمة
افتح القفل للوصول البطاقات البالغ عددها 120 في هذه المجموعة.
فتح الحزمة
k this deck
65
A Pearson correlation of .00 is BEST represented by ______.
A) a normal curve
B) a skewed distribution
C) a circle
D) an ellipse (football shape)
A) a normal curve
B) a skewed distribution
C) a circle
D) an ellipse (football shape)
فتح الحزمة
افتح القفل للوصول البطاقات البالغ عددها 120 في هذه المجموعة.
فتح الحزمة
k this deck
66
Which of the following statements best illustrates the concept of covariance?
A) "The means of the groups are not all equal to each other."
B) "People of above average intelligence vote more often than the average person."
C) "Not everyone is the same."
D) "The relationship is nonlinear."
A) "The means of the groups are not all equal to each other."
B) "People of above average intelligence vote more often than the average person."
C) "Not everyone is the same."
D) "The relationship is nonlinear."
فتح الحزمة
افتح القفل للوصول البطاقات البالغ عددها 120 في هذه المجموعة.
فتح الحزمة
k this deck
67
A researcher hypothesizes college grade point average is correlated with graduate school grade point average. In conducting an analysis to test this hypothesis, how should the null hypothesis (H0) be stated?
A) H0: all μs are equal
B) H0: ρ = 0
C) H0: college = grad school
D) H0: not all μs are equal
A) H0: all μs are equal
B) H0: ρ = 0
C) H0: college = grad school
D) H0: not all μs are equal
فتح الحزمة
افتح القفل للوصول البطاقات البالغ عددها 120 في هذه المجموعة.
فتح الحزمة
k this deck
68
A researcher calculates a value of .15 for a Pearson correlation. You would BEST describe this relationship as ______.
A) weak positive
B) weak negative
C) strong positive
D) strong negative
A) weak positive
B) weak negative
C) strong positive
D) strong negative
فتح الحزمة
افتح القفل للوصول البطاقات البالغ عددها 120 في هذه المجموعة.
فتح الحزمة
k this deck
69
A researcher wishing to correlate two variables collects data from 40 people. In this analysis, the degrees of freedom is equal to ______.
A) 79
B) 78
C) 39
D) 38
A) 79
B) 78
C) 39
D) 38
فتح الحزمة
افتح القفل للوصول البطاقات البالغ عددها 120 في هذه المجموعة.
فتح الحزمة
k this deck
70
In testing the Pearson correlation (r), the ______ hypothesis states ______.
A) alternative; there is a relationship between two variables
B) alternative; two variables are uncorrelated with each other
C) null; the means are all equal to each other
D) null; two variables are correlated with each other
A) alternative; there is a relationship between two variables
B) alternative; two variables are uncorrelated with each other
C) null; the means are all equal to each other
D) null; two variables are correlated with each other
فتح الحزمة
افتح القفل للوصول البطاقات البالغ عددها 120 في هذه المجموعة.
فتح الحزمة
k this deck
71
Which of the following statements best illustrates the concept of covariance?
A) "The population means are not all equal to each other."
B) "Students who score below the class mean on the midterm also score below the mean on the final exam."
C) "Not everyone is the same."
D) "People who differ in intelligence also differ in their personalities."
A) "The population means are not all equal to each other."
B) "Students who score below the class mean on the midterm also score below the mean on the final exam."
C) "Not everyone is the same."
D) "People who differ in intelligence also differ in their personalities."
فتح الحزمة
افتح القفل للوصول البطاقات البالغ عددها 120 في هذه المجموعة.
فتح الحزمة
k this deck
72
In calculating the Pearson correlation (r), the ______ hypothesis implies ______.
A) null; there is no relationship
B) alternative; the sample mean is different from the hypothesized population mean
C) null; the means are not all equal to each other
D) alternative; the relationship is not linear
A) null; there is no relationship
B) alternative; the sample mean is different from the hypothesized population mean
C) null; the means are not all equal to each other
D) alternative; the relationship is not linear
فتح الحزمة
افتح القفل للوصول البطاقات البالغ عددها 120 في هذه المجموعة.
فتح الحزمة
k this deck
73
A researcher calculates a value of -.90 for a Pearson correlation. You would BEST describe this relationship as ______.
A) weak positive
B) weak negative
C) strong positive
D) strong negative
A) weak positive
B) weak negative
C) strong positive
D) strong negative
فتح الحزمة
افتح القفل للوصول البطاقات البالغ عددها 120 في هذه المجموعة.
فتح الحزمة
k this deck
74
Which of the following statements BEST illustrates the concept of covariance?
A) "People with above-average intelligence vote more often than the average voter."
B) "The decision was made to reject the null hypothesis."
C) "The sample mean is significantly different from the population mean."
D) "Men are smarter than women."
A) "People with above-average intelligence vote more often than the average voter."
B) "The decision was made to reject the null hypothesis."
C) "The sample mean is significantly different from the population mean."
D) "Men are smarter than women."
فتح الحزمة
افتح القفل للوصول البطاقات البالغ عددها 120 في هذه المجموعة.
فتح الحزمة
k this deck
75
Which of the following statements best illustrates the concept of covariance?
A) "The population means are not all equal to each other."
B) "There is no relationship between one's income and one's intelligence."
C) "The distribution is normal."
D) "People with below-average incomes spend more on the lottery than the average person."
A) "The population means are not all equal to each other."
B) "There is no relationship between one's income and one's intelligence."
C) "The distribution is normal."
D) "People with below-average incomes spend more on the lottery than the average person."
فتح الحزمة
افتح القفل للوصول البطاقات البالغ عددها 120 في هذه المجموعة.
فتح الحزمة
k this deck
76
A researcher calculates a value of .85 for a Pearson correlation. You would BEST describe this relationship as ______.
A) weak positive
B) weak negative
C) strong positive
D) strong negative
A) weak positive
B) weak negative
C) strong positive
D) strong negative
فتح الحزمة
افتح القفل للوصول البطاقات البالغ عددها 120 في هذه المجموعة.
فتح الحزمة
k this deck
77
In calculating the Pearson correlation (r), the ______ hypothesis implies ______.
A) null; the hypothesized population mean
B) null; the two variables are unrelated to each other
C) alternative; the means are not all equal
D) alternative; there is no relationship
A) null; the hypothesized population mean
B) null; the two variables are unrelated to each other
C) alternative; the means are not all equal
D) alternative; there is no relationship
فتح الحزمة
افتح القفل للوصول البطاقات البالغ عددها 120 في هذه المجموعة.
فتح الحزمة
k this deck
78
Which of the following statements best illustrates the concept of covariance?
A) "Scores on the two variables are normally distributed."
B) "People with above average incomes also spend more than the average person."
C) "The variance of X is equal to the variance of Y."
D) "The null hypothesis was rejected."
A) "Scores on the two variables are normally distributed."
B) "People with above average incomes also spend more than the average person."
C) "The variance of X is equal to the variance of Y."
D) "The null hypothesis was rejected."
فتح الحزمة
افتح القفل للوصول البطاقات البالغ عددها 120 في هذه المجموعة.
فتح الحزمة
k this deck
79
Which of the following statements best illustrates the concept of covariance?
A) "People with above-average intelligence spend more on books."
B) "The population means are all equal to each other."
C) "The results of the analysis support the research hypothesis."
D) "There is no relationship between race and IQ scores."
A) "People with above-average intelligence spend more on books."
B) "The population means are all equal to each other."
C) "The results of the analysis support the research hypothesis."
D) "There is no relationship between race and IQ scores."
فتح الحزمة
افتح القفل للوصول البطاقات البالغ عددها 120 في هذه المجموعة.
فتح الحزمة
k this deck
80
A researcher wishing to correlate two variables collects data from 30 people. In this analysis, the degrees of freedom is equal to ______.
A) 28
B) 29
C) 68
D) 69
A) 28
B) 29
C) 68
D) 69
فتح الحزمة
افتح القفل للوصول البطاقات البالغ عددها 120 في هذه المجموعة.
فتح الحزمة
k this deck
فتح الحزمة
افتح القفل للوصول البطاقات البالغ عددها 120 في هذه المجموعة.


