Deck 32: The Gains From International Trade
ملء الشاشة (f)
سؤال
سؤال
سؤال
سؤال
سؤال
سؤال
سؤال
سؤال
سؤال
سؤال
سؤال
سؤال
سؤال
سؤال
سؤال
سؤال
سؤال
سؤال
سؤال
سؤال
سؤال
Ireland and Japan are assumed to produce only wool and steel, to have full employment and complete mobility of resources between industries. Their production possibilities boundaries before trade are drawn in solid lines. It is assumed that the two countries have the same amount of resources. Their consumption possibilities after trade are shown by the dotted lines. The outputs of wool and steel are given in physical units.
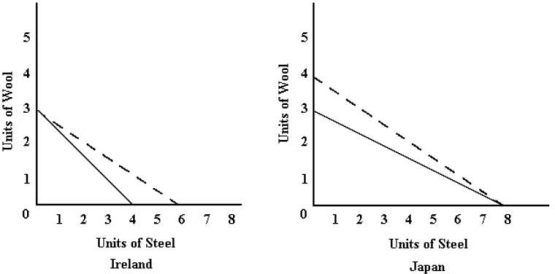 FIGURE 32-1
Refer to Figure 32-1. If Ireland and Japan were each to specialize in the good for which they have a comparative advantage, Ireland would produce and Japan would produce .
A) 0 units of wool and 6 units of steel; 4 units of wool and 0 units of steel
B) 3 units of wool and 6 units of steel; 4 units of wool and 8 units of steel
C) 3 units of wool and 4 units of steel; 3 units of wool and 8 units of steel
D) 3 units of wool and 0 units of steel; 0 units of wool and 8 units of steel
E) 4 units of wool and 0 units of steel; 0 units of wool and 8 units of steel
FIGURE 32-1Refer to Figure 32-1. If Ireland and Japan were each to specialize in the good for which they have a comparative advantage, Ireland would produce and Japan would produce .
A) 0 units of wool and 6 units of steel; 4 units of wool and 0 units of steel
B) 3 units of wool and 6 units of steel; 4 units of wool and 8 units of steel
C) 3 units of wool and 4 units of steel; 3 units of wool and 8 units of steel
D) 3 units of wool and 0 units of steel; 0 units of wool and 8 units of steel
E) 4 units of wool and 0 units of steel; 0 units of wool and 8 units of steel
سؤال
The following diagrams show the production possibilities boundaries for Austria and Switzerland, for the production of bicycles and shoes.
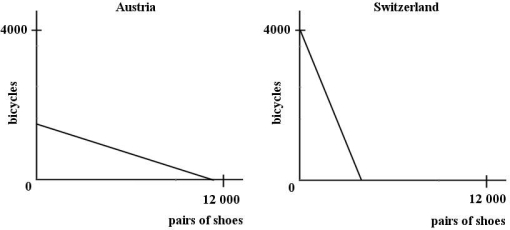 FIGURE 32-2
If two countries each produce wool and cotton, the country with the lower opportunity cost for cotton in terms of wool) will also have
A) a comparative advantage in the production of wool.
B) a comparative advantage in the production of cotton.
C) an absolute advantage in the production of wool.
D) an absolute advantage in the production of cotton.
E) an absolute advantage in the production of both wool and cotton.
FIGURE 32-2If two countries each produce wool and cotton, the country with the lower opportunity cost for cotton in terms of wool) will also have
A) a comparative advantage in the production of wool.
B) a comparative advantage in the production of cotton.
C) an absolute advantage in the production of wool.
D) an absolute advantage in the production of cotton.
E) an absolute advantage in the production of both wool and cotton.
سؤال
سؤال
سؤال
The following diagrams show the production possibilities boundaries for Austria and Switzerland, for the production of bicycles and shoes.
FIGURE 32-2
When opportunity costs are identical between two countries for all goods,
A) there can be no gains from trade unless there are economies of scale in some of the products.
B) international trade will be advantageous only to the country that has an absolute advantage in the production of some commodity.
C) there will be gains from trade for both countries if one country has an absolute advantage in the production of some commodity.
D) absolute advantages will determine the gains from trade.
E) there will be absolute advantages from trade but no comparative advantages from trade.
FIGURE 32-2When opportunity costs are identical between two countries for all goods,
A) there can be no gains from trade unless there are economies of scale in some of the products.
B) international trade will be advantageous only to the country that has an absolute advantage in the production of some commodity.
C) there will be gains from trade for both countries if one country has an absolute advantage in the production of some commodity.
D) absolute advantages will determine the gains from trade.
E) there will be absolute advantages from trade but no comparative advantages from trade.
سؤال
The following diagrams show the production possibilities boundaries for Austria and Switzerland, for the production of bicycles and shoes.
FIGURE 32-2
Consider two countries that can produce wheat and coffee. The gains from trade when the two countries have different opportunity costs are realized when
A) production possibility boundaries shift inward.
B) the two countries continue to produce the same quantities of wheat and coffee.
C) each country has an absolute advantage in one of the two commodities.
D) resources are reallocated within the two countries such that each specializes in the production of the good in which it has an absolute advantage.
E) resources are reallocated within the two countries such that each specializes in the production of the good in which it has a comparative advantage.
FIGURE 32-2Consider two countries that can produce wheat and coffee. The gains from trade when the two countries have different opportunity costs are realized when
A) production possibility boundaries shift inward.
B) the two countries continue to produce the same quantities of wheat and coffee.
C) each country has an absolute advantage in one of the two commodities.
D) resources are reallocated within the two countries such that each specializes in the production of the good in which it has an absolute advantage.
E) resources are reallocated within the two countries such that each specializes in the production of the good in which it has a comparative advantage.
سؤال
Ireland and Japan are assumed to produce only wool and steel, to have full employment and complete mobility of resources between industries. Their production possibilities boundaries before trade are drawn in solid lines. It is assumed that the two countries have the same amount of resources. Their consumption possibilities after trade are shown by the dotted lines. The outputs of wool and steel are given in physical units.
FIGURE 32-1
Refer to Figure 32-1. The comparative advantage is held by
A) neither country in either good.
B) Japan in both goods.
C) Ireland in both goods.
D) Ireland in wool, Japan in steel.
E) Ireland in steel, Japan in wool.
FIGURE 32-1Refer to Figure 32-1. The comparative advantage is held by
A) neither country in either good.
B) Japan in both goods.
C) Ireland in both goods.
D) Ireland in wool, Japan in steel.
E) Ireland in steel, Japan in wool.
سؤال
The following diagrams show the production possibilities boundaries for Austria and Switzerland, for the production of bicycles and shoes.
FIGURE 32-2
When opportunity costs differ between countries,
A) comparative advantages may not exist.
B) specialization and trade can lead to increases in the production of all commodities.
C) each country should produce only those goods for which it has an absolute advantage.
D) only the smaller countries will benefit from trade.
E) only the larger countries will benefit from trade.
FIGURE 32-2When opportunity costs differ between countries,
A) comparative advantages may not exist.
B) specialization and trade can lead to increases in the production of all commodities.
C) each country should produce only those goods for which it has an absolute advantage.
D) only the smaller countries will benefit from trade.
E) only the larger countries will benefit from trade.
سؤال
The following diagrams show the production possibilities boundaries for Austria and Switzerland, for the production of bicycles and shoes.
FIGURE 32-2
Refer to Figure 32-2. If Austria and Switzerland engage in free trade with each other, it is likely that Switzerland will specialize in the production of and Austria will specialize in the production of
)
A) bicycles; bicycles
B) shoes; bicycles
C) shoes; shoes
D) bicycles; shoes
FIGURE 32-2Refer to Figure 32-2. If Austria and Switzerland engage in free trade with each other, it is likely that Switzerland will specialize in the production of and Austria will specialize in the production of
)
A) bicycles; bicycles
B) shoes; bicycles
C) shoes; shoes
D) bicycles; shoes
سؤال
The following diagrams show the production possibilities boundaries for Austria and Switzerland, for the production of bicycles and shoes.
FIGURE 32-2
Refer to Figure 32-2. The diagrams illustrate that the is lower in Austria than in Switzerland.
A) opportunity cost of producing shoes
B) opportunity cost of producing bicycles
C) total cost of producing shoes
D) average cost of producing bicycles
E) comparative advantage in producing bicycles
FIGURE 32-2Refer to Figure 32-2. The diagrams illustrate that the is lower in Austria than in Switzerland.
A) opportunity cost of producing shoes
B) opportunity cost of producing bicycles
C) total cost of producing shoes
D) average cost of producing bicycles
E) comparative advantage in producing bicycles
سؤال
The following diagrams show the production possibilities boundaries for Austria and Switzerland, for the production of bicycles and shoes.
FIGURE 32-2
Refer to Figure 32-2. The diagrams illustrate that Switzerland
A) has an absolute advantage in the production of bicycles.
B) has a comparative advantage in the production of shoes.
C) has an absolute advantage in the production of shoes.
D) has a higher consumption of bicycles than Austria.
E) has a comparative advantage in the production of bicycles.
FIGURE 32-2Refer to Figure 32-2. The diagrams illustrate that Switzerland
A) has an absolute advantage in the production of bicycles.
B) has a comparative advantage in the production of shoes.
C) has an absolute advantage in the production of shoes.
D) has a higher consumption of bicycles than Austria.
E) has a comparative advantage in the production of bicycles.
سؤال
Ireland and Japan are assumed to produce only wool and steel, to have full employment and complete mobility of resources between industries. Their production possibilities boundaries before trade are drawn in solid lines. It is assumed that the two countries have the same amount of resources. Their consumption possibilities after trade are shown by the dotted lines. The outputs of wool and steel are given in physical units.
FIGURE 32-1
Refer to Figure 32-1. Japan has an absolute advantage in
A) wool.
B) steel.
C) both goods.
D) neither good.
E) Insufficient information to determine the answer.
FIGURE 32-1Refer to Figure 32-1. Japan has an absolute advantage in
A) wool.
B) steel.
C) both goods.
D) neither good.
E) Insufficient information to determine the answer.
سؤال
سؤال
سؤال
The following diagrams show the production possibilities boundaries for Austria and Switzerland, for the production of bicycles and shoes.
FIGURE 32-2
Refer to Figure 32-2. Assume that Austria and Switzerland do not engage in international trade. In that case,
A) Austria will produce all shoes and no bicycles.
B) Switzerland will produce all bicycles and no shoes.
C) each country will consume according to comparative advantage anyway.
D) the downward-sloping lines illustrate each countryʹs consumption possibilities.
E) each country will produce according to comparative advantage anyway.
FIGURE 32-2Refer to Figure 32-2. Assume that Austria and Switzerland do not engage in international trade. In that case,
A) Austria will produce all shoes and no bicycles.
B) Switzerland will produce all bicycles and no shoes.
C) each country will consume according to comparative advantage anyway.
D) the downward-sloping lines illustrate each countryʹs consumption possibilities.
E) each country will produce according to comparative advantage anyway.
سؤال
سؤال
سؤال
سؤال
Ireland and Japan are assumed to produce only wool and steel, to have full employment and complete mobility of resources between industries. Their production possibilities boundaries before trade are drawn in solid lines. It is assumed that the two countries have the same amount of resources. Their consumption possibilities after trade are shown by the dotted lines. The outputs of wool and steel are given in physical units.
FIGURE 32-1
Refer to Figure 32-1. When trade between Ireland and Japan begins, the probable trade pattern is to
A) export wool from Ireland to Japan and steel from Japan to Ireland.
B) export wool from Japan to Ireland and steel from Ireland to Japan.
C) export both wool and steel from Ireland to Japan.
D) export both wool and steel from Japan to Ireland.
E) impose tariffs on both goods in both countries.
FIGURE 32-1Refer to Figure 32-1. When trade between Ireland and Japan begins, the probable trade pattern is to
A) export wool from Ireland to Japan and steel from Japan to Ireland.
B) export wool from Japan to Ireland and steel from Ireland to Japan.
C) export both wool and steel from Ireland to Japan.
D) export both wool and steel from Japan to Ireland.
E) impose tariffs on both goods in both countries.
سؤال
Ireland and Japan are assumed to produce only wool and steel, to have full employment and complete mobility of resources between industries. Their production possibilities boundaries before trade are drawn in solid lines. It is assumed that the two countries have the same amount of resources. Their consumption possibilities after trade are shown by the dotted lines. The outputs of wool and steel are given in physical units.
FIGURE 32-1
Refer to Figure 32-1. Before any trade takes place, the opportunity cost of a unit of steel is
A) 3/4 unit of wool in Ireland; 3/8 unit of wool in Japan.
B) 4/3 unit of wool in Ireland; 8/3 unit of wool in Japan.
C) 3 units of wool in Ireland; 3 units of wool in Japan.
D) 4 units of wool in Ireland; 8 units of wool in Japan.
E) 4 units of wool in Ireland; 4 units of wool in Japan.
FIGURE 32-1Refer to Figure 32-1. Before any trade takes place, the opportunity cost of a unit of steel is
A) 3/4 unit of wool in Ireland; 3/8 unit of wool in Japan.
B) 4/3 unit of wool in Ireland; 8/3 unit of wool in Japan.
C) 3 units of wool in Ireland; 3 units of wool in Japan.
D) 4 units of wool in Ireland; 8 units of wool in Japan.
E) 4 units of wool in Ireland; 4 units of wool in Japan.
سؤال
سؤال
The following production possibilities schedule shows the quantities of soybeans and oil that can each be produced in Canada and Mexico with one unit of equivalent resources.
 TABLE 32-3
Refer to Table 32-3. The opportunity cost of a barrel of oil in Canada is
A) 16.67 bushels of soybeans.
B) 6 bushels of soybeans.
C) 2.5 bushels of soybeans.
D) 1.25 barrels of oil.
E) 0.8 barrels of oil.
TABLE 32-3Refer to Table 32-3. The opportunity cost of a barrel of oil in Canada is
A) 16.67 bushels of soybeans.
B) 6 bushels of soybeans.
C) 2.5 bushels of soybeans.
D) 1.25 barrels of oil.
E) 0.8 barrels of oil.
سؤال
The following production possibilities schedule shows the quantities of soybeans and oil that can each be produced in Canada and Mexico with one unit of equivalent resources.
TABLE 32-3
Refer to Table 32-3. Canada has an absolute advantage in the production of
A) soybeans.
B) oil.
C) neither soybeans nor oil.
D) both soybeans and oil.
TABLE 32-3Refer to Table 32-3. Canada has an absolute advantage in the production of
A) soybeans.
B) oil.
C) neither soybeans nor oil.
D) both soybeans and oil.
سؤال
This table shows how much cotton and cocoa can be produced in Peru and Brazil with one unit of equivalent resources.
 TABLE 32-4
Refer to Table 32-4. The opportunity cost of a bushel of cocoa beans in Brazil is
A) 1/2 bale cotton.
B) 1 bale cotton.
C) 1/6 bale cotton.
D) 1/3 bale cotton.
E) 2/3 bale cotton.
TABLE 32-4Refer to Table 32-4. The opportunity cost of a bushel of cocoa beans in Brazil is
A) 1/2 bale cotton.
B) 1 bale cotton.
C) 1/6 bale cotton.
D) 1/3 bale cotton.
E) 2/3 bale cotton.
سؤال
This table shows how much cotton and cocoa can be produced in Peru and Brazil with one unit of equivalent resources.
TABLE 32-4
Refer to Table 32-4. The opportunity cost of a bushel of cocoa beans in Peru is
A) 1/2 bale cotton.
B) 1 bale cotton.
C) 1/6 bale cotton.
D) 1/3 bale cotton.
E) 2/3 bale cotton.
TABLE 32-4Refer to Table 32-4. The opportunity cost of a bushel of cocoa beans in Peru is
A) 1/2 bale cotton.
B) 1 bale cotton.
C) 1/6 bale cotton.
D) 1/3 bale cotton.
E) 2/3 bale cotton.
سؤال
This table shows how much cotton and cocoa can be produced in Peru and Brazil with one unit of equivalent resources.
TABLE 32-4
Refer to Table 32-4. The opportunity cost of a bale of cotton in Peru is
A) 1/6 bushel of cocoa beans.
B) 1/2 bushel of cocoa beans.
C) 2/3 bushel of cocoa beans.
D) 2 bushels of cocoa beans.
E) 4 bushels of cocoa beans.
TABLE 32-4Refer to Table 32-4. The opportunity cost of a bale of cotton in Peru is
A) 1/6 bushel of cocoa beans.
B) 1/2 bushel of cocoa beans.
C) 2/3 bushel of cocoa beans.
D) 2 bushels of cocoa beans.
E) 4 bushels of cocoa beans.
سؤال
The following production possibilities schedule shows the quantities of soybeans and oil that can each be produced in Canada and Mexico with one unit of equivalent resources.
TABLE 32-3
Refer to Table 32-3. The opportunity cost of one bushel of soybeans in Mexico is
A) 3 barrels of oil.
B) 0.33 barrels of oil.
C) 0.4 bushels of soybeans.
D) indicative of Mexicoʹs comparative advantage in soybean production.
E) lower than the opportunity cost of soybeans in Canada.
TABLE 32-3Refer to Table 32-3. The opportunity cost of one bushel of soybeans in Mexico is
A) 3 barrels of oil.
B) 0.33 barrels of oil.
C) 0.4 bushels of soybeans.
D) indicative of Mexicoʹs comparative advantage in soybean production.
E) lower than the opportunity cost of soybeans in Canada.
سؤال
سؤال
The following production possibilities schedule shows the quantities of wheat and rice that can be produced in Canada and India with one unit of equivalent resources.
 TABLE 32-2
Refer to Table 32-2. India has an absolute advantage in the production of
A) rice.
B) wheat.
C) both rice and wheat.
D) neither rice nor wheat.
TABLE 32-2Refer to Table 32-2. India has an absolute advantage in the production of
A) rice.
B) wheat.
C) both rice and wheat.
D) neither rice nor wheat.
سؤال
This table shows how much cotton and cocoa can be produced in Peru and Brazil with one unit of equivalent resources.
TABLE 32-4
Refer to Table 32-4. Compared with Peru, Brazil has
A) a comparative but not absolute advantage in the production of cocoa beans.
B) an absolute and a comparative advantage in the production of cocoa beans.
C) an absolute, but not a comparative, advantage in the production of cocoa beans.
D) an absolute advantage in the production of cotton.
E) an absolute and a comparative advantage in the production of cotton.
TABLE 32-4Refer to Table 32-4. Compared with Peru, Brazil has
A) a comparative but not absolute advantage in the production of cocoa beans.
B) an absolute and a comparative advantage in the production of cocoa beans.
C) an absolute, but not a comparative, advantage in the production of cocoa beans.
D) an absolute advantage in the production of cotton.
E) an absolute and a comparative advantage in the production of cotton.
سؤال
This table shows how much cotton and cocoa can be produced in Peru and Brazil with one unit of equivalent resources.
TABLE 32-4
Refer to Table 32-4. The opportunity cost of a bale of cotton in Brazil is
A) 4 bushels of cocoa beans.
B) 6 bushels of cocoa beans.
C) 1/6 bushels of cocoa beans.
D) 1 bushel of cocoa beans.
E) 2 bushels of cocoa beans.
TABLE 32-4Refer to Table 32-4. The opportunity cost of a bale of cotton in Brazil is
A) 4 bushels of cocoa beans.
B) 6 bushels of cocoa beans.
C) 1/6 bushels of cocoa beans.
D) 1 bushel of cocoa beans.
E) 2 bushels of cocoa beans.
سؤال
سؤال
سؤال
The following production possibilities schedule shows the quantities of wheat and rice that can be produced in Canada and India with one unit of equivalent resources.
TABLE 32-2
Refer to Table 32-2. To achieve the potential gains from international trade,
A) India should export wheat to Canada and import Canadian rice.
B) Canada should produce both wheat and rice and not trade with India.
C) India should export rice to Canada and import Canadian wheat.
D) India should exclude wheat from its consumption.
E) India should produce both wheat and rice and not trade with Canada.
TABLE 32-2Refer to Table 32-2. To achieve the potential gains from international trade,
A) India should export wheat to Canada and import Canadian rice.
B) Canada should produce both wheat and rice and not trade with India.
C) India should export rice to Canada and import Canadian wheat.
D) India should exclude wheat from its consumption.
E) India should produce both wheat and rice and not trade with Canada.
سؤال
The following production possibilities schedule shows the quantities of wheat and rice that can be produced in Canada and India with one unit of equivalent resources.
TABLE 32-2
Refer to Table 32-2. If Canada were to transfer one unit of resources from rice to wheat production and if one unit of Indian resources were switched from wheat to rice production,
A) total wheat production would go up by 7 bushels.
B) total rice production would increase by 18 bushels.
C) total wheat production would be decreased by 13 bushels.
D) total rice output would decrease by 8 bushels.
E) both total wheat and total rice production would go up by 7 bushels.
TABLE 32-2Refer to Table 32-2. If Canada were to transfer one unit of resources from rice to wheat production and if one unit of Indian resources were switched from wheat to rice production,
A) total wheat production would go up by 7 bushels.
B) total rice production would increase by 18 bushels.
C) total wheat production would be decreased by 13 bushels.
D) total rice output would decrease by 8 bushels.
E) both total wheat and total rice production would go up by 7 bushels.
سؤال
The following production possibilities schedule shows the quantities of soybeans and oil that can each be produced in Canada and Mexico with one unit of equivalent resources.
TABLE 32-3
Refer to Table 32-3. The opportunity cost of a barrel of oil in Mexico is
A) 0.33 bushels of soybeans.
B) 1.25 barrels of oil.
C) 0.8 barrels of oil.
D) 3 bushels of soybeans.
E) 16 bushels of soybeans.
TABLE 32-3Refer to Table 32-3. The opportunity cost of a barrel of oil in Mexico is
A) 0.33 bushels of soybeans.
B) 1.25 barrels of oil.
C) 0.8 barrels of oil.
D) 3 bushels of soybeans.
E) 16 bushels of soybeans.
سؤال
The following production possibilities schedule shows the quantities of soybeans and oil that can each be produced in Canada and Mexico with one unit of equivalent resources.
TABLE 32-3
Refer to Table 32-3. If Canada were to transfer half a unit of resources from oil to soybeans and Mexico were to transfer one unit of resources from soybeans to oil, the effect on the total output of the two countries would be as follows:
A) soybean production would increase by 30 bushels.
B) soybean production would increase by 6 bushels and oil production would increase by 3 barrels.
C) soybean production would increase by 36 bushels and oil production would decrease by 2 barrels.
D) oil production would increase by 8 barrels.
E) soybean production would increase by 6 bushels and oil production would increase by 2.02 barrels.
TABLE 32-3Refer to Table 32-3. If Canada were to transfer half a unit of resources from oil to soybeans and Mexico were to transfer one unit of resources from soybeans to oil, the effect on the total output of the two countries would be as follows:
A) soybean production would increase by 30 bushels.
B) soybean production would increase by 6 bushels and oil production would increase by 3 barrels.
C) soybean production would increase by 36 bushels and oil production would decrease by 2 barrels.
D) oil production would increase by 8 barrels.
E) soybean production would increase by 6 bushels and oil production would increase by 2.02 barrels.
سؤال
This table shows how much cotton and cocoa can be produced in Peru and Brazil with one unit of equivalent resources.
TABLE 32-4
Refer to Table 32-4. If one unit of resources is shifted from cotton to cocoa beans in Brazil, and one unit of resources is shifted from cocoa beans to cotton in Peru, world output would increase by
A) 2 bales of cotton.
B) 1 bale of cotton and 2 bushels of cocoa beans.
C) 6 bushels of cocoa beans.
D) 3 bales of cotton and 10 bushels of cocoa beans.
E) 2 bales of cotton and 1 bushel of cocoa beans.
TABLE 32-4Refer to Table 32-4. If one unit of resources is shifted from cotton to cocoa beans in Brazil, and one unit of resources is shifted from cocoa beans to cotton in Peru, world output would increase by
A) 2 bales of cotton.
B) 1 bale of cotton and 2 bushels of cocoa beans.
C) 6 bushels of cocoa beans.
D) 3 bales of cotton and 10 bushels of cocoa beans.
E) 2 bales of cotton and 1 bushel of cocoa beans.
سؤال
The following production possibilities schedule shows the quantities of soybeans and oil that can each be produced in Canada and Mexico with one unit of equivalent resources.
TABLE 32-3
Refer to Table 32-3. Mexico would not gain by producing and exporting oil and importing soybeans unless it received
A) any quantity of soybeans.
B) 2 bushels of soybeans per barrel of oil.
C) more than 3 bushels of soybeans per barrel of oil.
D) more than 6 bushels of soybeans per barrel of oil.
E) more than 10 barrel of oil.
TABLE 32-3Refer to Table 32-3. Mexico would not gain by producing and exporting oil and importing soybeans unless it received
A) any quantity of soybeans.
B) 2 bushels of soybeans per barrel of oil.
C) more than 3 bushels of soybeans per barrel of oil.
D) more than 6 bushels of soybeans per barrel of oil.
E) more than 10 barrel of oil.
سؤال
سؤال
The diagram below shows Robinson Crusoeʹs annual production possibilities boundary for the production of bananas and coconuts.
 FIGURE 32-3
Refer to Figure 32-3. Starting from point A and moving to point B, Robinson Crusoeʹs opportunity cost of producing each additional kilogram of coconuts is
A) increasing.
B) increasing followed by decreasing.
C) constant.
D) decreasing.
E) decreasing followed by increasing.
FIGURE 32-3Refer to Figure 32-3. Starting from point A and moving to point B, Robinson Crusoeʹs opportunity cost of producing each additional kilogram of coconuts is
A) increasing.
B) increasing followed by decreasing.
C) constant.
D) decreasing.
E) decreasing followed by increasing.
سؤال
سؤال
The diagram below shows Robinson Crusoeʹs annual production possibilities boundary for the production of bananas and coconuts.
FIGURE 32-3
Refer to Figure 32-3. What is Robinson Crusoeʹs opportunity cost of bananas in terms of coconuts?
A) 2
B) 1
C) 1/2
D) 100
E) 200
FIGURE 32-3Refer to Figure 32-3. What is Robinson Crusoeʹs opportunity cost of bananas in terms of coconuts?
A) 2
B) 1
C) 1/2
D) 100
E) 200
سؤال
سؤال
The figure below shows Arcticlandʹs annual production possibilities boundary for the production of fish and ice.
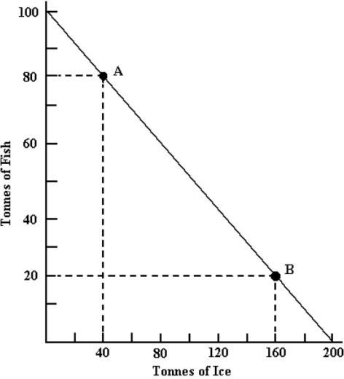 FIGURE 32-4
Refer to Figure 32-4. Beginning at point A on Arcticlandʹs production possibilities boundary, the opportunity cost of producing 10 more tonnes of fish is and the opportunity cost of producing 10 more tonnes of ice is .
A) 5 tonnes of fish; 20 tonnes of ice
B) 5 tonnes of ice; 20 tonnes of fish
C) 20 tonnes of ice; 5 tonnes of fish
D) 10 tonnes of ice; 10 tonnes of fish
E) 0; 0
FIGURE 32-4Refer to Figure 32-4. Beginning at point A on Arcticlandʹs production possibilities boundary, the opportunity cost of producing 10 more tonnes of fish is and the opportunity cost of producing 10 more tonnes of ice is .
A) 5 tonnes of fish; 20 tonnes of ice
B) 5 tonnes of ice; 20 tonnes of fish
C) 20 tonnes of ice; 5 tonnes of fish
D) 10 tonnes of ice; 10 tonnes of fish
E) 0; 0
سؤال
This table shows how much wine and cheese can be produced in Spain and Portugal with one unit of equivalent resources. Initially there is no trade. Once trade opens up, transportation costs are assumed to be zero.
 TABLE 32-5
Refer to Table 32-5. The comparative advantage in cheese is held by
A) Spain.
B) Portugal.
C) both countries.
D) neither country.
E) Insufficient information to know.
TABLE 32-5Refer to Table 32-5. The comparative advantage in cheese is held by
A) Spain.
B) Portugal.
C) both countries.
D) neither country.
E) Insufficient information to know.
سؤال
The figure below shows Arcticlandʹs annual production possibilities boundary for the production of fish and ice.
FIGURE 32-4
When two countries are specializing and trading with each other, the gains from trade will tend to be greater when
A) opportunity costs in the two countries are similar.
B) there are economies of scale in production.
C) prices rise in both countries.
D) the production possibilities boundaries shift inward.
E) comparative advantages are eliminated.
FIGURE 32-4When two countries are specializing and trading with each other, the gains from trade will tend to be greater when
A) opportunity costs in the two countries are similar.
B) there are economies of scale in production.
C) prices rise in both countries.
D) the production possibilities boundaries shift inward.
E) comparative advantages are eliminated.
سؤال
This table shows how much cotton and cocoa can be produced in Peru and Brazil with one unit of equivalent resources.
TABLE 32-4
Refer to Table 32-4. For trade to be advantageous to both Peru and Brazil, the number of bushels of cocoa beans that must be traded for a bale of cotton is
A) less than 2.
B) 2.
C) more than 2, but less than 6.
D) 6.
E) more than 6.
TABLE 32-4Refer to Table 32-4. For trade to be advantageous to both Peru and Brazil, the number of bushels of cocoa beans that must be traded for a bale of cotton is
A) less than 2.
B) 2.
C) more than 2, but less than 6.
D) 6.
E) more than 6.
سؤال
The figure below shows Arcticlandʹs annual production possibilities boundary for the production of fish and ice.
FIGURE 32-4
When specialization according to comparative advantage also makes economies of scale possible,
A) trade is not beneficial to the country that has the absolute advantage in both goods.
B) the production possibilities boundaries of all trading countries will shift inward.
C) there will be additional gains from trade.
D) costs will rise in all trading countries.
E) it will be beneficial for all trading countries to impose tariffs.
FIGURE 32-4When specialization according to comparative advantage also makes economies of scale possible,
A) trade is not beneficial to the country that has the absolute advantage in both goods.
B) the production possibilities boundaries of all trading countries will shift inward.
C) there will be additional gains from trade.
D) costs will rise in all trading countries.
E) it will be beneficial for all trading countries to impose tariffs.
سؤال
The diagram below shows Robinson Crusoeʹs annual production possibilities boundary for the production of bananas and coconuts.
FIGURE 32-3
Refer to Figure 32-3. Starting from point B and moving to point A, his opportunity cost of producing each additional kilogram of bananas is
A) increasing.
B) increasing followed by decreasing.
C) constant.
D) decreasing.
E) decreasing followed by increasing.
FIGURE 32-3Refer to Figure 32-3. Starting from point B and moving to point A, his opportunity cost of producing each additional kilogram of bananas is
A) increasing.
B) increasing followed by decreasing.
C) constant.
D) decreasing.
E) decreasing followed by increasing.
سؤال
The figure below shows Arcticlandʹs annual production possibilities boundary for the production of fish and ice.
FIGURE 32-4
Refer to Figure 32-4. Starting from point A and moving to point B, the opportunity cost of producing each additional tonne of ice is
A) increasing.
B) increasing followed by decreasing.
C) constant.
D) decreasing.
E) decreasing followed by increasing.
FIGURE 32-4Refer to Figure 32-4. Starting from point A and moving to point B, the opportunity cost of producing each additional tonne of ice is
A) increasing.
B) increasing followed by decreasing.
C) constant.
D) decreasing.
E) decreasing followed by increasing.
سؤال
This table shows how much wine and cheese can be produced in Spain and Portugal with one unit of equivalent resources. Initially there is no trade. Once trade opens up, transportation costs are assumed to be zero.
TABLE 32-5
Refer to Table 32-5. The comparative advantage in wine is held by
A) Spain.
B) Portugal.
C) both countries.
D) neither country.
E) Insufficient information to determine the answer.
TABLE 32-5Refer to Table 32-5. The comparative advantage in wine is held by
A) Spain.
B) Portugal.
C) both countries.
D) neither country.
E) Insufficient information to determine the answer.
سؤال
سؤال
The diagram below shows Robinson Crusoeʹs annual production possibilities boundary for the production of bananas and coconuts.
FIGURE 32-3
Refer to Figure 32-3. What is Robinson Crusoeʹs opportunity cost of coconuts in terms of bananas?
A) 2
B) 1
C) 1/2
D) 100
E) 200
FIGURE 32-3Refer to Figure 32-3. What is Robinson Crusoeʹs opportunity cost of coconuts in terms of bananas?
A) 2
B) 1
C) 1/2
D) 100
E) 200
سؤال
This table shows how much wine and cheese can be produced in Spain and Portugal with one unit of equivalent resources. Initially there is no trade. Once trade opens up, transportation costs are assumed to be zero.
TABLE 32-5
Refer to Table 32-5. The opportunity cost of cheese in terms of wine is
A) 1/4 in Spain.
B) 4 in Spain.
C) 2 in each country.
D) 3/2 in Portugal.
E) 3 in Portugal.
TABLE 32-5Refer to Table 32-5. The opportunity cost of cheese in terms of wine is
A) 1/4 in Spain.
B) 4 in Spain.
C) 2 in each country.
D) 3/2 in Portugal.
E) 3 in Portugal.
سؤال
سؤال
This table shows how much wine and cheese can be produced in Spain and Portugal with one unit of equivalent resources. Initially there is no trade. Once trade opens up, transportation costs are assumed to be zero.
TABLE 32-5
Refer to Table 32-5. Once Spain and Portugal begin to trade cheese and wine,
A) some resources will be permanently unemployed in Portugal.
B) it will be beneficial for Portugal to ban the import of cheese.
C) it will be beneficial for Spain to ban the import of wine.
D) the opportunity cost of the goods they now import will be less than when there was no trade, but for Portugal only.
E) the opportunity cost of the goods they now import will be less than when there was no trade, for both countries.
TABLE 32-5Refer to Table 32-5. Once Spain and Portugal begin to trade cheese and wine,
A) some resources will be permanently unemployed in Portugal.
B) it will be beneficial for Portugal to ban the import of cheese.
C) it will be beneficial for Spain to ban the import of wine.
D) the opportunity cost of the goods they now import will be less than when there was no trade, but for Portugal only.
E) the opportunity cost of the goods they now import will be less than when there was no trade, for both countries.
سؤال
The figure below shows Arcticlandʹs annual production possibilities boundary for the production of fish and ice.
FIGURE 32-4
In addition to realizing the benefits of specialization according to comparative advantage, a nation that engages in international trade and specialization may realize benefits from
A) economies of scale and learning by doing.
B) diseconomies of scale and learning by doing.
C) learning by doing and increased opportunity costs.
D) a devaluation of its currency.
E) a less diversified economy.
FIGURE 32-4In addition to realizing the benefits of specialization according to comparative advantage, a nation that engages in international trade and specialization may realize benefits from
A) economies of scale and learning by doing.
B) diseconomies of scale and learning by doing.
C) learning by doing and increased opportunity costs.
D) a devaluation of its currency.
E) a less diversified economy.
سؤال
سؤال
The figure below shows Arcticlandʹs annual production possibilities boundary for the production of fish and ice.
FIGURE 32-4
According to David Ricardoʹs principle of comparative advantage, there will be gains from international trade
A) only by a country with an absolute advantage in the production of some commodity.
B) only by developed countries.
C) by any trading country with opportunity costs similar to other countries.
D) by only one country if opportunity costs are identical across countries.
E) by any country with opportunity costs different from other countries.
FIGURE 32-4According to David Ricardoʹs principle of comparative advantage, there will be gains from international trade
A) only by a country with an absolute advantage in the production of some commodity.
B) only by developed countries.
C) by any trading country with opportunity costs similar to other countries.
D) by only one country if opportunity costs are identical across countries.
E) by any country with opportunity costs different from other countries.

فتح الحزمة
قم بالتسجيل لفتح البطاقات في هذه المجموعة!
Unlock Deck
Unlock Deck
1/127
العب
ملء الشاشة (f)
Deck 32: The Gains From International Trade
1
If a country has a comparative advantage in the production of soybeans, and it trades freely with other countries, it will most probably
A) derive no advantage from any trade in soybeans.
B) increase its consumption of soybeans.
C) export soybeans.
D) import soybeans.
E) not consume soybeans.
A) derive no advantage from any trade in soybeans.
B) increase its consumption of soybeans.
C) export soybeans.
D) import soybeans.
E) not consume soybeans.
C
2
Consider the following information about the production of two goods, X and Y, in two countries, A and B:
∙ In Country A it takes Xa units of resources to produce one unit of X and Ya units of resources to produce one unit of Y.
∙ In Country B it takes Xb units of resources to produce one unit of X and Yb units of resources to produce one unit of Y.
∙ Assume the amount of resources used to produce the goods in the two countries can be compared unambiguously.
TABLE 32-1
Refer to Table 32-1. Country A has a comparative advantage in producing good X if
A) Xa/Ya) is less than Xb/Yb).
B) Xa/Xb) is greater than Ya/Yb).
C) Xa/Ya) is greater than Xb/Yb).
D) Xa is less than Yb.
E) Xa = Xb.
A
3
Consider the following information about the production of two goods, X and Y, in two countries, A and B:
∙ In Country A it takes Xa units of resources to produce one unit of X and Ya units of resources to produce one unit of Y.
∙ In Country B it takes Xb units of resources to produce one unit of X and Yb units of resources to produce one unit of Y.
∙ Assume the amount of resources used to produce the goods in the two countries can be compared unambiguously.
TABLE 32-1
Refer to Table 32-1. There is no scope for gains from trade due to specialization between the two countries if
A) Xa/Ya) is greater than Xb/Yb).
B) Xa is equal to Yb.
C) Xa/Ya) is equal to Xb/Yb).
D) Xa is less than Yb and Ya is less than Yb.
E) Xa is less than Xb.
C
4
Consider a country that is initially autarkic and then engages freely in international trade. If this country has a comparative advantage in the production of soybeans, it will most probably
A) derive no advantage from any trade in soybeans.
B) decrease the production of soybeans for domestic consumption.
C) increase the production of soybeans for domestic consumption.
D) increase the production of soybeans to allow for the export of soybeans.
E) import soybeans
A) derive no advantage from any trade in soybeans.
B) decrease the production of soybeans for domestic consumption.
C) increase the production of soybeans for domestic consumption.
D) increase the production of soybeans to allow for the export of soybeans.
E) import soybeans
فتح الحزمة
افتح القفل للوصول البطاقات البالغ عددها 127 في هذه المجموعة.
فتح الحزمة
k this deck
5
A country that engages in no foreign trade is said to be in a situation of
A) comparative advantage.
B) absolute advantage.
C) reciprocal absolute advantage.
D) autarky.
E) isolation.
A) comparative advantage.
B) absolute advantage.
C) reciprocal absolute advantage.
D) autarky.
E) isolation.
فتح الحزمة
افتح القفل للوصول البطاقات البالغ عددها 127 في هذه المجموعة.
فتح الحزمة
k this deck
6
The existence of any ʺgains from tradeʺ relies on
A) closed economies.
B) absolute advantage.
C) comparative advantage.
D) both absolute and comparative advantage.
E) tariffs.
A) closed economies.
B) absolute advantage.
C) comparative advantage.
D) both absolute and comparative advantage.
E) tariffs.
فتح الحزمة
افتح القفل للوصول البطاقات البالغ عددها 127 في هذه المجموعة.
فتح الحزمة
k this deck
7
The existence of ʺabsolute advantageʺ
A) implies that there will be no benefits from trade between two nations.
B) refers to a situation where one country can produce one unit of a given product with fewer resources than the other country.
C) fosters the self-sufficiency of nations.
D) refers to a situation where one country can produce one unit of all goods with fewer resources than can another country.
E) is not physically possible.
فتح الحزمة
افتح القفل للوصول البطاقات البالغ عددها 127 في هذه المجموعة.
فتح الحزمة
k this deck
8
Consider two countries that can produce rice and other products. If neither country has an absolute advantage in the production of rice,
A) there is no possibility that either country will import rice from the other.
B) neither country can possibly have a comparative advantage in the production of rice.
C) rice will still be traded as long as one of the countries has a comparative advantage in its production.
D) the opportunity cost of producing rice must be identical in the two countries.
E) then rice should not be produced.
فتح الحزمة
افتح القفل للوصول البطاقات البالغ عددها 127 في هذه المجموعة.
فتح الحزمة
k this deck
9
Trade, whether between individuals or nations, generally promotes
A) self-sufficiency.
B) specialization.
C) lower living standards.
D) higher product prices.
E) autarky.
A) self-sufficiency.
B) specialization.
C) lower living standards.
D) higher product prices.
E) autarky.
فتح الحزمة
افتح القفل للوصول البطاقات البالغ عددها 127 في هذه المجموعة.
فتح الحزمة
k this deck
10
There will be no gains from specialization and trade between two countries if
1) neither country has an absolute advantage in the production of any good;
2) neither country has a comparative advantage in the production of any good;
3) opportunity costs differ too much between the two countries.
A) 1 only
B) 2 only
C) 3 only
D) 1 and 2
E) 2 and 3
1) neither country has an absolute advantage in the production of any good;
2) neither country has a comparative advantage in the production of any good;
3) opportunity costs differ too much between the two countries.
A) 1 only
B) 2 only
C) 3 only
D) 1 and 2
E) 2 and 3
فتح الحزمة
افتح القفل للوصول البطاقات البالغ عددها 127 في هذه المجموعة.
فتح الحزمة
k this deck
11
The increases in a nationʹs output and consumption that result from specialization and trade are called
A) the terms of trade.
B) the gains from trade.
C) autarky.
D) absolute advantage.
E) comparative advantage.
A) the terms of trade.
B) the gains from trade.
C) autarky.
D) absolute advantage.
E) comparative advantage.
فتح الحزمة
افتح القفل للوصول البطاقات البالغ عددها 127 في هذه المجموعة.
فتح الحزمة
k this deck
12
One region is said to have an absolute advantage over another region in the production of good X when
A) the first region has a more productive labour force than the second.
B) the first region has a larger supply of the raw materials required to produce good X.
C) an equal quantity of resources can produce more of good X in the first region than in the second region.
D) there is no demand for good X in the second region.
E) the opportunity cost of one unit of X is lower in the first region than in the second region.
فتح الحزمة
افتح القفل للوصول البطاقات البالغ عددها 127 في هذه المجموعة.
فتح الحزمة
k this deck
13
Consider the following information about the production of two goods, X and Y, in two countries, A and B:
∙ In Country A it takes Xa units of resources to produce one unit of X and Ya units of resources to produce one unit of Y.
∙ In Country B it takes Xb units of resources to produce one unit of X and Yb units of resources to produce one unit of Y.
∙ Assume the amount of resources used to produce the goods in the two countries can be compared unambiguously.
TABLE 32-1
Refer to Table 32-1. If Xa is less than Xb, we can conclude with certainty that
A) The opportunity cost of producing good X in Country A is less than in Country B.
B) Country A has a comparative advantage in the production of good X.
C) Country A has an absolute advantage in the production of good X.
D) The price of good X in Country A is less than the price in Country B.
E) The opportunity cost of producing good X in Country A is higher than in Country B.
فتح الحزمة
افتح القفل للوصول البطاقات البالغ عددها 127 في هذه المجموعة.
فتح الحزمة
k this deck
14
The concept of ʺcomparative advantageʺ refers to the
A) ability of one region to produce a commodity at a lower opportunity cost than another region.
B) ability of one region to produce a commodity with less labour input than another region.
C) ability of one region to produce a commodity with fewer total inputs than another region.
D) gains from international trade.
E) terms of trade index.
فتح الحزمة
افتح القفل للوصول البطاقات البالغ عددها 127 في هذه المجموعة.
فتح الحزمة
k this deck
15
Since 1950, the worldʹs real GDP has increased by seven times and the volume of world trade has increased by roughly
A) the same amount.
B) two times.
C) ten times.
D) fifteen times.
E) thirty-five times.
A) the same amount.
B) two times.
C) ten times.
D) fifteen times.
E) thirty-five times.
فتح الحزمة
افتح القفل للوصول البطاقات البالغ عددها 127 في هذه المجموعة.
فتح الحزمة
k this deck
16
There will be no gains from specialization and trade between two countries if
1) neither country has an absolute advantage in the production of any good;
2) neither country has a comparative advantage in the production of any good;
3) opportunity costs are the same in the two countries.
A) 1 only
B) 2 only
C) 3 only
D) 1 and 2
E) 2 and 3
1) neither country has an absolute advantage in the production of any good;
2) neither country has a comparative advantage in the production of any good;
3) opportunity costs are the same in the two countries.
A) 1 only
B) 2 only
C) 3 only
D) 1 and 2
E) 2 and 3
فتح الحزمة
افتح القفل للوصول البطاقات البالغ عددها 127 في هذه المجموعة.
فتح الحزمة
k this deck
17
In 2014 the value of goods exported from Canada was approximately $ while the value of goods imported was approximately $ . Each of these flows represents % of Canadaʹs GDP.
A) 50 billion; 30 billion; 6
B) 530 billion; 525 billion; 32
C) 12 billion; 12 billion; 1
D) 100 billion; 100 billion; 15
E) 25 billion; 25 billion; 10
A) 50 billion; 30 billion; 6
B) 530 billion; 525 billion; 32
C) 12 billion; 12 billion; 1
D) 100 billion; 100 billion; 15
E) 25 billion; 25 billion; 10
فتح الحزمة
افتح القفل للوصول البطاقات البالغ عددها 127 في هذه المجموعة.
فتح الحزمة
k this deck
18
Consider the following information about the production of two goods, X and Y, in two countries, A and B:
∙ In Country A it takes Xa units of resources to produce one unit of X and Ya units of resources to produce one unit of Y.
∙ In Country B it takes Xb units of resources to produce one unit of X and Yb units of resources to produce one unit of Y.
∙ Assume the amount of resources used to produce the goods in the two countries can be compared unambiguously.
TABLE 32-1
Refer to Table 32-1. Country A has an absolute advantage in producing good X if
A) Xa/Ya) is less than Xb/Yb).
B) Xa is less than Xb.
C) Xa is less than Ya.
D) Xa/Xb) is less than Ya/Yb).
E) Xa = Xb.
فتح الحزمة
افتح القفل للوصول البطاقات البالغ عددها 127 في هذه المجموعة.
فتح الحزمة
k this deck
19
Consider the following information about the production of two goods, X and Y, in two countries, A and B:
∙ In Country A it takes Xa units of resources to produce one unit of X and Ya units of resources to produce one unit of Y.
∙ In Country B it takes Xb units of resources to produce one unit of X and Yb units of resources to produce one unit of Y.
∙ Assume the amount of resources used to produce the goods in the two countries can be compared unambiguously.
TABLE 32-1
Refer to Table 32-1. If the ratio Xa/Ya is less than the ratio Xb/Yb, then we can say with certainty that
A) The opportunity cost of producing good X in Country A is less than in Country B.
B) Country A has a comparative advantage in the production of good X.
C) Country A has an absolute advantage in the production of good X.
D) The opportunity cost of producing good X in Country A is higher than in Country B.
E) Both A and B are correct.
فتح الحزمة
افتح القفل للوصول البطاقات البالغ عددها 127 في هذه المجموعة.
فتح الحزمة
k this deck
20
The principle of comparative advantage was first formulated in the 18th century by
A) David Hume.
B) Thomas Malthus.
C) Karl Marx.
D) David Ricardo.
E) Adam Smith.
A) David Hume.
B) Thomas Malthus.
C) Karl Marx.
D) David Ricardo.
E) Adam Smith.
فتح الحزمة
افتح القفل للوصول البطاقات البالغ عددها 127 في هذه المجموعة.
فتح الحزمة
k this deck
21
Ireland and Japan are assumed to produce only wool and steel, to have full employment and complete mobility of resources between industries. Their production possibilities boundaries before trade are drawn in solid lines. It is assumed that the two countries have the same amount of resources. Their consumption possibilities after trade are shown by the dotted lines. The outputs of wool and steel are given in physical units.
FIGURE 32-1
Refer to Figure 32-1. If Ireland and Japan were each to specialize in the good for which they have a comparative advantage, Ireland would produce and Japan would produce .
A) 0 units of wool and 6 units of steel; 4 units of wool and 0 units of steel
B) 3 units of wool and 6 units of steel; 4 units of wool and 8 units of steel
C) 3 units of wool and 4 units of steel; 3 units of wool and 8 units of steel
D) 3 units of wool and 0 units of steel; 0 units of wool and 8 units of steel
E) 4 units of wool and 0 units of steel; 0 units of wool and 8 units of steel
FIGURE 32-1Refer to Figure 32-1. If Ireland and Japan were each to specialize in the good for which they have a comparative advantage, Ireland would produce and Japan would produce .
A) 0 units of wool and 6 units of steel; 4 units of wool and 0 units of steel
B) 3 units of wool and 6 units of steel; 4 units of wool and 8 units of steel
C) 3 units of wool and 4 units of steel; 3 units of wool and 8 units of steel
D) 3 units of wool and 0 units of steel; 0 units of wool and 8 units of steel
E) 4 units of wool and 0 units of steel; 0 units of wool and 8 units of steel
فتح الحزمة
افتح القفل للوصول البطاقات البالغ عددها 127 في هذه المجموعة.
فتح الحزمة
k this deck
22
The following diagrams show the production possibilities boundaries for Austria and Switzerland, for the production of bicycles and shoes.
FIGURE 32-2
If two countries each produce wool and cotton, the country with the lower opportunity cost for cotton in terms of wool) will also have
A) a comparative advantage in the production of wool.
B) a comparative advantage in the production of cotton.
C) an absolute advantage in the production of wool.
D) an absolute advantage in the production of cotton.
E) an absolute advantage in the production of both wool and cotton.
FIGURE 32-2If two countries each produce wool and cotton, the country with the lower opportunity cost for cotton in terms of wool) will also have
A) a comparative advantage in the production of wool.
B) a comparative advantage in the production of cotton.
C) an absolute advantage in the production of wool.
D) an absolute advantage in the production of cotton.
E) an absolute advantage in the production of both wool and cotton.
فتح الحزمة
افتح القفل للوصول البطاقات البالغ عددها 127 في هذه المجموعة.
فتح الحزمة
k this deck
23
Suppose Spain is currently producing 90 units of wine and 10 units of cheese, but to produce 10 more units of cheese it must sacrifice 30 units of wine. Further, suppose that Portugal produces 45 units of wine and 45 units of cheese, but to produce 10 more units of cheese it must sacrifice only 10 units of wine. It can be concluded that
A) Portugal has an absolute advantage in both wine and cheese production.
B) Portugal has an absolute advantage in wine production and Spain has an absolute advantage in cheese production.
C) Spain has an absolute advantage in both wine and cheese production.
D) Spain has a comparative advantage in the production of wine and Portugal has a comparative advantage in the production of cheese.
E) more information is needed to conclude anything about comparative advantage in either country.
فتح الحزمة
افتح القفل للوصول البطاقات البالغ عددها 127 في هذه المجموعة.
فتح الحزمة
k this deck
24
Suppose Canada could produce all goods and services more cheaply than all other countries. In that case,
A) no trade would occur because Canada would have an absolute advantage in producing everything.
B) no trade would occur because Canada would not have a comparative advantage in producing anything.
C) trade would probably take place because Canada would still have a comparative disadvantage in producing some goods.
D) trade would occur but only if other countries also have an absolute advantage.
E) trade would occur but only if other countries subsidize the import of Canadian goods and services.
فتح الحزمة
افتح القفل للوصول البطاقات البالغ عددها 127 في هذه المجموعة.
فتح الحزمة
k this deck
25
The following diagrams show the production possibilities boundaries for Austria and Switzerland, for the production of bicycles and shoes.
FIGURE 32-2
When opportunity costs are identical between two countries for all goods,
A) there can be no gains from trade unless there are economies of scale in some of the products.
B) international trade will be advantageous only to the country that has an absolute advantage in the production of some commodity.
C) there will be gains from trade for both countries if one country has an absolute advantage in the production of some commodity.
D) absolute advantages will determine the gains from trade.
E) there will be absolute advantages from trade but no comparative advantages from trade.
FIGURE 32-2When opportunity costs are identical between two countries for all goods,
A) there can be no gains from trade unless there are economies of scale in some of the products.
B) international trade will be advantageous only to the country that has an absolute advantage in the production of some commodity.
C) there will be gains from trade for both countries if one country has an absolute advantage in the production of some commodity.
D) absolute advantages will determine the gains from trade.
E) there will be absolute advantages from trade but no comparative advantages from trade.
فتح الحزمة
افتح القفل للوصول البطاقات البالغ عددها 127 في هذه المجموعة.
فتح الحزمة
k this deck
26
The following diagrams show the production possibilities boundaries for Austria and Switzerland, for the production of bicycles and shoes.
FIGURE 32-2
Consider two countries that can produce wheat and coffee. The gains from trade when the two countries have different opportunity costs are realized when
A) production possibility boundaries shift inward.
B) the two countries continue to produce the same quantities of wheat and coffee.
C) each country has an absolute advantage in one of the two commodities.
D) resources are reallocated within the two countries such that each specializes in the production of the good in which it has an absolute advantage.
E) resources are reallocated within the two countries such that each specializes in the production of the good in which it has a comparative advantage.
FIGURE 32-2Consider two countries that can produce wheat and coffee. The gains from trade when the two countries have different opportunity costs are realized when
A) production possibility boundaries shift inward.
B) the two countries continue to produce the same quantities of wheat and coffee.
C) each country has an absolute advantage in one of the two commodities.
D) resources are reallocated within the two countries such that each specializes in the production of the good in which it has an absolute advantage.
E) resources are reallocated within the two countries such that each specializes in the production of the good in which it has a comparative advantage.
فتح الحزمة
افتح القفل للوصول البطاقات البالغ عددها 127 في هذه المجموعة.
فتح الحزمة
k this deck
27
Ireland and Japan are assumed to produce only wool and steel, to have full employment and complete mobility of resources between industries. Their production possibilities boundaries before trade are drawn in solid lines. It is assumed that the two countries have the same amount of resources. Their consumption possibilities after trade are shown by the dotted lines. The outputs of wool and steel are given in physical units.
FIGURE 32-1
Refer to Figure 32-1. The comparative advantage is held by
A) neither country in either good.
B) Japan in both goods.
C) Ireland in both goods.
D) Ireland in wool, Japan in steel.
E) Ireland in steel, Japan in wool.
FIGURE 32-1Refer to Figure 32-1. The comparative advantage is held by
A) neither country in either good.
B) Japan in both goods.
C) Ireland in both goods.
D) Ireland in wool, Japan in steel.
E) Ireland in steel, Japan in wool.
فتح الحزمة
افتح القفل للوصول البطاقات البالغ عددها 127 في هذه المجموعة.
فتح الحزمة
k this deck
28
The following diagrams show the production possibilities boundaries for Austria and Switzerland, for the production of bicycles and shoes.
FIGURE 32-2
When opportunity costs differ between countries,
A) comparative advantages may not exist.
B) specialization and trade can lead to increases in the production of all commodities.
C) each country should produce only those goods for which it has an absolute advantage.
D) only the smaller countries will benefit from trade.
E) only the larger countries will benefit from trade.
FIGURE 32-2When opportunity costs differ between countries,
A) comparative advantages may not exist.
B) specialization and trade can lead to increases in the production of all commodities.
C) each country should produce only those goods for which it has an absolute advantage.
D) only the smaller countries will benefit from trade.
E) only the larger countries will benefit from trade.
فتح الحزمة
افتح القفل للوصول البطاقات البالغ عددها 127 في هذه المجموعة.
فتح الحزمة
k this deck
29
The following diagrams show the production possibilities boundaries for Austria and Switzerland, for the production of bicycles and shoes.
FIGURE 32-2
Refer to Figure 32-2. If Austria and Switzerland engage in free trade with each other, it is likely that Switzerland will specialize in the production of and Austria will specialize in the production of
)
A) bicycles; bicycles
B) shoes; bicycles
C) shoes; shoes
D) bicycles; shoes
FIGURE 32-2Refer to Figure 32-2. If Austria and Switzerland engage in free trade with each other, it is likely that Switzerland will specialize in the production of and Austria will specialize in the production of
)
A) bicycles; bicycles
B) shoes; bicycles
C) shoes; shoes
D) bicycles; shoes
فتح الحزمة
افتح القفل للوصول البطاقات البالغ عددها 127 في هذه المجموعة.
فتح الحزمة
k this deck
30
The following diagrams show the production possibilities boundaries for Austria and Switzerland, for the production of bicycles and shoes.
FIGURE 32-2
Refer to Figure 32-2. The diagrams illustrate that the is lower in Austria than in Switzerland.
A) opportunity cost of producing shoes
B) opportunity cost of producing bicycles
C) total cost of producing shoes
D) average cost of producing bicycles
E) comparative advantage in producing bicycles
FIGURE 32-2Refer to Figure 32-2. The diagrams illustrate that the is lower in Austria than in Switzerland.
A) opportunity cost of producing shoes
B) opportunity cost of producing bicycles
C) total cost of producing shoes
D) average cost of producing bicycles
E) comparative advantage in producing bicycles
فتح الحزمة
افتح القفل للوصول البطاقات البالغ عددها 127 في هذه المجموعة.
فتح الحزمة
k this deck
31
The following diagrams show the production possibilities boundaries for Austria and Switzerland, for the production of bicycles and shoes.
FIGURE 32-2
Refer to Figure 32-2. The diagrams illustrate that Switzerland
A) has an absolute advantage in the production of bicycles.
B) has a comparative advantage in the production of shoes.
C) has an absolute advantage in the production of shoes.
D) has a higher consumption of bicycles than Austria.
E) has a comparative advantage in the production of bicycles.
FIGURE 32-2Refer to Figure 32-2. The diagrams illustrate that Switzerland
A) has an absolute advantage in the production of bicycles.
B) has a comparative advantage in the production of shoes.
C) has an absolute advantage in the production of shoes.
D) has a higher consumption of bicycles than Austria.
E) has a comparative advantage in the production of bicycles.
فتح الحزمة
افتح القفل للوصول البطاقات البالغ عددها 127 في هذه المجموعة.
فتح الحزمة
k this deck
32
Ireland and Japan are assumed to produce only wool and steel, to have full employment and complete mobility of resources between industries. Their production possibilities boundaries before trade are drawn in solid lines. It is assumed that the two countries have the same amount of resources. Their consumption possibilities after trade are shown by the dotted lines. The outputs of wool and steel are given in physical units.
FIGURE 32-1
Refer to Figure 32-1. Japan has an absolute advantage in
A) wool.
B) steel.
C) both goods.
D) neither good.
E) Insufficient information to determine the answer.
FIGURE 32-1Refer to Figure 32-1. Japan has an absolute advantage in
A) wool.
B) steel.
C) both goods.
D) neither good.
E) Insufficient information to determine the answer.
فتح الحزمة
افتح القفل للوصول البطاقات البالغ عددها 127 في هذه المجموعة.
فتح الحزمة
k this deck
33
Consider the following information about the production of two goods, X and Y, in two countries, A and B:
∙ In Country A it takes Xa units of resources to produce one unit of X and Ya units of resources to produce one unit of Y.
∙ In Country B it takes Xb units of resources to produce one unit of X and Yb units of resources to produce one unit of Y.
∙ Assume the amount of resources used to produce the goods in the two countries can be compared unambiguously.
TABLE 32-1
Two nations want to engage in trade but discover that one of them is more efficient in producing all goods. In this case,
A) each nation should export the good in which it has a comparative advantage.
B) no trade is possible.
C) the more efficient country should produce all goods and export them.
D) the less efficient country should engage in importation of goods only.
E) the more efficient country should import all goods.
فتح الحزمة
افتح القفل للوصول البطاقات البالغ عددها 127 في هذه المجموعة.
فتح الحزمة
k this deck
34
Consider the following information about the production of two goods, X and Y, in two countries, A and B:
∙ In Country A it takes Xa units of resources to produce one unit of X and Ya units of resources to produce one unit of Y.
∙ In Country B it takes Xb units of resources to produce one unit of X and Yb units of resources to produce one unit of Y.
∙ Assume the amount of resources used to produce the goods in the two countries can be compared unambiguously.
TABLE 32-1
If Canada has an absolute advantage in the production of oil relative to the United States, then
A) Canada also has a comparative advantage in producing oil.
B) Canada also has a comparative advantage in producing some good other than oil.
C) the opportunity cost of producing oil is higher in Canada than in the United States.
D) the opportunity cost of producing oil is lower in Canada than in the United States.
E) Canada may or may not have a comparative advantage in producing oil relative to the United States.
فتح الحزمة
افتح القفل للوصول البطاقات البالغ عددها 127 في هذه المجموعة.
فتح الحزمة
k this deck
35
The following diagrams show the production possibilities boundaries for Austria and Switzerland, for the production of bicycles and shoes.
FIGURE 32-2
Refer to Figure 32-2. Assume that Austria and Switzerland do not engage in international trade. In that case,
A) Austria will produce all shoes and no bicycles.
B) Switzerland will produce all bicycles and no shoes.
C) each country will consume according to comparative advantage anyway.
D) the downward-sloping lines illustrate each countryʹs consumption possibilities.
E) each country will produce according to comparative advantage anyway.
FIGURE 32-2Refer to Figure 32-2. Assume that Austria and Switzerland do not engage in international trade. In that case,
A) Austria will produce all shoes and no bicycles.
B) Switzerland will produce all bicycles and no shoes.
C) each country will consume according to comparative advantage anyway.
D) the downward-sloping lines illustrate each countryʹs consumption possibilities.
E) each country will produce according to comparative advantage anyway.
فتح الحزمة
افتح القفل للوصول البطاقات البالغ عددها 127 في هذه المجموعة.
فتح الحزمة
k this deck
36
Consider the following information about the production of two goods, X and Y, in two countries, A and B:
∙ In Country A it takes Xa units of resources to produce one unit of X and Ya units of resources to produce one unit of Y.
∙ In Country B it takes Xb units of resources to produce one unit of X and Yb units of resources to produce one unit of Y.
∙ Assume the amount of resources used to produce the goods in the two countries can be compared unambiguously.
TABLE 32-1
If a country is not engaged in trade at all with its neighbours, and then begins to trade, it will
A) experience increases in employment in all industries.
B) be consuming inside its production possibilities boundary.
C) import those goods which are acquired more cheaply through trade than through domestic production.
D) expect a decrease in the average standard of living, but will see increased profits for firms in the export business.
E) experience an increase in its average standard of living only if it begins with an absolute advantage in the production of all goods.
فتح الحزمة
افتح القفل للوصول البطاقات البالغ عددها 127 في هذه المجموعة.
فتح الحزمة
k this deck
37
Consider the following information about the production of two goods, X and Y, in two countries, A and B:
∙ In Country A it takes Xa units of resources to produce one unit of X and Ya units of resources to produce one unit of Y.
∙ In Country B it takes Xb units of resources to produce one unit of X and Yb units of resources to produce one unit of Y.
∙ Assume the amount of resources used to produce the goods in the two countries can be compared unambiguously.
TABLE 32-1
If two nations want to trade with one another, they can determine their respective comparative advantages by
A) hiring economists to gather and interpret the relevant data.
B) first determining which has absolute advantage in the production of goods and services.
C) allowing firms in each country to freely engage in international trade.
D) making certain that the prices of tradable goods and services are equal in both nations.
E) computing the opportunity costs of all goods and services.
فتح الحزمة
افتح القفل للوصول البطاقات البالغ عددها 127 في هذه المجموعة.
فتح الحزمة
k this deck
38
Suppose Spain is currently producing 90 units of wine and 10 units of cheese, but to produce 10 more units of cheese it must sacrifice 30 units of wine. Further, suppose that Portugal produces 45 units of wine and 45 units of cheese, but to produce 10 more units of cheese it must sacrifice only 10 units of wine. What is the pattern of absolute advantage between Spain and Portugal?
A) Portugal has an absolute advantage in both wine and cheese production.
B) Portugal has an absolute advantage in wine production and Spain has an absolute advantage in cheese production.
C) Spain has an absolute advantage in both wine and cheese production.
D) neither country has an absolute advantage in the production of either wine or cheese.
E) more information is needed to conclude anything about absolute advantage in either country.
فتح الحزمة
افتح القفل للوصول البطاقات البالغ عددها 127 في هذه المجموعة.
فتح الحزمة
k this deck
39
Ireland and Japan are assumed to produce only wool and steel, to have full employment and complete mobility of resources between industries. Their production possibilities boundaries before trade are drawn in solid lines. It is assumed that the two countries have the same amount of resources. Their consumption possibilities after trade are shown by the dotted lines. The outputs of wool and steel are given in physical units.
FIGURE 32-1
Refer to Figure 32-1. When trade between Ireland and Japan begins, the probable trade pattern is to
A) export wool from Ireland to Japan and steel from Japan to Ireland.
B) export wool from Japan to Ireland and steel from Ireland to Japan.
C) export both wool and steel from Ireland to Japan.
D) export both wool and steel from Japan to Ireland.
E) impose tariffs on both goods in both countries.
FIGURE 32-1Refer to Figure 32-1. When trade between Ireland and Japan begins, the probable trade pattern is to
A) export wool from Ireland to Japan and steel from Japan to Ireland.
B) export wool from Japan to Ireland and steel from Ireland to Japan.
C) export both wool and steel from Ireland to Japan.
D) export both wool and steel from Japan to Ireland.
E) impose tariffs on both goods in both countries.
فتح الحزمة
افتح القفل للوصول البطاقات البالغ عددها 127 في هذه المجموعة.
فتح الحزمة
k this deck
40
Ireland and Japan are assumed to produce only wool and steel, to have full employment and complete mobility of resources between industries. Their production possibilities boundaries before trade are drawn in solid lines. It is assumed that the two countries have the same amount of resources. Their consumption possibilities after trade are shown by the dotted lines. The outputs of wool and steel are given in physical units.
FIGURE 32-1
Refer to Figure 32-1. Before any trade takes place, the opportunity cost of a unit of steel is
A) 3/4 unit of wool in Ireland; 3/8 unit of wool in Japan.
B) 4/3 unit of wool in Ireland; 8/3 unit of wool in Japan.
C) 3 units of wool in Ireland; 3 units of wool in Japan.
D) 4 units of wool in Ireland; 8 units of wool in Japan.
E) 4 units of wool in Ireland; 4 units of wool in Japan.
FIGURE 32-1Refer to Figure 32-1. Before any trade takes place, the opportunity cost of a unit of steel is
A) 3/4 unit of wool in Ireland; 3/8 unit of wool in Japan.
B) 4/3 unit of wool in Ireland; 8/3 unit of wool in Japan.
C) 3 units of wool in Ireland; 3 units of wool in Japan.
D) 4 units of wool in Ireland; 8 units of wool in Japan.
E) 4 units of wool in Ireland; 4 units of wool in Japan.
فتح الحزمة
افتح القفل للوصول البطاقات البالغ عددها 127 في هذه المجموعة.
فتح الحزمة
k this deck
41
If two countries each produce wool and cotton, we know that the country with the comparative advantage in cotton will also have a lower
A) opportunity cost to produce wool.
B) opportunity cost to produce cotton.
C) resource input per unit produced of wool.
D) resource input per unit produced of cotton.
E) resource input per unit produced of both cotton or wool.
A) opportunity cost to produce wool.
B) opportunity cost to produce cotton.
C) resource input per unit produced of wool.
D) resource input per unit produced of cotton.
E) resource input per unit produced of both cotton or wool.
فتح الحزمة
افتح القفل للوصول البطاقات البالغ عددها 127 في هذه المجموعة.
فتح الحزمة
k this deck
42
The following production possibilities schedule shows the quantities of soybeans and oil that can each be produced in Canada and Mexico with one unit of equivalent resources.
TABLE 32-3
Refer to Table 32-3. The opportunity cost of a barrel of oil in Canada is
A) 16.67 bushels of soybeans.
B) 6 bushels of soybeans.
C) 2.5 bushels of soybeans.
D) 1.25 barrels of oil.
E) 0.8 barrels of oil.
TABLE 32-3Refer to Table 32-3. The opportunity cost of a barrel of oil in Canada is
A) 16.67 bushels of soybeans.
B) 6 bushels of soybeans.
C) 2.5 bushels of soybeans.
D) 1.25 barrels of oil.
E) 0.8 barrels of oil.
فتح الحزمة
افتح القفل للوصول البطاقات البالغ عددها 127 في هذه المجموعة.
فتح الحزمة
k this deck
43
The following production possibilities schedule shows the quantities of soybeans and oil that can each be produced in Canada and Mexico with one unit of equivalent resources.
TABLE 32-3
Refer to Table 32-3. Canada has an absolute advantage in the production of
A) soybeans.
B) oil.
C) neither soybeans nor oil.
D) both soybeans and oil.
TABLE 32-3Refer to Table 32-3. Canada has an absolute advantage in the production of
A) soybeans.
B) oil.
C) neither soybeans nor oil.
D) both soybeans and oil.
فتح الحزمة
افتح القفل للوصول البطاقات البالغ عددها 127 في هذه المجموعة.
فتح الحزمة
k this deck
44
This table shows how much cotton and cocoa can be produced in Peru and Brazil with one unit of equivalent resources.
TABLE 32-4
Refer to Table 32-4. The opportunity cost of a bushel of cocoa beans in Brazil is
A) 1/2 bale cotton.
B) 1 bale cotton.
C) 1/6 bale cotton.
D) 1/3 bale cotton.
E) 2/3 bale cotton.
TABLE 32-4Refer to Table 32-4. The opportunity cost of a bushel of cocoa beans in Brazil is
A) 1/2 bale cotton.
B) 1 bale cotton.
C) 1/6 bale cotton.
D) 1/3 bale cotton.
E) 2/3 bale cotton.
فتح الحزمة
افتح القفل للوصول البطاقات البالغ عددها 127 في هذه المجموعة.
فتح الحزمة
k this deck
45
This table shows how much cotton and cocoa can be produced in Peru and Brazil with one unit of equivalent resources.
TABLE 32-4
Refer to Table 32-4. The opportunity cost of a bushel of cocoa beans in Peru is
A) 1/2 bale cotton.
B) 1 bale cotton.
C) 1/6 bale cotton.
D) 1/3 bale cotton.
E) 2/3 bale cotton.
TABLE 32-4Refer to Table 32-4. The opportunity cost of a bushel of cocoa beans in Peru is
A) 1/2 bale cotton.
B) 1 bale cotton.
C) 1/6 bale cotton.
D) 1/3 bale cotton.
E) 2/3 bale cotton.
فتح الحزمة
افتح القفل للوصول البطاقات البالغ عددها 127 في هذه المجموعة.
فتح الحزمة
k this deck
46
This table shows how much cotton and cocoa can be produced in Peru and Brazil with one unit of equivalent resources.
TABLE 32-4
Refer to Table 32-4. The opportunity cost of a bale of cotton in Peru is
A) 1/6 bushel of cocoa beans.
B) 1/2 bushel of cocoa beans.
C) 2/3 bushel of cocoa beans.
D) 2 bushels of cocoa beans.
E) 4 bushels of cocoa beans.
TABLE 32-4Refer to Table 32-4. The opportunity cost of a bale of cotton in Peru is
A) 1/6 bushel of cocoa beans.
B) 1/2 bushel of cocoa beans.
C) 2/3 bushel of cocoa beans.
D) 2 bushels of cocoa beans.
E) 4 bushels of cocoa beans.
فتح الحزمة
افتح القفل للوصول البطاقات البالغ عددها 127 في هذه المجموعة.
فتح الحزمة
k this deck
47
The following production possibilities schedule shows the quantities of soybeans and oil that can each be produced in Canada and Mexico with one unit of equivalent resources.
TABLE 32-3
Refer to Table 32-3. The opportunity cost of one bushel of soybeans in Mexico is
A) 3 barrels of oil.
B) 0.33 barrels of oil.
C) 0.4 bushels of soybeans.
D) indicative of Mexicoʹs comparative advantage in soybean production.
E) lower than the opportunity cost of soybeans in Canada.
TABLE 32-3Refer to Table 32-3. The opportunity cost of one bushel of soybeans in Mexico is
A) 3 barrels of oil.
B) 0.33 barrels of oil.
C) 0.4 bushels of soybeans.
D) indicative of Mexicoʹs comparative advantage in soybean production.
E) lower than the opportunity cost of soybeans in Canada.
فتح الحزمة
افتح القفل للوصول البطاقات البالغ عددها 127 في هذه المجموعة.
فتح الحزمة
k this deck
48
If Country A has a comparative advantage in the production of good X relative to Country B,
A) then Country A also has an absolute advantage in the production of this good.
B) then Country A also has an absolute advantage in the production of some good other than X.
C) then the opportunity cost of producing X in Country A is higher than in Country B.
D) then the opportunity cost of producing X in Country A is lower than in Country B.
E) we do not have enough information to say anything about relative opportunity costs.
فتح الحزمة
افتح القفل للوصول البطاقات البالغ عددها 127 في هذه المجموعة.
فتح الحزمة
k this deck
49
The following production possibilities schedule shows the quantities of wheat and rice that can be produced in Canada and India with one unit of equivalent resources.
TABLE 32-2
Refer to Table 32-2. India has an absolute advantage in the production of
A) rice.
B) wheat.
C) both rice and wheat.
D) neither rice nor wheat.
TABLE 32-2Refer to Table 32-2. India has an absolute advantage in the production of
A) rice.
B) wheat.
C) both rice and wheat.
D) neither rice nor wheat.
فتح الحزمة
افتح القفل للوصول البطاقات البالغ عددها 127 في هذه المجموعة.
فتح الحزمة
k this deck
50
This table shows how much cotton and cocoa can be produced in Peru and Brazil with one unit of equivalent resources.
TABLE 32-4
Refer to Table 32-4. Compared with Peru, Brazil has
A) a comparative but not absolute advantage in the production of cocoa beans.
B) an absolute and a comparative advantage in the production of cocoa beans.
C) an absolute, but not a comparative, advantage in the production of cocoa beans.
D) an absolute advantage in the production of cotton.
E) an absolute and a comparative advantage in the production of cotton.
TABLE 32-4Refer to Table 32-4. Compared with Peru, Brazil has
A) a comparative but not absolute advantage in the production of cocoa beans.
B) an absolute and a comparative advantage in the production of cocoa beans.
C) an absolute, but not a comparative, advantage in the production of cocoa beans.
D) an absolute advantage in the production of cotton.
E) an absolute and a comparative advantage in the production of cotton.
فتح الحزمة
افتح القفل للوصول البطاقات البالغ عددها 127 في هذه المجموعة.
فتح الحزمة
k this deck
51
This table shows how much cotton and cocoa can be produced in Peru and Brazil with one unit of equivalent resources.
TABLE 32-4
Refer to Table 32-4. The opportunity cost of a bale of cotton in Brazil is
A) 4 bushels of cocoa beans.
B) 6 bushels of cocoa beans.
C) 1/6 bushels of cocoa beans.
D) 1 bushel of cocoa beans.
E) 2 bushels of cocoa beans.
TABLE 32-4Refer to Table 32-4. The opportunity cost of a bale of cotton in Brazil is
A) 4 bushels of cocoa beans.
B) 6 bushels of cocoa beans.
C) 1/6 bushels of cocoa beans.
D) 1 bushel of cocoa beans.
E) 2 bushels of cocoa beans.
فتح الحزمة
افتح القفل للوصول البطاقات البالغ عددها 127 في هذه المجموعة.
فتح الحزمة
k this deck
52
If two countries each produce wool and cotton, the country with the higher opportunity cost for cotton in terms of wool) will also have
A) a comparative advantage in the production of wool.
B) a comparative advantage in the production of cotton.
C) an absolute advantage in the production of wool.
D) an absolute advantage in the production of cotton.
E) an absolute advantage in the production of both wool and cotton.
A) a comparative advantage in the production of wool.
B) a comparative advantage in the production of cotton.
C) an absolute advantage in the production of wool.
D) an absolute advantage in the production of cotton.
E) an absolute advantage in the production of both wool and cotton.
فتح الحزمة
افتح القفل للوصول البطاقات البالغ عددها 127 في هذه المجموعة.
فتح الحزمة
k this deck
53
The concept of comparative advantage in international trade is based on as opposed to absolute costs.
A) relative prices
B) absolute prices
C) opportunity costs
D) average cost
E) total cost
A) relative prices
B) absolute prices
C) opportunity costs
D) average cost
E) total cost
فتح الحزمة
افتح القفل للوصول البطاقات البالغ عددها 127 في هذه المجموعة.
فتح الحزمة
k this deck
54
The following production possibilities schedule shows the quantities of wheat and rice that can be produced in Canada and India with one unit of equivalent resources.
TABLE 32-2
Refer to Table 32-2. To achieve the potential gains from international trade,
A) India should export wheat to Canada and import Canadian rice.
B) Canada should produce both wheat and rice and not trade with India.
C) India should export rice to Canada and import Canadian wheat.
D) India should exclude wheat from its consumption.
E) India should produce both wheat and rice and not trade with Canada.
TABLE 32-2Refer to Table 32-2. To achieve the potential gains from international trade,
A) India should export wheat to Canada and import Canadian rice.
B) Canada should produce both wheat and rice and not trade with India.
C) India should export rice to Canada and import Canadian wheat.
D) India should exclude wheat from its consumption.
E) India should produce both wheat and rice and not trade with Canada.
فتح الحزمة
افتح القفل للوصول البطاقات البالغ عددها 127 في هذه المجموعة.
فتح الحزمة
k this deck
55
The following production possibilities schedule shows the quantities of wheat and rice that can be produced in Canada and India with one unit of equivalent resources.
TABLE 32-2
Refer to Table 32-2. If Canada were to transfer one unit of resources from rice to wheat production and if one unit of Indian resources were switched from wheat to rice production,
A) total wheat production would go up by 7 bushels.
B) total rice production would increase by 18 bushels.
C) total wheat production would be decreased by 13 bushels.
D) total rice output would decrease by 8 bushels.
E) both total wheat and total rice production would go up by 7 bushels.
TABLE 32-2Refer to Table 32-2. If Canada were to transfer one unit of resources from rice to wheat production and if one unit of Indian resources were switched from wheat to rice production,
A) total wheat production would go up by 7 bushels.
B) total rice production would increase by 18 bushels.
C) total wheat production would be decreased by 13 bushels.
D) total rice output would decrease by 8 bushels.
E) both total wheat and total rice production would go up by 7 bushels.
فتح الحزمة
افتح القفل للوصول البطاقات البالغ عددها 127 في هذه المجموعة.
فتح الحزمة
k this deck
56
The following production possibilities schedule shows the quantities of soybeans and oil that can each be produced in Canada and Mexico with one unit of equivalent resources.
TABLE 32-3
Refer to Table 32-3. The opportunity cost of a barrel of oil in Mexico is
A) 0.33 bushels of soybeans.
B) 1.25 barrels of oil.
C) 0.8 barrels of oil.
D) 3 bushels of soybeans.
E) 16 bushels of soybeans.
TABLE 32-3Refer to Table 32-3. The opportunity cost of a barrel of oil in Mexico is
A) 0.33 bushels of soybeans.
B) 1.25 barrels of oil.
C) 0.8 barrels of oil.
D) 3 bushels of soybeans.
E) 16 bushels of soybeans.
فتح الحزمة
افتح القفل للوصول البطاقات البالغ عددها 127 في هذه المجموعة.
فتح الحزمة
k this deck
57
The following production possibilities schedule shows the quantities of soybeans and oil that can each be produced in Canada and Mexico with one unit of equivalent resources.
TABLE 32-3
Refer to Table 32-3. If Canada were to transfer half a unit of resources from oil to soybeans and Mexico were to transfer one unit of resources from soybeans to oil, the effect on the total output of the two countries would be as follows:
A) soybean production would increase by 30 bushels.
B) soybean production would increase by 6 bushels and oil production would increase by 3 barrels.
C) soybean production would increase by 36 bushels and oil production would decrease by 2 barrels.
D) oil production would increase by 8 barrels.
E) soybean production would increase by 6 bushels and oil production would increase by 2.02 barrels.
TABLE 32-3Refer to Table 32-3. If Canada were to transfer half a unit of resources from oil to soybeans and Mexico were to transfer one unit of resources from soybeans to oil, the effect on the total output of the two countries would be as follows:
A) soybean production would increase by 30 bushels.
B) soybean production would increase by 6 bushels and oil production would increase by 3 barrels.
C) soybean production would increase by 36 bushels and oil production would decrease by 2 barrels.
D) oil production would increase by 8 barrels.
E) soybean production would increase by 6 bushels and oil production would increase by 2.02 barrels.
فتح الحزمة
افتح القفل للوصول البطاقات البالغ عددها 127 في هذه المجموعة.
فتح الحزمة
k this deck
58
This table shows how much cotton and cocoa can be produced in Peru and Brazil with one unit of equivalent resources.
TABLE 32-4
Refer to Table 32-4. If one unit of resources is shifted from cotton to cocoa beans in Brazil, and one unit of resources is shifted from cocoa beans to cotton in Peru, world output would increase by
A) 2 bales of cotton.
B) 1 bale of cotton and 2 bushels of cocoa beans.
C) 6 bushels of cocoa beans.
D) 3 bales of cotton and 10 bushels of cocoa beans.
E) 2 bales of cotton and 1 bushel of cocoa beans.
TABLE 32-4Refer to Table 32-4. If one unit of resources is shifted from cotton to cocoa beans in Brazil, and one unit of resources is shifted from cocoa beans to cotton in Peru, world output would increase by
A) 2 bales of cotton.
B) 1 bale of cotton and 2 bushels of cocoa beans.
C) 6 bushels of cocoa beans.
D) 3 bales of cotton and 10 bushels of cocoa beans.
E) 2 bales of cotton and 1 bushel of cocoa beans.
فتح الحزمة
افتح القفل للوصول البطاقات البالغ عددها 127 في هذه المجموعة.
فتح الحزمة
k this deck
59
The following production possibilities schedule shows the quantities of soybeans and oil that can each be produced in Canada and Mexico with one unit of equivalent resources.
TABLE 32-3
Refer to Table 32-3. Mexico would not gain by producing and exporting oil and importing soybeans unless it received
A) any quantity of soybeans.
B) 2 bushels of soybeans per barrel of oil.
C) more than 3 bushels of soybeans per barrel of oil.
D) more than 6 bushels of soybeans per barrel of oil.
E) more than 10 barrel of oil.
TABLE 32-3Refer to Table 32-3. Mexico would not gain by producing and exporting oil and importing soybeans unless it received
A) any quantity of soybeans.
B) 2 bushels of soybeans per barrel of oil.
C) more than 3 bushels of soybeans per barrel of oil.
D) more than 6 bushels of soybeans per barrel of oil.
E) more than 10 barrel of oil.
فتح الحزمة
افتح القفل للوصول البطاقات البالغ عددها 127 في هذه المجموعة.
فتح الحزمة
k this deck
60
If Country A has a comparative advantage in the production of oil relative to Country B, then
A) Country A also has an absolute advantage in producing oil.
B) Country A also has an absolute advantage in producing some good other than oil.
C) the opportunity cost of producing oil is higher in Country A than in Country B.
D) the opportunity cost of producing oil is lower in Country A than in Country B.
E) Country A when compared to Country B must have an absolute advantage in producing some good other than oil.
فتح الحزمة
افتح القفل للوصول البطاقات البالغ عددها 127 في هذه المجموعة.
فتح الحزمة
k this deck
61
The diagram below shows Robinson Crusoeʹs annual production possibilities boundary for the production of bananas and coconuts.
FIGURE 32-3
Refer to Figure 32-3. Starting from point A and moving to point B, Robinson Crusoeʹs opportunity cost of producing each additional kilogram of coconuts is
A) increasing.
B) increasing followed by decreasing.
C) constant.
D) decreasing.
E) decreasing followed by increasing.
FIGURE 32-3Refer to Figure 32-3. Starting from point A and moving to point B, Robinson Crusoeʹs opportunity cost of producing each additional kilogram of coconuts is
A) increasing.
B) increasing followed by decreasing.
C) constant.
D) decreasing.
E) decreasing followed by increasing.
فتح الحزمة
افتح القفل للوصول البطاقات البالغ عددها 127 في هذه المجموعة.
فتح الحزمة
k this deck
62
A country with a domestic market is most likely to gain from international trade, in part because of its prospects of benefitting from .
A) small; diseconomies of scale and learning by doing
B) small; economies of scale and learning by doing
C) large; a less diversified economy
D) mature; a devaluation of its currency
E) mature; a less diversified economy
A) small; diseconomies of scale and learning by doing
B) small; economies of scale and learning by doing
C) large; a less diversified economy
D) mature; a devaluation of its currency
E) mature; a less diversified economy
فتح الحزمة
افتح القفل للوصول البطاقات البالغ عددها 127 في هذه المجموعة.
فتح الحزمة
k this deck
63
The diagram below shows Robinson Crusoeʹs annual production possibilities boundary for the production of bananas and coconuts.
FIGURE 32-3
Refer to Figure 32-3. What is Robinson Crusoeʹs opportunity cost of bananas in terms of coconuts?
A) 2
B) 1
C) 1/2
D) 100
E) 200
FIGURE 32-3Refer to Figure 32-3. What is Robinson Crusoeʹs opportunity cost of bananas in terms of coconuts?
A) 2
B) 1
C) 1/2
D) 100
E) 200
فتح الحزمة
افتح القفل للوصول البطاقات البالغ عددها 127 في هذه المجموعة.
فتح الحزمة
k this deck
64
Consider the sources of the gains from international trade. Economies of scale and product differentiation can provide an explanation for
A) countries remaining at their autarkic positions.
B) countries trading in completely different products.
C) the imposition of trade barriers.
D) intra-industry trade.
E) absolute advantage.
A) countries remaining at their autarkic positions.
B) countries trading in completely different products.
C) the imposition of trade barriers.
D) intra-industry trade.
E) absolute advantage.
فتح الحزمة
افتح القفل للوصول البطاقات البالغ عددها 127 في هذه المجموعة.
فتح الحزمة
k this deck
65
The figure below shows Arcticlandʹs annual production possibilities boundary for the production of fish and ice.
FIGURE 32-4
Refer to Figure 32-4. Beginning at point A on Arcticlandʹs production possibilities boundary, the opportunity cost of producing 10 more tonnes of fish is and the opportunity cost of producing 10 more tonnes of ice is .
A) 5 tonnes of fish; 20 tonnes of ice
B) 5 tonnes of ice; 20 tonnes of fish
C) 20 tonnes of ice; 5 tonnes of fish
D) 10 tonnes of ice; 10 tonnes of fish
E) 0; 0
FIGURE 32-4Refer to Figure 32-4. Beginning at point A on Arcticlandʹs production possibilities boundary, the opportunity cost of producing 10 more tonnes of fish is and the opportunity cost of producing 10 more tonnes of ice is .
A) 5 tonnes of fish; 20 tonnes of ice
B) 5 tonnes of ice; 20 tonnes of fish
C) 20 tonnes of ice; 5 tonnes of fish
D) 10 tonnes of ice; 10 tonnes of fish
E) 0; 0
فتح الحزمة
افتح القفل للوصول البطاقات البالغ عددها 127 في هذه المجموعة.
فتح الحزمة
k this deck
66
This table shows how much wine and cheese can be produced in Spain and Portugal with one unit of equivalent resources. Initially there is no trade. Once trade opens up, transportation costs are assumed to be zero.
TABLE 32-5
Refer to Table 32-5. The comparative advantage in cheese is held by
A) Spain.
B) Portugal.
C) both countries.
D) neither country.
E) Insufficient information to know.
TABLE 32-5Refer to Table 32-5. The comparative advantage in cheese is held by
A) Spain.
B) Portugal.
C) both countries.
D) neither country.
E) Insufficient information to know.
فتح الحزمة
افتح القفل للوصول البطاقات البالغ عددها 127 في هذه المجموعة.
فتح الحزمة
k this deck
67
The figure below shows Arcticlandʹs annual production possibilities boundary for the production of fish and ice.
FIGURE 32-4
When two countries are specializing and trading with each other, the gains from trade will tend to be greater when
A) opportunity costs in the two countries are similar.
B) there are economies of scale in production.
C) prices rise in both countries.
D) the production possibilities boundaries shift inward.
E) comparative advantages are eliminated.
FIGURE 32-4When two countries are specializing and trading with each other, the gains from trade will tend to be greater when
A) opportunity costs in the two countries are similar.
B) there are economies of scale in production.
C) prices rise in both countries.
D) the production possibilities boundaries shift inward.
E) comparative advantages are eliminated.
فتح الحزمة
افتح القفل للوصول البطاقات البالغ عددها 127 في هذه المجموعة.
فتح الحزمة
k this deck
68
This table shows how much cotton and cocoa can be produced in Peru and Brazil with one unit of equivalent resources.
TABLE 32-4
Refer to Table 32-4. For trade to be advantageous to both Peru and Brazil, the number of bushels of cocoa beans that must be traded for a bale of cotton is
A) less than 2.
B) 2.
C) more than 2, but less than 6.
D) 6.
E) more than 6.
TABLE 32-4Refer to Table 32-4. For trade to be advantageous to both Peru and Brazil, the number of bushels of cocoa beans that must be traded for a bale of cotton is
A) less than 2.
B) 2.
C) more than 2, but less than 6.
D) 6.
E) more than 6.
فتح الحزمة
افتح القفل للوصول البطاقات البالغ عددها 127 في هذه المجموعة.
فتح الحزمة
k this deck
69
The figure below shows Arcticlandʹs annual production possibilities boundary for the production of fish and ice.
FIGURE 32-4
When specialization according to comparative advantage also makes economies of scale possible,
A) trade is not beneficial to the country that has the absolute advantage in both goods.
B) the production possibilities boundaries of all trading countries will shift inward.
C) there will be additional gains from trade.
D) costs will rise in all trading countries.
E) it will be beneficial for all trading countries to impose tariffs.
FIGURE 32-4When specialization according to comparative advantage also makes economies of scale possible,
A) trade is not beneficial to the country that has the absolute advantage in both goods.
B) the production possibilities boundaries of all trading countries will shift inward.
C) there will be additional gains from trade.
D) costs will rise in all trading countries.
E) it will be beneficial for all trading countries to impose tariffs.
فتح الحزمة
افتح القفل للوصول البطاقات البالغ عددها 127 في هذه المجموعة.
فتح الحزمة
k this deck
70
The diagram below shows Robinson Crusoeʹs annual production possibilities boundary for the production of bananas and coconuts.
FIGURE 32-3
Refer to Figure 32-3. Starting from point B and moving to point A, his opportunity cost of producing each additional kilogram of bananas is
A) increasing.
B) increasing followed by decreasing.
C) constant.
D) decreasing.
E) decreasing followed by increasing.
FIGURE 32-3Refer to Figure 32-3. Starting from point B and moving to point A, his opportunity cost of producing each additional kilogram of bananas is
A) increasing.
B) increasing followed by decreasing.
C) constant.
D) decreasing.
E) decreasing followed by increasing.
فتح الحزمة
افتح القفل للوصول البطاقات البالغ عددها 127 في هذه المجموعة.
فتح الحزمة
k this deck
71
The figure below shows Arcticlandʹs annual production possibilities boundary for the production of fish and ice.
FIGURE 32-4
Refer to Figure 32-4. Starting from point A and moving to point B, the opportunity cost of producing each additional tonne of ice is
A) increasing.
B) increasing followed by decreasing.
C) constant.
D) decreasing.
E) decreasing followed by increasing.
FIGURE 32-4Refer to Figure 32-4. Starting from point A and moving to point B, the opportunity cost of producing each additional tonne of ice is
A) increasing.
B) increasing followed by decreasing.
C) constant.
D) decreasing.
E) decreasing followed by increasing.
فتح الحزمة
افتح القفل للوصول البطاقات البالغ عددها 127 في هذه المجموعة.
فتح الحزمة
k this deck
72
This table shows how much wine and cheese can be produced in Spain and Portugal with one unit of equivalent resources. Initially there is no trade. Once trade opens up, transportation costs are assumed to be zero.
TABLE 32-5
Refer to Table 32-5. The comparative advantage in wine is held by
A) Spain.
B) Portugal.
C) both countries.
D) neither country.
E) Insufficient information to determine the answer.
TABLE 32-5Refer to Table 32-5. The comparative advantage in wine is held by
A) Spain.
B) Portugal.
C) both countries.
D) neither country.
E) Insufficient information to determine the answer.
فتح الحزمة
افتح القفل للوصول البطاقات البالغ عددها 127 في هذه المجموعة.
فتح الحزمة
k this deck
73
North America exports clothing to the European Union, and the European Union exports clothing to North America. This is an)
A) violation of the law of comparative advantage.
B) obvious failure to take advantage of specialization.
C) likely result of economies of scale and product differentiation.
D) general conclusion of the Heckscher-Ohlin theory.
E) example of the inefficiency of trade patterns.
A) violation of the law of comparative advantage.
B) obvious failure to take advantage of specialization.
C) likely result of economies of scale and product differentiation.
D) general conclusion of the Heckscher-Ohlin theory.
E) example of the inefficiency of trade patterns.
فتح الحزمة
افتح القفل للوصول البطاقات البالغ عددها 127 في هذه المجموعة.
فتح الحزمة
k this deck
74
The diagram below shows Robinson Crusoeʹs annual production possibilities boundary for the production of bananas and coconuts.
FIGURE 32-3
Refer to Figure 32-3. What is Robinson Crusoeʹs opportunity cost of coconuts in terms of bananas?
A) 2
B) 1
C) 1/2
D) 100
E) 200
FIGURE 32-3Refer to Figure 32-3. What is Robinson Crusoeʹs opportunity cost of coconuts in terms of bananas?
A) 2
B) 1
C) 1/2
D) 100
E) 200
فتح الحزمة
افتح القفل للوصول البطاقات البالغ عددها 127 في هذه المجموعة.
فتح الحزمة
k this deck
75
This table shows how much wine and cheese can be produced in Spain and Portugal with one unit of equivalent resources. Initially there is no trade. Once trade opens up, transportation costs are assumed to be zero.
TABLE 32-5
Refer to Table 32-5. The opportunity cost of cheese in terms of wine is
A) 1/4 in Spain.
B) 4 in Spain.
C) 2 in each country.
D) 3/2 in Portugal.
E) 3 in Portugal.
TABLE 32-5Refer to Table 32-5. The opportunity cost of cheese in terms of wine is
A) 1/4 in Spain.
B) 4 in Spain.
C) 2 in each country.
D) 3/2 in Portugal.
E) 3 in Portugal.
فتح الحزمة
افتح القفل للوصول البطاقات البالغ عددها 127 في هذه المجموعة.
فتح الحزمة
k this deck
76
International trade permits a country to
A) produce and consume beyond its production possibilities boundary.
B) shift its production possibilities boundary outward.
C) increase its absolute advantage for its imported goods.
D) expand its production possibilities while holding constant its consumption possibilities.
E) consume beyond its production possibilities boundary.
فتح الحزمة
افتح القفل للوصول البطاقات البالغ عددها 127 في هذه المجموعة.
فتح الحزمة
k this deck
77
This table shows how much wine and cheese can be produced in Spain and Portugal with one unit of equivalent resources. Initially there is no trade. Once trade opens up, transportation costs are assumed to be zero.
TABLE 32-5
Refer to Table 32-5. Once Spain and Portugal begin to trade cheese and wine,
A) some resources will be permanently unemployed in Portugal.
B) it will be beneficial for Portugal to ban the import of cheese.
C) it will be beneficial for Spain to ban the import of wine.
D) the opportunity cost of the goods they now import will be less than when there was no trade, but for Portugal only.
E) the opportunity cost of the goods they now import will be less than when there was no trade, for both countries.
TABLE 32-5Refer to Table 32-5. Once Spain and Portugal begin to trade cheese and wine,
A) some resources will be permanently unemployed in Portugal.
B) it will be beneficial for Portugal to ban the import of cheese.
C) it will be beneficial for Spain to ban the import of wine.
D) the opportunity cost of the goods they now import will be less than when there was no trade, but for Portugal only.
E) the opportunity cost of the goods they now import will be less than when there was no trade, for both countries.
فتح الحزمة
افتح القفل للوصول البطاقات البالغ عددها 127 في هذه المجموعة.
فتح الحزمة
k this deck
78
The figure below shows Arcticlandʹs annual production possibilities boundary for the production of fish and ice.
FIGURE 32-4
In addition to realizing the benefits of specialization according to comparative advantage, a nation that engages in international trade and specialization may realize benefits from
A) economies of scale and learning by doing.
B) diseconomies of scale and learning by doing.
C) learning by doing and increased opportunity costs.
D) a devaluation of its currency.
E) a less diversified economy.
FIGURE 32-4In addition to realizing the benefits of specialization according to comparative advantage, a nation that engages in international trade and specialization may realize benefits from
A) economies of scale and learning by doing.
B) diseconomies of scale and learning by doing.
C) learning by doing and increased opportunity costs.
D) a devaluation of its currency.
E) a less diversified economy.
فتح الحزمة
افتح القفل للوصول البطاقات البالغ عددها 127 في هذه المجموعة.
فتح الحزمة
k this deck
79
Consider the sources of the gains from international trade. Economies of scale and product differentiation can provide an explanation for
A) countries remaining at their autarkic positions.
B) countries trading in completely different products.
C) countries trading in similar products.
D) firms seeking government intervention to protect their industries.
E) firms seeking government approval of mergers.
A) countries remaining at their autarkic positions.
B) countries trading in completely different products.
C) countries trading in similar products.
D) firms seeking government intervention to protect their industries.
E) firms seeking government approval of mergers.
فتح الحزمة
افتح القفل للوصول البطاقات البالغ عددها 127 في هذه المجموعة.
فتح الحزمة
k this deck
80
The figure below shows Arcticlandʹs annual production possibilities boundary for the production of fish and ice.
FIGURE 32-4
According to David Ricardoʹs principle of comparative advantage, there will be gains from international trade
A) only by a country with an absolute advantage in the production of some commodity.
B) only by developed countries.
C) by any trading country with opportunity costs similar to other countries.
D) by only one country if opportunity costs are identical across countries.
E) by any country with opportunity costs different from other countries.
FIGURE 32-4According to David Ricardoʹs principle of comparative advantage, there will be gains from international trade
A) only by a country with an absolute advantage in the production of some commodity.
B) only by developed countries.
C) by any trading country with opportunity costs similar to other countries.
D) by only one country if opportunity costs are identical across countries.
E) by any country with opportunity costs different from other countries.
فتح الحزمة
افتح القفل للوصول البطاقات البالغ عددها 127 في هذه المجموعة.
فتح الحزمة
k this deck
فتح الحزمة
افتح القفل للوصول البطاقات البالغ عددها 127 في هذه المجموعة.


