Deck 3: Demand, Supply, and Price
ملء الشاشة (f)
سؤال
سؤال
سؤال
سؤال
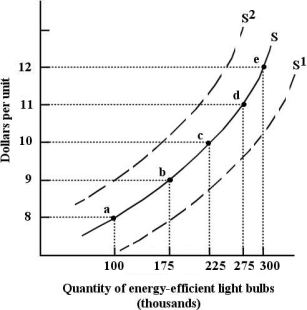 FIGURE 3- 2
Refer to Figure 3- 2. If the supply curve is given by S, the energy- efficient light bulbs is 175 000 when the price is $9.
A) quantity purchased of
B) quantity sold of
C) supply schedule for
D) quantity supplied of
E) supply of
سؤال
سؤال
سؤال
سؤال
سؤال
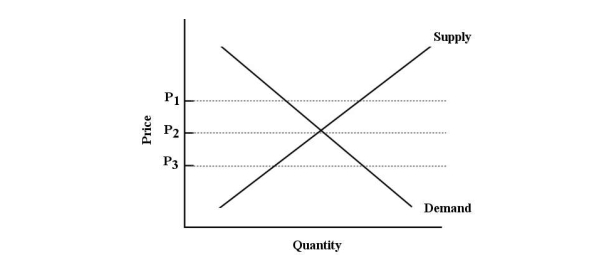 FIGURE 3- 5
Refer to Figure 3- 5. If supply were to increase, this would lead to
A) an increase in both P and Q.
B) an increase in P and a decrease in Q.
C) a decrease in both P and Q.
D) no change in P or Q.
E) a decrease in P and an increase in Q.
سؤال
سؤال
سؤال
 FIGURE 3- 1
Refer to Figure 3- 1. A shift of the demand curve for energy- efficient light bulbs from D to D2 could be caused by
A) an increase in the price of ordinary light bulbs.
B) a change in preferences away from ordinary bulbs to energy- efficient bulbs.
C) a news bulletin stating that energy- efficient light bulbs emit a harmful gas.
D) a decrease in the price of energy- efficient light bulbs.
E) an expectation that new government regulation will require the use of energy- efficient light bulbs only.
سؤال
سؤال
سؤال
سؤال
سؤال
سؤال
سؤال
 FIGURE 3- 1
Refer to Figure 3- 1. A shift of the demand curve for energy- efficient light bulbs from D to D1 could be caused by
A) a change in preferences toward ordinary light bulbs.
B) a decrease in the price of energy- efficient light bulbs.
C) a decrease in the price of ordinary light bulbs.
D) a news bulletin stating that energy- efficient light bulbs emit a harmful gas.
E) an expectation that government regulation will soon prohibit the use of ordinary light bulbs.
سؤال
سؤال
سؤال
سؤال
سؤال
سؤال
سؤال
سؤال
سؤال
سؤال
سؤال
سؤال
سؤال
سؤال
سؤال
سؤال
سؤال
سؤال
سؤال
 FIGURE 3- 3
Refer to Figure 3- 3. At a price of P1 there would be excess supply equal to
A) Q4 Q5
B) Q2 Q4
C) Q1 Q5
D) 0
E) Q1 Q2
سؤال
FIGURE 3- 3Refer to Figure 3- 3. At a price of P1 there is excess in the market for X and pressure for the price to .
A) demand; rise
B) supply; rise
C) supply; fall
D) demand; fall
سؤال
سؤال
سؤال
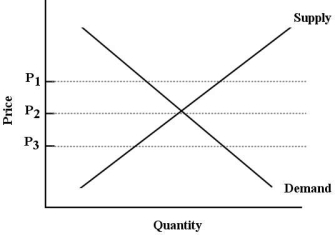 FIGURE 3- 5
Refer to Figure 3- 5. If supply and demand were to increase simultaneously, this would lead to
A) an increase in Q and an indeterminate change in P.
B) a decrease in P and in Q.
C) an increase in P and an indeterminate change in Q.
D) an increase in P and in Q.
E) no change in P or Q.
سؤال
سؤال
سؤال
سؤال
سؤال
سؤال
سؤال
سؤال
 FIGURE 3- 5
Refer to Figure 3- 5. If supply were to increase and demand were to decrease simultaneously, this would lead to
A) an increase in Q and a decrease in P.
B) a decrease in P and an indeterminate change in Q.
C) no change in P or Q.
D) an increase in Q and an increase in P.
E) a decrease in Q and an indeterminate change in P.
سؤال
سؤال
سؤال
 FIGURE 3- 6
Refer to Figure 3- 6. If the initial demand and supply curves are D1 and S1, and demand shifts to
D2, then
A) a shortage will occur at any price above P3.
B) a permanent shortage of X will result.
C) a surplus of Q1Q3 will occur.
D) if price remained at P2, a shortage of Q1Q3 would exist.
E) all of the above
سؤال
سؤال
 FIGURE 3- 6
Refer to Figure 3- 6. If the demand curve shifts from D1 to D2, while supply remains at S1, one could say that
A) there has been an increase in demand for X.
B) the price of a good which is a substitute for X must have fallen.
C) there is now an excess demand at the new price of P1.
D) the price increase has caused an increase in quantity demanded.
E) the quantity demanded has decreased to Q1 and price has fallen to P2.
سؤال
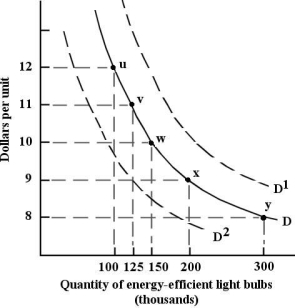 FIGURE 3- 1
Refer to Figure 3- 1. If demand is given by the curve D, the energy- efficient light bulbs is 200 000 at a price of $9.
A) demand for
B) quantity sold of
C) demand schedule for
D) quantity demanded of
E) quantity purchased of
سؤال
سؤال
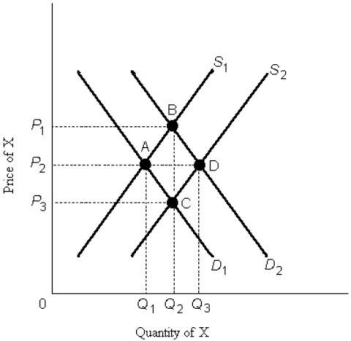 FIGURE 3- 6
Refer to Figure 3- 6. A shift in the supply curve from S2 to S1 might be caused by
A) a decrease in demand for X.
B) an improvement in the technology of producing good X.
C) additional suppliers entering the industry.
D) a rise in the costs of producing good X.
E) a decrease in the price of X.
سؤال
سؤال
سؤال
سؤال
 FIGURE 3- 5
Refer to Figure 3- 5. A price at which there would be a surplus in this market is
A) P1.
B) P2.
C) P3.
D) both P1 and P2.
E) both P1 and P3.
سؤال
سؤال
سؤال
سؤال
سؤال
سؤال
سؤال
سؤال
سؤال
سؤال
سؤال
سؤال
سؤال
سؤال
سؤال
سؤال
سؤال
 FIGURE 3- 2
Refer to Figure 3- 2. A shift of the supply curve for energy- efficient light bulbs from S to S2 could be caused by
A) a change in preferences toward energy- efficient light bulbs.
B) the elimination of government subsidies to suppliers of energy- efficient light bulbs.
C) an increase in the number of suppliers.
D) a decrease in the price of energy- efficient light bulbs.
E) an increase in the price of energy- efficient light bulbs.
سؤال

فتح الحزمة
قم بالتسجيل لفتح البطاقات في هذه المجموعة!
Unlock Deck
Unlock Deck
1/134
العب
ملء الشاشة (f)
Deck 3: Demand, Supply, and Price
1
A decrease in supply
A) has the same meaning as "a decrease in quantity supplied."
B) refers to a drop in the quantity actually exchanged.
C) is likely to result from a decrease in the price of a factor of production.
D) refers to a leftward shift in the supply curve.
E) refers to a downward movement along a supply curve.
D
2
The "law of demand" hypothesizes that, other things being equal,
A) price and demand vary inversely.
B) the lower the price, the greater the demand.
C) price and quantity demanded are positively related.
D) the higher the price, the lower the quantity demanded.
E) the higher the income, the higher the quantity demanded.
A) price and demand vary inversely.
B) the lower the price, the greater the demand.
C) price and quantity demanded are positively related.
D) the higher the price, the lower the quantity demanded.
E) the higher the income, the higher the quantity demanded.
D
3
The supply and demand schedules for dozens of roses are given below:
-Refer to Table 3- 1. How many dozens of roses would actually be purchased if the price in this market were $10?
A) 500
B) 300
C) 400
D) 350
E) 200
-Refer to Table 3- 1. How many dozens of roses would actually be purchased if the price in this market were $10?
A) 500
B) 300
C) 400
D) 350
E) 200
200
4
FIGURE 3- 2Refer to Figure 3- 2. If the supply curve is given by S, the energy- efficient light bulbs is 175 000 when the price is $9.
A) quantity purchased of
B) quantity sold of
C) supply schedule for
D) quantity supplied of
E) supply of
فتح الحزمة
افتح القفل للوصول البطاقات البالغ عددها 134 في هذه المجموعة.
فتح الحزمة
k this deck
5
Suppose the demand curves for goods A, B, and C have the following functional forms, where Q denotes quantity demanded, P denotes price, and M denotes income:
QA = 120 - 3.5PA - 6PB + 14M QB= 100 - 2PB + 3PC + 1.1M QC = 1500 - 0.5PC - 300M.
Based on these demand curves, which of the following goods are known to be inferior goods?
A) A
B) B
C) C
D) A and B only
E) A, B and C
QA = 120 - 3.5PA - 6PB + 14M QB= 100 - 2PB + 3PC + 1.1M QC = 1500 - 0.5PC - 300M.
Based on these demand curves, which of the following goods are known to be inferior goods?
A) A
B) B
C) C
D) A and B only
E) A, B and C
فتح الحزمة
افتح القفل للوصول البطاقات البالغ عددها 134 في هذه المجموعة.
فتح الحزمة
k this deck
6
The table below displays hypothetical demand and supply schedules for the market for overnight parcel deliveries in Canada.
-Refer to Table 3- 3. Which of the following statements describes a likely event in the market for overnight parcel delivery? From Year 1 to Year 2,
A) the price of regular parcel delivery decreased.
B) the government introduced a subsidy for overnight parcel delivery.
C) consumer preferences changed toward a desire for faster delivery.
D) the number of suppliers of overnight parcel delivery service increased.
E) there was a decrease in the price of jet fuel.
فتح الحزمة
افتح القفل للوصول البطاقات البالغ عددها 134 في هذه المجموعة.
فتح الحزمة
k this deck
7
Economists say there has been a change in demand when there is
A) a price change.
B) a movement along the demand curve.
C) a shift of the supply curve.
D) a shift of the demand curve.
E) a quantity change.
A) a price change.
B) a movement along the demand curve.
C) a shift of the supply curve.
D) a shift of the demand curve.
E) a quantity change.
فتح الحزمة
افتح القفل للوصول البطاقات البالغ عددها 134 في هذه المجموعة.
فتح الحزمة
k this deck
8
The supply and demand schedules for the umbrella market are given below:
-Refer to Table 3- 2. What number of umbrellas would actually be purchased if the price in this market were $10?
A) 700
B) 650
C) 400
D) 500
E) 550
-Refer to Table 3- 2. What number of umbrellas would actually be purchased if the price in this market were $10?
A) 700
B) 650
C) 400
D) 500
E) 550
فتح الحزمة
افتح القفل للوصول البطاقات البالغ عددها 134 في هذه المجموعة.
فتح الحزمة
k this deck
9
FIGURE 3- 5Refer to Figure 3- 5. If supply were to increase, this would lead to
A) an increase in both P and Q.
B) an increase in P and a decrease in Q.
C) a decrease in both P and Q.
D) no change in P or Q.
E) a decrease in P and an increase in Q.
فتح الحزمة
افتح القفل للوصول البطاقات البالغ عددها 134 في هذه المجموعة.
فتح الحزمة
k this deck
10
Suppose we observe an increase in the price of good A and an increase in the quantity of good A exchanged. Which of the following is a likely explanation?
A) The supply of good A has increased.
B) The "law of supply" is violated.
C) The "law of demand" is violated.
D) The demand for good A has increased.
E) There is an excess supply of good A.
A) The supply of good A has increased.
B) The "law of supply" is violated.
C) The "law of demand" is violated.
D) The demand for good A has increased.
E) There is an excess supply of good A.
فتح الحزمة
افتح القفل للوصول البطاقات البالغ عددها 134 في هذه المجموعة.
فتح الحزمة
k this deck
11
If the legal beer- drinking age is raised from 18 to 21, the changes to the equilibrium price and quantity of beer are likely to be that
A) price falls and quantity rises.
B) price rises and quantity rises.
C) no change in price or quantity occurs.
D) price rises and quantity falls.
E) price falls and quantity falls.
A) price falls and quantity rises.
B) price rises and quantity rises.
C) no change in price or quantity occurs.
D) price rises and quantity falls.
E) price falls and quantity falls.
فتح الحزمة
افتح القفل للوصول البطاقات البالغ عددها 134 في هذه المجموعة.
فتح الحزمة
k this deck
12
FIGURE 3- 1Refer to Figure 3- 1. A shift of the demand curve for energy- efficient light bulbs from D to D2 could be caused by
A) an increase in the price of ordinary light bulbs.
B) a change in preferences away from ordinary bulbs to energy- efficient bulbs.
C) a news bulletin stating that energy- efficient light bulbs emit a harmful gas.
D) a decrease in the price of energy- efficient light bulbs.
E) an expectation that new government regulation will require the use of energy- efficient light bulbs only.
فتح الحزمة
افتح القفل للوصول البطاقات البالغ عددها 134 في هذه المجموعة.
فتح الحزمة
k this deck
13
Which of the following pairs of goods are likely to be substitutes for a large group of consumers?
A) eggs and toast
B) green beans and peas
C) coffee and cream
D) pancakes and syrup
E) wieners and buns
A) eggs and toast
B) green beans and peas
C) coffee and cream
D) pancakes and syrup
E) wieners and buns
فتح الحزمة
افتح القفل للوصول البطاقات البالغ عددها 134 في هذه المجموعة.
فتح الحزمة
k this deck
14
If a demand curve and a supply curve can be stated functionally as Qd = 100 - 5P; and Qs = 90 +
5P, respectively, then the equilibrium quantity and price (Q, P) would be
A) 190; 10.
B) 190; 1.
C) 95; 1.
D) 95; 10
E) 1; 95.
5P, respectively, then the equilibrium quantity and price (Q, P) would be
A) 190; 10.
B) 190; 1.
C) 95; 1.
D) 95; 10
E) 1; 95.
فتح الحزمة
افتح القفل للوصول البطاقات البالغ عددها 134 في هذه المجموعة.
فتح الحزمة
k this deck
15
Consider cars and gasoline. Other things being equal, when the price of cars decreases, the demand for gasoline is likely to
A) decrease because the two goods are complements.
B) remain unchanged because cars and gasoline are two distinct markets.
C) remain unchanged.
D) remain unchanged because cars and gasoline are produced independently of one another.
E) increase because the two goods are complements.
A) decrease because the two goods are complements.
B) remain unchanged because cars and gasoline are two distinct markets.
C) remain unchanged.
D) remain unchanged because cars and gasoline are produced independently of one another.
E) increase because the two goods are complements.
فتح الحزمة
افتح القفل للوصول البطاقات البالغ عددها 134 في هذه المجموعة.
فتح الحزمة
k this deck
16
A left ward shift in the supply curve indicates
A) a decrease in the quantity supplied at each price.
B) that an increase in income results in an increase in the quantity demanded at each price.
C) that more is demanded at each price.
D) that more suppliers have entered the industry.
E) an increase in the quantity supplied at each price.
A) a decrease in the quantity supplied at each price.
B) that an increase in income results in an increase in the quantity demanded at each price.
C) that more is demanded at each price.
D) that more suppliers have entered the industry.
E) an increase in the quantity supplied at each price.
فتح الحزمة
افتح القفل للوصول البطاقات البالغ عددها 134 في هذه المجموعة.
فتح الحزمة
k this deck
17
If the price of tea falls and as a consequence the demand for sugar rises, then tea and sugar are
A) luxury goods.
B) independent goods.
C) complementary goods.
D) neutral goods.
E) substitute goods.
A) luxury goods.
B) independent goods.
C) complementary goods.
D) neutral goods.
E) substitute goods.
فتح الحزمة
افتح القفل للوصول البطاقات البالغ عددها 134 في هذه المجموعة.
فتح الحزمة
k this deck
18
Excess demand is the same thing as
A) the area to the left of the equilibrium price on a supply and demand diagram.
B) quantity demanded exceeding quantity supplied.
C) quantity supplied exceeding quantity demanded.
D) excess supply.
E) the area to the right of the equilibrium price on a supply and demand diagram.
A) the area to the left of the equilibrium price on a supply and demand diagram.
B) quantity demanded exceeding quantity supplied.
C) quantity supplied exceeding quantity demanded.
D) excess supply.
E) the area to the right of the equilibrium price on a supply and demand diagram.
فتح الحزمة
افتح القفل للوصول البطاقات البالغ عددها 134 في هذه المجموعة.
فتح الحزمة
k this deck
19
FIGURE 3- 1Refer to Figure 3- 1. A shift of the demand curve for energy- efficient light bulbs from D to D1 could be caused by
A) a change in preferences toward ordinary light bulbs.
B) a decrease in the price of energy- efficient light bulbs.
C) a decrease in the price of ordinary light bulbs.
D) a news bulletin stating that energy- efficient light bulbs emit a harmful gas.
E) an expectation that government regulation will soon prohibit the use of ordinary light bulbs.
فتح الحزمة
افتح القفل للوصول البطاقات البالغ عددها 134 في هذه المجموعة.
فتح الحزمة
k this deck
20
Which of the following would cause a movement along the demand curve for ski- lift tickets, other things being equal?
A) an increase in price as the supply curve for lift tickets shifts to the left
B) a change in tastes in favour of skiing
C) a rise in average household income
D) a rise in the price of ski boots and skis
E) an increase in population
A) an increase in price as the supply curve for lift tickets shifts to the left
B) a change in tastes in favour of skiing
C) a rise in average household income
D) a rise in the price of ski boots and skis
E) an increase in population
فتح الحزمة
افتح القفل للوصول البطاقات البالغ عددها 134 في هذه المجموعة.
فتح الحزمة
k this deck
21
Suppose that the demand curves for goods A, B, and C have the following functional forms:, where Q denotes quantity demanded and P denotes price:
QA = 120 - 3.5PA - 6PB QB = 100 - 2PB + 3PC QC = 1500 - 0.5PC.
Based on these demand curves, which of the following pairs of goods are known to be substitutes?
A) A and B
B) A and C, and B and C
C) B and C
D) A and C
E) None of the pairs are substitutes.
QA = 120 - 3.5PA - 6PB QB = 100 - 2PB + 3PC QC = 1500 - 0.5PC.
Based on these demand curves, which of the following pairs of goods are known to be substitutes?
A) A and B
B) A and C, and B and C
C) B and C
D) A and C
E) None of the pairs are substitutes.
فتح الحزمة
افتح القفل للوصول البطاقات البالغ عددها 134 في هذه المجموعة.
فتح الحزمة
k this deck
22
Suppose new medical research suggests that consuming 200 grams of tofu everyday helps to prevent heart disease. Widespread knowledge of this research, other things being equal, is likely to have what impact on the market for tofu?
A) shift the whole demand curve to the left
B) there would likely be no effect.
C) movement along the demand curve to the right
D) shift the whole demand curve to the right
E) movement along the demand curve to the left
A) shift the whole demand curve to the left
B) there would likely be no effect.
C) movement along the demand curve to the right
D) shift the whole demand curve to the right
E) movement along the demand curve to the left
فتح الحزمة
افتح القفل للوصول البطاقات البالغ عددها 134 في هذه المجموعة.
فتح الحزمة
k this deck
23
A surplus exists in the market when
A) the quantity demanded exceeds the quantity supplied.
B) supply and demand are equal.
C) the quantity demanded is less than the quantity supplied.
D) the supply curve has shifted to the left.
E) the equilibrium price is too low.
A) the quantity demanded exceeds the quantity supplied.
B) supply and demand are equal.
C) the quantity demanded is less than the quantity supplied.
D) the supply curve has shifted to the left.
E) the equilibrium price is too low.
فتح الحزمة
افتح القفل للوصول البطاقات البالغ عددها 134 في هذه المجموعة.
فتح الحزمة
k this deck
24
Suppose there is a decrease in the quantity supplied of copper at each price. This change would imply
A) a shift to the left of the supply curve.
B) a shift to the right of the supply curve.
C) a movement down the supply curve.
D) a movement up the supply curve.
A) a shift to the left of the supply curve.
B) a shift to the right of the supply curve.
C) a movement down the supply curve.
D) a movement up the supply curve.
فتح الحزمة
افتح القفل للوصول البطاقات البالغ عددها 134 في هذه المجموعة.
فتح الحزمة
k this deck
25
A rise in the quantity demanded of lemons can be attributed to a
A) decline in the number of people drinking lemonade.
B) leftward shift in the supply curve of lemons.
C) rightward shift in the supply curve of lemons.
D) cold spell which makes people want less lemonade.
E) decrease in the price of artificial lemon flavouring.
A) decline in the number of people drinking lemonade.
B) leftward shift in the supply curve of lemons.
C) rightward shift in the supply curve of lemons.
D) cold spell which makes people want less lemonade.
E) decrease in the price of artificial lemon flavouring.
فتح الحزمة
افتح القفل للوصول البطاقات البالغ عددها 134 في هذه المجموعة.
فتح الحزمة
k this deck
26
A normal good is one
A) for which demand does not vary with household income.
B) that normal people consume.
C) that everyone normally consumes.
D) for which demand varies inversely with household income.
E) for which demand varies directly with household income.
A) for which demand does not vary with household income.
B) that normal people consume.
C) that everyone normally consumes.
D) for which demand varies inversely with household income.
E) for which demand varies directly with household income.
فتح الحزمة
افتح القفل للوصول البطاقات البالغ عددها 134 في هذه المجموعة.
فتح الحزمة
k this deck
27
The table below displays hypothetical demand and supply schedules for the market for overnight parcel deliveries in Canada.
-Refer to Table 3- 3. Which of the following statements describes a likely event in the market for overnight parcel delivery? From Year 1 to Year 2,
A) there was a decrease in consumers' income.
B) the number of suppliers of overnight parcel delivery service increased.
C) there was an improvement in technology for tracking overnight parcels.
D) there was a rise in the price of jet fuel.
E) the price of regular parcel delivery decreased.
فتح الحزمة
افتح القفل للوصول البطاقات البالغ عددها 134 في هذه المجموعة.
فتح الحزمة
k this deck
28
Which of the following events would cause a change in the quantity supplied of some agricultural commodity but would not cause a change in the supply of that same commodity?
A) a change in the number of suppliers of the commodity.
B) a change in the price of substitute goods.
C) a technological change.
D) a change in factor costs.
E) a change in the price of the commodity.
A) a change in the number of suppliers of the commodity.
B) a change in the price of substitute goods.
C) a technological change.
D) a change in factor costs.
E) a change in the price of the commodity.
فتح الحزمة
افتح القفل للوصول البطاقات البالغ عددها 134 في هذه المجموعة.
فتح الحزمة
k this deck
29
A fall in the price of raw milk (which is used in the production of ice cream) will
A) decrease the supply of ice cream, causing the supply curve to shift to the right.
B) have no effect on the supply curve of ice cream but cause a downward movement along the supply curve of ice cream.
C) increase the supply of ice cream, causing the supply curve of ice cream to shift to the right.
D) decrease the supply of ice cream, causing the supply curve of ice cream to shift to the left.
E) increase the supply of ice cream, causing the supply curve to shift to the left.
فتح الحزمة
افتح القفل للوصول البطاقات البالغ عددها 134 في هذه المجموعة.
فتح الحزمة
k this deck
30
The market supply curve for wooden shipping crates would shift to the right
A) if a tax is applied to shipping crates.
B) if technological conditions for the production of crates deteriorates.
C) if a government subsidy for shipping crates is withdrawn.
D) if the prices of inputs fall.
E) if suppliers leave the industry.
A) if a tax is applied to shipping crates.
B) if technological conditions for the production of crates deteriorates.
C) if a government subsidy for shipping crates is withdrawn.
D) if the prices of inputs fall.
E) if suppliers leave the industry.
فتح الحزمة
افتح القفل للوصول البطاقات البالغ عددها 134 في هذه المجموعة.
فتح الحزمة
k this deck
31
The price of one good divided by the price of another good is called a
A) ceteris paribus price.
B) absolute price.
C) marginal price.
D) relative price.
E) money price.
A) ceteris paribus price.
B) absolute price.
C) marginal price.
D) relative price.
E) money price.
فتح الحزمة
افتح القفل للوصول البطاقات البالغ عددها 134 في هذه المجموعة.
فتح الحزمة
k this deck
32
If goods X and Y are complements and the price of X falls, all other things being equal, the demand curve for Y will
A) unable to determine.
B) not shift at all.
C) shift to the left.
D) shift to the right.
A) unable to determine.
B) not shift at all.
C) shift to the left.
D) shift to the right.
فتح الحزمة
افتح القفل للوصول البطاقات البالغ عددها 134 في هذه المجموعة.
فتح الحزمة
k this deck
33
A demand curve is
A) a numerical table showing the inverse relationship between quantity demanded and price, other things being equal.
B) a timetable showing the quantity demanded at different time periods.
C) an abstract concept underlying the graph of a demand curve.
D) a functional statement of the demand relationship.
E) a graph showing the relationship between quantity demanded and the price of a commodity, other things being equal.
فتح الحزمة
افتح القفل للوصول البطاقات البالغ عددها 134 في هذه المجموعة.
فتح الحزمة
k this deck
34
The table below displays hypothetical demand and supply schedules for the market for overnight parcel deliveries in Canada.
-Refer to Table 3- 3. The equilibrium price and quantity for overnight parcel delivery in Year 2 is
And million parcels.
A) $22; 115
B) $14; 120
C) $18; 125
D) $18; 110
E) $10; 100
-Refer to Table 3- 3. The equilibrium price and quantity for overnight parcel delivery in Year 2 is
And million parcels.
A) $22; 115
B) $14; 120
C) $18; 125
D) $18; 110
E) $10; 100
فتح الحزمة
افتح القفل للوصول البطاقات البالغ عددها 134 في هذه المجموعة.
فتح الحزمة
k this deck
35
If goods X and Y are substitutes and the price of X falls, all other things being equal, the demand curve for Y will
A) shift to the left.
B) not shift at all.
C) shift to the right.
D) be indeterminate.
A) shift to the left.
B) not shift at all.
C) shift to the right.
D) be indeterminate.
فتح الحزمة
افتح القفل للوصول البطاقات البالغ عددها 134 في هذه المجموعة.
فتح الحزمة
k this deck
36
A fall in the price of potatoes, which are used in the production of french fries, will
A) lead to an increase in the supply of french fries, causing the supply curve of french fries to shift to the right.
B) lead to a decrease in the supply of french fries, causing the supply curve of french fries to shift to the left.
C) have no effect on the supply of french fries but cause a movement along the supply curve of french fries.
D) have no effect on the supply of french fries.
E) lead to a decrease in the demand for french fries.
فتح الحزمة
افتح القفل للوصول البطاقات البالغ عددها 134 في هذه المجموعة.
فتح الحزمة
k this deck
37
The supply and demand schedules for dozens of roses are given below:
-Refer to Table 3- 1. The equilibrium price for a dozen roses is .
A) $30
B) $50
C) $20
D) $40
E) $10
-Refer to Table 3- 1. The equilibrium price for a dozen roses is .
A) $30
B) $50
C) $20
D) $40
E) $10
فتح الحزمة
افتح القفل للوصول البطاقات البالغ عددها 134 في هذه المجموعة.
فتح الحزمة
k this deck
38
FIGURE 3- 3Refer to Figure 3- 3. At a price of P1 there would be excess supply equal to
A) Q4 Q5
B) Q2 Q4
C) Q1 Q5
D) 0
E) Q1 Q2
فتح الحزمة
افتح القفل للوصول البطاقات البالغ عددها 134 في هذه المجموعة.
فتح الحزمة
k this deck
39
FIGURE 3- 3Refer to Figure 3- 3. At a price of P1 there is excess in the market for X and pressure for the price to .
A) demand; rise
B) supply; rise
C) supply; fall
D) demand; fall
فتح الحزمة
افتح القفل للوصول البطاقات البالغ عددها 134 في هذه المجموعة.
فتح الحزمة
k this deck
40
With a given upward- sloping supply curve for sirloin steak (a normal good), a rise in household income will cause the
A) equilibrium price to decrease and equilibrium quantity of sirloin steak to increase.
B) equilibrium price and equilibrium quantity of sirloin steak to both increase.
C) equilibrium price and equilibrium quantity of sirloin steak to both decrease.
D) equilibrium price to increase and equilibrium quantity of sirloin steak to decrease.
E) equilibrium price to increase and equilibrium quantity of sirloin steak to remain constant.
فتح الحزمة
افتح القفل للوصول البطاقات البالغ عددها 134 في هذه المجموعة.
فتح الحزمة
k this deck
41
The term "quantity supplied" is the amount of a commodity that
A) firms wish to sell at a given price during a given period of time.
B) firms actually sell during a given period of time at a given price.
C) is supplied at a fair market price.
D) is exchanged between firms and consumers during a given period of time at a given price.
E) households wish firms would sell during a given period of time at a given price.
فتح الحزمة
افتح القفل للوصول البطاقات البالغ عددها 134 في هذه المجموعة.
فتح الحزمة
k this deck
42
FIGURE 3- 5Refer to Figure 3- 5. If supply and demand were to increase simultaneously, this would lead to
A) an increase in Q and an indeterminate change in P.
B) a decrease in P and in Q.
C) an increase in P and an indeterminate change in Q.
D) an increase in P and in Q.
E) no change in P or Q.
فتح الحزمة
افتح القفل للوصول البطاقات البالغ عددها 134 في هذه المجموعة.
فتح الحزمة
k this deck
43
An increase in the number of firms wanting to provide accounting services will cause a for accounting services.
A) leftward shift in the supply curve
B) rightward shift in the supply curve
C) leftward shift in the demand curve
D) simultaneous shift of both the demand and supply curves
E) rightward shift in the demand curve
A) leftward shift in the supply curve
B) rightward shift in the supply curve
C) leftward shift in the demand curve
D) simultaneous shift of both the demand and supply curves
E) rightward shift in the demand curve
فتح الحزمة
افتح القفل للوصول البطاقات البالغ عددها 134 في هذه المجموعة.
فتح الحزمة
k this deck
44
Consider butter and margarine, which are substitutes. When the price of butter falls, the demand curve for margarine is likely to
A) shift to the left.
B) remain stationary.
C) remain stationary, although its price will rise.
D) remain stationary, although its price will fall.
E) shift to the right.
A) shift to the left.
B) remain stationary.
C) remain stationary, although its price will rise.
D) remain stationary, although its price will fall.
E) shift to the right.
فتح الحزمة
افتح القفل للوصول البطاقات البالغ عددها 134 في هذه المجموعة.
فتح الحزمة
k this deck
45
Which of the following best defines quantity demanded?
A) The amount an individual purchases at its current price.
B) The various amounts that a society desires at all relevant prices.
C) The amount an individual purchases at his or her current income.
D) The amount, per time period, that is desired at a given price.
E) The amount, per time period, an individual desires and is able to purchase at the given price.
فتح الحزمة
افتح القفل للوصول البطاقات البالغ عددها 134 في هذه المجموعة.
فتح الحزمة
k this deck
46
Suppose that supply for some good increases and that simultaneously the demand for the same good decreases. The result would be
A) a decrease in P and an indeterminate change in Q.
B) no change in either P or Q.
C) an increase in Q and a decrease in P.
D) a decrease in Q and an indeterminate change in P.
E) an increase in Q and an increase in P.
A) a decrease in P and an indeterminate change in Q.
B) no change in either P or Q.
C) an increase in Q and a decrease in P.
D) a decrease in Q and an indeterminate change in P.
E) an increase in Q and an increase in P.
فتح الحزمة
افتح القفل للوصول البطاقات البالغ عددها 134 في هذه المجموعة.
فتح الحزمة
k this deck
47
Assume that apples and oranges are substitute goods. Given the initial supply and demand curves for apples, a reduction in the price of oranges will tend to
A) increase the price of apples.
B) increase the demand for oranges.
C) decrease the price of apples
D) decrease the demand for oranges.
E) increase the demand for apples.
A) increase the price of apples.
B) increase the demand for oranges.
C) decrease the price of apples
D) decrease the demand for oranges.
E) increase the demand for apples.
فتح الحزمة
افتح القفل للوصول البطاقات البالغ عددها 134 في هذه المجموعة.
فتح الحزمة
k this deck
48
Suppose that many coal mines are shut for environmental reasons. This will cause
A) a movement up the supply curve.
B) a decrease in the supply of coal (a leftward shift of the supply curve).
C) no change in the supply curve, only a change in price.
D) an increase in the supply of coal (a rightward shift of the supply curve).
E) a movement down the supply curve.
A) a movement up the supply curve.
B) a decrease in the supply of coal (a leftward shift of the supply curve).
C) no change in the supply curve, only a change in price.
D) an increase in the supply of coal (a rightward shift of the supply curve).
E) a movement down the supply curve.
فتح الحزمة
افتح القفل للوصول البطاقات البالغ عددها 134 في هذه المجموعة.
فتح الحزمة
k this deck
49
Suppose that the price of wheat has fallen from $3 to $2 per bushel and that the price of newsprint has fallen from $200 to $100 per tonne. The relative price of wheat in terms of newsprint
A) has risen.
B) has fallen.
C) cannot be determined from the above data.
D) is completely unrelated.
E) remained constant.
A) has risen.
B) has fallen.
C) cannot be determined from the above data.
D) is completely unrelated.
E) remained constant.
فتح الحزمة
افتح القفل للوصول البطاقات البالغ عددها 134 في هذه المجموعة.
فتح الحزمة
k this deck
50
FIGURE 3- 5Refer to Figure 3- 5. If supply were to increase and demand were to decrease simultaneously, this would lead to
A) an increase in Q and a decrease in P.
B) a decrease in P and an indeterminate change in Q.
C) no change in P or Q.
D) an increase in Q and an increase in P.
E) a decrease in Q and an indeterminate change in P.
فتح الحزمة
افتح القفل للوصول البطاقات البالغ عددها 134 في هذه المجموعة.
فتح الحزمة
k this deck
51
An equilibrium price is the
A) price that producers want to charge.
B) price in the middle of supply and demand.
C) price that consumers are willing to pay.
D) price at which quantity demanded of the commodity is equal to the quantity supplied.
E) price at which demand for the commodity is equal to supply.
A) price that producers want to charge.
B) price in the middle of supply and demand.
C) price that consumers are willing to pay.
D) price at which quantity demanded of the commodity is equal to the quantity supplied.
E) price at which demand for the commodity is equal to supply.
فتح الحزمة
افتح القفل للوصول البطاقات البالغ عددها 134 في هذه المجموعة.
فتح الحزمة
k this deck
52
For a given commodity, quantity demanded can be represented by
A) a demand curve.
B) the price on the vertical axis.
C) a demand schedule.
D) a point on a demand curve.
E) the money value of the stock of the commodity held by households.
A) a demand curve.
B) the price on the vertical axis.
C) a demand schedule.
D) a point on a demand curve.
E) the money value of the stock of the commodity held by households.
فتح الحزمة
افتح القفل للوصول البطاقات البالغ عددها 134 في هذه المجموعة.
فتح الحزمة
k this deck
53
FIGURE 3- 6Refer to Figure 3- 6. If the initial demand and supply curves are D1 and S1, and demand shifts to
D2, then
A) a shortage will occur at any price above P3.
B) a permanent shortage of X will result.
C) a surplus of Q1Q3 will occur.
D) if price remained at P2, a shortage of Q1Q3 would exist.
E) all of the above
فتح الحزمة
افتح القفل للوصول البطاقات البالغ عددها 134 في هذه المجموعة.
فتح الحزمة
k this deck
54
Which of the following statements is correct for a market with an upward- sloping supply curve and a downward- sloping demand curve?
A) If the demand curve shifts left and the supply curve shifts left, equilibrium price will fall.
B) If the demand curve shifts right and the supply curve shifts left, equilibrium price will rise.
C) If the demand curve shifts left and the supply curve shifts right, equilibrium price will rise.
D) If the supply curve shifts right and the demand curve remains constant, equilibrium price will rise.
E) If the supply curve shifts left and demand remains constant, equilibrium quantity will rise.
فتح الحزمة
افتح القفل للوصول البطاقات البالغ عددها 134 في هذه المجموعة.
فتح الحزمة
k this deck
55
FIGURE 3- 6Refer to Figure 3- 6. If the demand curve shifts from D1 to D2, while supply remains at S1, one could say that
A) there has been an increase in demand for X.
B) the price of a good which is a substitute for X must have fallen.
C) there is now an excess demand at the new price of P1.
D) the price increase has caused an increase in quantity demanded.
E) the quantity demanded has decreased to Q1 and price has fallen to P2.
فتح الحزمة
افتح القفل للوصول البطاقات البالغ عددها 134 في هذه المجموعة.
فتح الحزمة
k this deck
56
FIGURE 3- 1Refer to Figure 3- 1. If demand is given by the curve D, the energy- efficient light bulbs is 200 000 at a price of $9.
A) demand for
B) quantity sold of
C) demand schedule for
D) quantity demanded of
E) quantity purchased of
فتح الحزمة
افتح القفل للوصول البطاقات البالغ عددها 134 في هذه المجموعة.
فتح الحزمة
k this deck
57
Suppose that some resource X is necessary to produce some good Y. If the price of X falls
A) there is a movement along the supply curve of good Y.
B) the demand curve for X shifts to the right.
C) the supply curve of good Y shifts to the right.
D) the supply curve of resource X shifts to the left.
E) the supply curve of good Y is unaffected.
A) there is a movement along the supply curve of good Y.
B) the demand curve for X shifts to the right.
C) the supply curve of good Y shifts to the right.
D) the supply curve of resource X shifts to the left.
E) the supply curve of good Y is unaffected.
فتح الحزمة
افتح القفل للوصول البطاقات البالغ عددها 134 في هذه المجموعة.
فتح الحزمة
k this deck
58
FIGURE 3- 6Refer to Figure 3- 6. A shift in the supply curve from S2 to S1 might be caused by
A) a decrease in demand for X.
B) an improvement in the technology of producing good X.
C) additional suppliers entering the industry.
D) a rise in the costs of producing good X.
E) a decrease in the price of X.
فتح الحزمة
افتح القفل للوصول البطاقات البالغ عددها 134 في هذه المجموعة.
فتح الحزمة
k this deck
59
The "law of demand" describes
A) a direct relationship between the price of a good and the quantity of the good demanded per unit of time, ceteris paribus.
B) an inverse relationship between the price of a good and the demand for the good, per unit of time.
C) a direct relationship between the price of a good and the demand for the good.
D) any relationship between quantity demanded and demand for a good.
E) an inverse relationship between the price of a good and the quantity of the good demanded per unit of time, other things being equal.
فتح الحزمة
افتح القفل للوصول البطاقات البالغ عددها 134 في هذه المجموعة.
فتح الحزمة
k this deck
60
Weekend train travel costs less than weekday train travel. If the supply of train service remains the same between weekdays and weekends, then the most likely explanation for this difference in price is that the weekend
A) supply curve is to the right of the weekday supply curve.
B) demand curve is to the left of the weekday demand curve.
C) demand curve is random.
D) supply curve is to the left of the weekday supply curve.
E) demand curve is to the right of the weekday demand curve.
A) supply curve is to the right of the weekday supply curve.
B) demand curve is to the left of the weekday demand curve.
C) demand curve is random.
D) supply curve is to the left of the weekday supply curve.
E) demand curve is to the right of the weekday demand curve.
فتح الحزمة
افتح القفل للوصول البطاقات البالغ عددها 134 في هذه المجموعة.
فتح الحزمة
k this deck
61
The supply and demand schedules for the umbrella market are given below:
-Refer to Table 3- 2. At a price of there would be an excess of umbrellas.
A) $20; supply
B) $20; demand
C) $10; supply
D) $30; demand
E) $10; demand
-Refer to Table 3- 2. At a price of there would be an excess of umbrellas.
A) $20; supply
B) $20; demand
C) $10; supply
D) $30; demand
E) $10; demand
فتح الحزمة
افتح القفل للوصول البطاقات البالغ عددها 134 في هذه المجموعة.
فتح الحزمة
k this deck
62
FIGURE 3- 5Refer to Figure 3- 5. A price at which there would be a surplus in this market is
A) P1.
B) P2.
C) P3.
D) both P1 and P2.
E) both P1 and P3.
فتح الحزمة
افتح القفل للوصول البطاقات البالغ عددها 134 في هذه المجموعة.
فتح الحزمة
k this deck
63
Which of the following pairs of goods are likely to be complements for a large group of consumers?
A) tea and coffee
B) televisions and radios
C) televisions and DVD players
D) cars and trucks
E) tents and tent- trailers
A) tea and coffee
B) televisions and radios
C) televisions and DVD players
D) cars and trucks
E) tents and tent- trailers
فتح الحزمة
افتح القفل للوصول البطاقات البالغ عددها 134 في هذه المجموعة.
فتح الحزمة
k this deck
64
The term "supply" in a particular market refers to
A) the particular quantity supplied at the moment.
B) the quantity actually sold to consumers.
C) the entire relationship between quantity supplied and price.
D) only one point on the supply curve.
E) only one entry in a supply schedule.
A) the particular quantity supplied at the moment.
B) the quantity actually sold to consumers.
C) the entire relationship between quantity supplied and price.
D) only one point on the supply curve.
E) only one entry in a supply schedule.
فتح الحزمة
افتح القفل للوصول البطاقات البالغ عددها 134 في هذه المجموعة.
فتح الحزمة
k this deck
65
When deriving the market demand curve for a commodity, the only variable(s) that can change is (are) the
A) income of consumers.
B) price of a related commodity.
C) quantity of the commodity demanded.
D) price of the commodity.
E) both C and D.
A) income of consumers.
B) price of a related commodity.
C) quantity of the commodity demanded.
D) price of the commodity.
E) both C and D.
فتح الحزمة
افتح القفل للوصول البطاقات البالغ عددها 134 في هذه المجموعة.
فتح الحزمة
k this deck
66
Ceteris paribus means
A) among other things.
B) other things being equal.
C) knowledge gained before the study of evidence is made.
D) and so forth.
E) in a historical context.
A) among other things.
B) other things being equal.
C) knowledge gained before the study of evidence is made.
D) and so forth.
E) in a historical context.
فتح الحزمة
افتح القفل للوصول البطاقات البالغ عددها 134 في هذه المجموعة.
فتح الحزمة
k this deck
67
The supply and demand schedules for dozens of roses are given below:
-Refer to Table 3- 1. At a price of _ there would be an excess _ of 300 dozen roses.
A) $30; supply
B) $10; supply
C) $10; demand
D) $30; demand
E) $50; demand
-Refer to Table 3- 1. At a price of _ there would be an excess _ of 300 dozen roses.
A) $30; supply
B) $10; supply
C) $10; demand
D) $30; demand
E) $50; demand
فتح الحزمة
افتح القفل للوصول البطاقات البالغ عددها 134 في هذه المجموعة.
فتح الحزمة
k this deck
68
The positive slope of a supply curve indicates that
A) as price goes up, quantity supplied will increase.
B) as price goes up, quantity supplied will remain constant.
C) as price goes up, quantity supplied will decrease.
D) consumers will want to buy less at higher prices.
E) if the costs of production increase, the quantity supplied will increase.
A) as price goes up, quantity supplied will increase.
B) as price goes up, quantity supplied will remain constant.
C) as price goes up, quantity supplied will decrease.
D) consumers will want to buy less at higher prices.
E) if the costs of production increase, the quantity supplied will increase.
فتح الحزمة
افتح القفل للوصول البطاقات البالغ عددها 134 في هذه المجموعة.
فتح الحزمة
k this deck
69
A variable that is assumed to be constant along an individual's demand curve for good X is the
A) price of good X.
B) quantity of X demanded per unit of time.
C) consumer's real purchasing power.
D) amount of X the individual wishes to purchase.
E) price of a substitute good Y.
A) price of good X.
B) quantity of X demanded per unit of time.
C) consumer's real purchasing power.
D) amount of X the individual wishes to purchase.
E) price of a substitute good Y.
فتح الحزمة
افتح القفل للوصول البطاقات البالغ عددها 134 في هذه المجموعة.
فتح الحزمة
k this deck
70
To say that the demand curve for movies is negatively sloped means that
A) less quantity will be demanded at higher prices.
B) less quantity will be demanded as preferences change.
C) more quantity will be demanded as consumers' income increases.
D) less quantity will be demanded at lower prices.
E) less quantity will be demanded at the same price.
A) less quantity will be demanded at higher prices.
B) less quantity will be demanded as preferences change.
C) more quantity will be demanded as consumers' income increases.
D) less quantity will be demanded at lower prices.
E) less quantity will be demanded at the same price.
فتح الحزمة
افتح القفل للوصول البطاقات البالغ عددها 134 في هذه المجموعة.
فتح الحزمة
k this deck
71
A demand curve is a representation of the relationship, ceteris paribus, between quantity demanded and
A) supply.
B) price.
C) wealth.
D) income.
E) preferences.
A) supply.
B) price.
C) wealth.
D) income.
E) preferences.
فتح الحزمة
افتح القفل للوصول البطاقات البالغ عددها 134 في هذه المجموعة.
فتح الحزمة
k this deck
72
Consider the following two statements. (1) An increase in the price of eggs will cause a decrease in the demand for eggs. (2) An increase in the price of eggs will cause a decrease in the demand for bacon. In which of these two statements is the term "demand" used correctly?
A) neither statement
B) both statements
C) the first statement only
D) more information is needed
E) the second statement only
A) neither statement
B) both statements
C) the first statement only
D) more information is needed
E) the second statement only
فتح الحزمة
افتح القفل للوصول البطاقات البالغ عددها 134 في هذه المجموعة.
فتح الحزمة
k this deck
73
The table below displays hypothetical demand and supply schedules for the market for overnight parcel deliveries in Canada.
-Refer to Table 3- 3. The equilibrium price and quantity for overnight parcel delivery in Year 1 is
And million parcels.
A) $22; 115
B) $14; 120
C) $22; 130
D) $10; 115
E) $30; 80
-Refer to Table 3- 3. The equilibrium price and quantity for overnight parcel delivery in Year 1 is
And million parcels.
A) $22; 115
B) $14; 120
C) $22; 130
D) $10; 115
E) $30; 80
فتح الحزمة
افتح القفل للوصول البطاقات البالغ عددها 134 في هذه المجموعة.
فتح الحزمة
k this deck
74
The supply and demand schedules for the umbrella market are given below:
-Refer to Table 3- 2. The equilibrium price for umbrellas is .
A) $15
B) $20
C) $30
D) $10
E) $25
-Refer to Table 3- 2. The equilibrium price for umbrellas is .
A) $15
B) $20
C) $30
D) $10
E) $25
فتح الحزمة
افتح القفل للوصول البطاقات البالغ عددها 134 في هذه المجموعة.
فتح الحزمة
k this deck
75
The supply for some good or service will decrease
A) if the prices of inputs increase.
B) if technology improves.
C) if more suppliers enter the industry.
D) if technology improves and the price of inputs falls.
E) if the prices of inputs fall.
A) if the prices of inputs increase.
B) if technology improves.
C) if more suppliers enter the industry.
D) if technology improves and the price of inputs falls.
E) if the prices of inputs fall.
فتح الحزمة
افتح القفل للوصول البطاقات البالغ عددها 134 في هذه المجموعة.
فتح الحزمة
k this deck
76
The demand for a given commodity will remain the same with a change in
A) population.
B) the price of the commodity.
C) tastes in favour of the commodity.
D) the distribution of income.
E) average household income.
A) population.
B) the price of the commodity.
C) tastes in favour of the commodity.
D) the distribution of income.
E) average household income.
فتح الحزمة
افتح القفل للوصول البطاقات البالغ عددها 134 في هذه المجموعة.
فتح الحزمة
k this deck
77
Cars and gasoline are likely to be
A) independent goods.
B) substitute goods.
C) complementary goods.
D) luxury goods.
E) inferior goods.
A) independent goods.
B) substitute goods.
C) complementary goods.
D) luxury goods.
E) inferior goods.
فتح الحزمة
افتح القفل للوصول البطاقات البالغ عددها 134 في هذه المجموعة.
فتح الحزمة
k this deck
78
The table below displays hypothetical demand and supply schedules for the market for overnight parcel deliveries in Canada.
-Refer to Table 3- 3. Suppose the price of overnight parcel delivery in Year 1 is $22. Which of the following statements is correct? In Year 1
A) 115 million parcels will be delivered.
B) there is an excess demand of 30 million deliveries.
C) there is an excess supply of 30 million deliveries.
D) there is an excess demand of 15 million deliveries.
E) there is an excess supply of 15 million deliveries.
فتح الحزمة
افتح القفل للوصول البطاقات البالغ عددها 134 في هذه المجموعة.
فتح الحزمة
k this deck
79
FIGURE 3- 2Refer to Figure 3- 2. A shift of the supply curve for energy- efficient light bulbs from S to S2 could be caused by
A) a change in preferences toward energy- efficient light bulbs.
B) the elimination of government subsidies to suppliers of energy- efficient light bulbs.
C) an increase in the number of suppliers.
D) a decrease in the price of energy- efficient light bulbs.
E) an increase in the price of energy- efficient light bulbs.
فتح الحزمة
افتح القفل للوصول البطاقات البالغ عددها 134 في هذه المجموعة.
فتح الحزمة
k this deck
80
An important assumption underlying a demand schedule is that
A) household tastes rarely change.
B) everything else except the product's price is being held constant.
C) quantity demanded and demand mean the same thing.
D) the numbers are not important; the general relationship between the variables is.
E) income has little significance to household demand.
A) household tastes rarely change.
B) everything else except the product's price is being held constant.
C) quantity demanded and demand mean the same thing.
D) the numbers are not important; the general relationship between the variables is.
E) income has little significance to household demand.
فتح الحزمة
افتح القفل للوصول البطاقات البالغ عددها 134 في هذه المجموعة.
فتح الحزمة
k this deck
فتح الحزمة
افتح القفل للوصول البطاقات البالغ عددها 134 في هذه المجموعة.


