Deck 3: Correlation and Prediction
ملء الشاشة (f)
سؤال
Which of the alternatives best describes the pattern of scores graphed below? 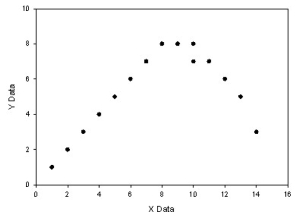
A)No correlation
B)Curvilinear correlation
C)Positive linear correlation
D)Negative linear correlation
A)No correlation
B)Curvilinear correlation
C)Positive linear correlation
D)Negative linear correlation
سؤال
سؤال
سؤال
سؤال
سؤال
سؤال
سؤال
سؤال
سؤال
Which of the alternatives best describes the pattern of scores graphed below? 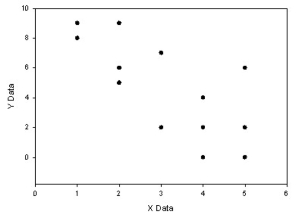
A)Strong positive linear correlation
B)Weak negative linear correlation
C)Strong curvilinear correlation
D)Weak positive linear correlation
A)Strong positive linear correlation
B)Weak negative linear correlation
C)Strong curvilinear correlation
D)Weak positive linear correlation
سؤال
سؤال
سؤال
سؤال
سؤال
سؤال
سؤال
سؤال
Which of the alternatives best describes the pattern of scores on the scatter diagram below? 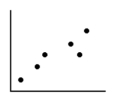
A)No correlation
B)Curvilinear correlation
C)Positive linear correlation
D)Negative linear correlation
A)No correlation
B)Curvilinear correlation
C)Positive linear correlation
D)Negative linear correlation
سؤال
سؤال
Which of the alternatives best describes the pattern of scores on the scatter diagram below? 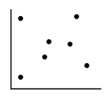
A)No correlation
B)Curvilinear correlation
C)Positive linear correlation
D)Negative linear correlation
A)No correlation
B)Curvilinear correlation
C)Positive linear correlation
D)Negative linear correlation
سؤال
سؤال
سؤال
سؤال
سؤال
سؤال
سؤال
سؤال
سؤال
سؤال
سؤال
سؤال
سؤال
سؤال
سؤال
سؤال
سؤال
سؤال
سؤال
سؤال
سؤال
سؤال
سؤال
سؤال
سؤال
سؤال
سؤال
سؤال
سؤال
سؤال
سؤال
سؤال
سؤال
سؤال
سؤال
سؤال
سؤال
سؤال
سؤال
سؤال
سؤال
سؤال
سؤال
سؤال
سؤال
سؤال
سؤال
سؤال
سؤال
سؤال
سؤال
سؤال
سؤال
سؤال
سؤال
سؤال
سؤال
سؤال
سؤال
سؤال

فتح الحزمة
قم بالتسجيل لفتح البطاقات في هذه المجموعة!
Unlock Deck
Unlock Deck
1/96
العب
ملء الشاشة (f)
Deck 3: Correlation and Prediction
1
Which of the alternatives best describes the pattern of scores graphed below?
A)No correlation
B)Curvilinear correlation
C)Positive linear correlation
D)Negative linear correlation
A)No correlation
B)Curvilinear correlation
C)Positive linear correlation
D)Negative linear correlation
Curvilinear correlation
2
When is the correlation coefficient zero?
A)It is never zero
B)When there is no linear correlation
C)When there is a perfect positive linear correlation
D)When there is a perfect negative linear correlation
A)It is never zero
B)When there is no linear correlation
C)When there is a perfect positive linear correlation
D)When there is a perfect negative linear correlation
When there is no linear correlation
3
All of the following are reasons why Z scores are used to help determine the degree of linear correlation EXCEPT:
A)Z scores give a standard indication of just how high or low each score is.
B)The sum of the cross-products of Z scores gives you a large positive number if there is a positive correlation and a large negative number if there is a negative correlation.
C)Because of the nature of Z scores, the cross-product will be positive in all cases.
D)Using Z scores allows you to compare scores on different measures.
Because of the nature of Z scores, the cross-product will be positive in all cases.
4
A study found that absenteeism from work had a negative linear correlation with job satisfaction. This means that:
A)the higher the level of job satisfaction, the higher the level of absenteeism
B)the lower the level of job satisfaction, the higher the level of absenteeism
C)the lower the level of job satisfaction, the lower the level of absenteeism
D)level of job satisfaction is unrelated to absenteeism
A)the higher the level of job satisfaction, the higher the level of absenteeism
B)the lower the level of job satisfaction, the higher the level of absenteeism
C)the lower the level of job satisfaction, the lower the level of absenteeism
D)level of job satisfaction is unrelated to absenteeism
فتح الحزمة
افتح القفل للوصول البطاقات البالغ عددها 96 في هذه المجموعة.
فتح الحزمة
k this deck
5
The average of the cross-products of Z scores is:
A)never more than +1.0 or less than -1.0
B)never more than +10.0 or less than -10.0
C)never more than +1.0 or less than 0
D)never more than +10.0 or less than 0
A)never more than +1.0 or less than -1.0
B)never more than +10.0 or less than -10.0
C)never more than +1.0 or less than 0
D)never more than +10.0 or less than 0
فتح الحزمة
افتح القفل للوصول البطاقات البالغ عددها 96 في هذه المجموعة.
فتح الحزمة
k this deck
6
A researcher discovers that if people eat a certain fruit before a test, the more fruit eaten, the better they do on the test. Beyond a certain point, however, the more fruit eaten the worse people do on the test. The relation between amount of fruit eaten and how well people do on the test is an example of:
A)a positive linear correlation
B)a curvilinear correlation
C)a negative linear correlation
D)no correlation
A)a positive linear correlation
B)a curvilinear correlation
C)a negative linear correlation
D)no correlation
فتح الحزمة
افتح القفل للوصول البطاقات البالغ عددها 96 في هذه المجموعة.
فتح الحزمة
k this deck
7
You are interested in the relation between the number of years working for a particular company and loneliness at work. You survey 40 workers at this company and figure a correlation between these two variables of -.90. This is considered a:
A)weak positive linear correlation
B)weak negative linear correlation
C)strong positive linear correlation
D)strong negative linear correlation
A)weak positive linear correlation
B)weak negative linear correlation
C)strong positive linear correlation
D)strong negative linear correlation
فتح الحزمة
افتح القفل للوصول البطاقات البالغ عددها 96 في هذه المجموعة.
فتح الحزمة
k this deck
8
You conduct a study in which you measure two political attitudes and find a correlation of +.07. This is considered a:
A)weak positive linear correlation
B)weak negative linear correlation
C)strong positive linear correlation
D)strong negative linear correlation
A)weak positive linear correlation
B)weak negative linear correlation
C)strong positive linear correlation
D)strong negative linear correlation
فتح الحزمة
افتح القفل للوصول البطاقات البالغ عددها 96 في هذه المجموعة.
فتح الحزمة
k this deck
9
The dots on a scatter diagram seem to form a straight line that goes upward to the right. This is called:
A)a positive linear correlation
B)a negative linear correlation
C)a curvilinear correlation
D)no correlation
A)a positive linear correlation
B)a negative linear correlation
C)a curvilinear correlation
D)no correlation
فتح الحزمة
افتح القفل للوصول البطاقات البالغ عددها 96 في هذه المجموعة.
فتح الحزمة
k this deck
10
Which of the alternatives best describes the pattern of scores graphed below?
A)Strong positive linear correlation
B)Weak negative linear correlation
C)Strong curvilinear correlation
D)Weak positive linear correlation
A)Strong positive linear correlation
B)Weak negative linear correlation
C)Strong curvilinear correlation
D)Weak positive linear correlation
فتح الحزمة
افتح القفل للوصول البطاقات البالغ عددها 96 في هذه المجموعة.
فتح الحزمة
k this deck
11
A graph that shows the pattern of the relation of two variables is a:
A)histogram
B)scatter diagram
C)frequency polygon
D)box plot
A)histogram
B)scatter diagram
C)frequency polygon
D)box plot
فتح الحزمة
افتح القفل للوصول البطاقات البالغ عددها 96 في هذه المجموعة.
فتح الحزمة
k this deck
12
You take the sum of the cross-products of Z scores and divide it by the number of people in the study. You are figuring:
A)the Pearson correlation coefficient
B)the proportionate reduction in error
C)Kendall's tau coefficient
D)the raw scores
A)the Pearson correlation coefficient
B)the proportionate reduction in error
C)Kendall's tau coefficient
D)the raw scores
فتح الحزمة
افتح القفل للوصول البطاقات البالغ عددها 96 في هذه المجموعة.
فتح الحزمة
k this deck
13
What is the difference between a positive correlation and a negative correlation?
A)In a negative correlation high scores go with high scores and low with low; in a positive correlation high scores go with low scores and low with high.
B)In a negative correlation high scores go with low scores and low with high; in a positive correlation high scores go with high scores and low with low.
C)Negative correlations are curvilinear; positive correlations are straight lines.
D)Negative correlations represent a weak relationship; positive correlations represent a strong relationship.
فتح الحزمة
افتح القفل للوصول البطاقات البالغ عددها 96 في هذه المجموعة.
فتح الحزمة
k this deck
14
A correlation describes the relationship between two:
A)equal-interval numeric variables
B)scatterplots
C)standard deviations
D)horizontal axes
A)equal-interval numeric variables
B)scatterplots
C)standard deviations
D)horizontal axes
فتح الحزمة
افتح القفل للوصول البطاقات البالغ عددها 96 في هذه المجموعة.
فتح الحزمة
k this deck
15
According to your text, Mirvis and Lawler (1977)found that the higher the level of job satisfaction, the lower the level of absenteeism. Research on this topic has continued to show this __________ pattern all over the world and for university classes.
A)positive linear correlational
B)cross-tabuler correlational
C)zero-order correlational
D)negative linear correlational
A)positive linear correlational
B)cross-tabuler correlational
C)zero-order correlational
D)negative linear correlational
فتح الحزمة
افتح القفل للوصول البطاقات البالغ عددها 96 في هذه المجموعة.
فتح الحزمة
k this deck
16
What is meant by the phrase strength of the correlation?
A)How much highs on one variable go with highs on the other
B)How much highs on one variable go with lows on the other
C)How much lows on one variable go with lows on the other
D)All of the above
A)How much highs on one variable go with highs on the other
B)How much highs on one variable go with lows on the other
C)How much lows on one variable go with lows on the other
D)All of the above
فتح الحزمة
افتح القفل للوصول البطاقات البالغ عددها 96 في هذه المجموعة.
فتح الحزمة
k this deck
17
For a positive linear correlation that is not perfect, the average of the cross-products of Z scores is between:
A)-1 and 0
B)0 and .5
C)-.5 and .5
D)0 and 1
A)-1 and 0
B)0 and .5
C)-.5 and .5
D)0 and 1
فتح الحزمة
افتح القفل للوصول البطاقات البالغ عددها 96 في هذه المجموعة.
فتح الحزمة
k this deck
18
Which of the alternatives best describes the pattern of scores on the scatter diagram below?
A)No correlation
B)Curvilinear correlation
C)Positive linear correlation
D)Negative linear correlation
A)No correlation
B)Curvilinear correlation
C)Positive linear correlation
D)Negative linear correlation
فتح الحزمة
افتح القفل للوصول البطاقات البالغ عددها 96 في هذه المجموعة.
فتح الحزمة
k this deck
19
Which of these statements is TRUE when drawing a scatter diagram?
A)The highest number should start where the axes meet.
B)The variable that predicts the other goes on the vertical axis.
C)The variable that predicts the other goes on the horizontal axis.
D)The variable that is being predicted goes on the horizontal axis.
A)The highest number should start where the axes meet.
B)The variable that predicts the other goes on the vertical axis.
C)The variable that predicts the other goes on the horizontal axis.
D)The variable that is being predicted goes on the horizontal axis.
فتح الحزمة
افتح القفل للوصول البطاقات البالغ عددها 96 في هذه المجموعة.
فتح الحزمة
k this deck
20
Which of the alternatives best describes the pattern of scores on the scatter diagram below?
A)No correlation
B)Curvilinear correlation
C)Positive linear correlation
D)Negative linear correlation
A)No correlation
B)Curvilinear correlation
C)Positive linear correlation
D)Negative linear correlation
فتح الحزمة
افتح القفل للوصول البطاقات البالغ عددها 96 في هذه المجموعة.
فتح الحزمة
k this deck
21
Suppose that the beta in a particular situation for predicting college grades from high school grades is .4 and that a person had a GPA that was 1 standard deviation above the mean (Z score = +1)in high school. What would the predicted score for that person's GPA in college be?
A).4
B).71
C)1.4
D)2.5
A).4
B).71
C)1.4
D)2.5
فتح الحزمة
افتح القفل للوصول البطاقات البالغ عددها 96 في هذه المجموعة.
فتح الحزمة
k this deck
22
In prediction with one predictor variable, the optimal number to use for beta (the standardized regression coefficient)is the:
A)proportionate reduction in error
B)correlation coefficient
C)sum of squared roots
D)regression constant
A)proportionate reduction in error
B)correlation coefficient
C)sum of squared roots
D)regression constant
فتح الحزمة
افتح القفل للوصول البطاقات البالغ عددها 96 في هذه المجموعة.
فتح الحزمة
k this deck
23
A person's predicted Z score on the criterion variable is found by multiplying that person's Z score on the predictor variable by a particular number called a:
A)coefficient of redundancy
B)regression constant
C)proportionate reduction in error
D)standardized regression coefficient
A)coefficient of redundancy
B)regression constant
C)proportionate reduction in error
D)standardized regression coefficient
فتح الحزمة
افتح القفل للوصول البطاقات البالغ عددها 96 في هذه المجموعة.
فتح الحزمة
k this deck
24
In a true experiment, participants are __________ a particular level of a variable and then are measured on another variable.
A)asked to comment about
B)randomly assigned to
C)considered significant on
D)measured on
A)asked to comment about
B)randomly assigned to
C)considered significant on
D)measured on
فتح الحزمة
افتح القفل للوصول البطاقات البالغ عددها 96 في هذه المجموعة.
فتح الحزمة
k this deck
25
The correlation coefficient is abbreviated by the letter r, which stands for:
A)relation
B)resistance
C)relative distance
D)regression
A)relation
B)resistance
C)relative distance
D)regression
فتح الحزمة
افتح القفل للوصول البطاقات البالغ عددها 96 في هذه المجموعة.
فتح الحزمة
k this deck
26
The invention of the correlation coefficient occurred as part of research being conducted for which ultimate purpose?
A)Military strategy decisions
B)Environmental influences (such as types and quantities of manure)on crop growth
C)Determining fire insurance rates
D)Selective breeding of human beings (eugenics)
A)Military strategy decisions
B)Environmental influences (such as types and quantities of manure)on crop growth
C)Determining fire insurance rates
D)Selective breeding of human beings (eugenics)
فتح الحزمة
افتح القفل للوصول البطاقات البالغ عددها 96 في هذه المجموعة.
فتح الحزمة
k this deck
27
If researchers were to measure a couples' level of exciting activities at one time and then examine the quality of their marriages several years later (as done by Tsapelas, Aron, & Orbuch, 2009), they would be carrying out a:
A)regression analysis
B)longitudinal study
C)true experiment
D)single case design
A)regression analysis
B)longitudinal study
C)true experiment
D)single case design
فتح الحزمة
افتح القفل للوصول البطاقات البالغ عددها 96 في هذه المجموعة.
فتح الحزمة
k this deck
28
Suppose that you want to be able to predict college grades from information about high school grades. In this case, the college grades would be called the:
A)predictor variable
B)criterion variable
C)independent variable
D)causal variable
A)predictor variable
B)criterion variable
C)independent variable
D)causal variable
فتح الحزمة
افتح القفل للوصول البطاقات البالغ عددها 96 في هذه المجموعة.
فتح الحزمة
k this deck
29
In the social sciences, a strategy to rule out at least one direction of causality is to conduct studies where people are measured:
A)on two different variables
B)on three different variables
C)at their peak level of performance
D)in two different settings
A)on two different variables
B)on three different variables
C)at their peak level of performance
D)in two different settings
فتح الحزمة
افتح القفل للوصول البطاقات البالغ عددها 96 في هذه المجموعة.
فتح الحزمة
k this deck
30
Suppose that you would like to predict a person's college GPA from the person's SAT score. In this situation, the SAT score is called the:
A)predictor variable
B)dependent variable
C)criterion variable
D)positive variable
A)predictor variable
B)dependent variable
C)criterion variable
D)positive variable
فتح الحزمة
افتح القفل للوصول البطاقات البالغ عددها 96 في هذه المجموعة.
فتح الحزمة
k this deck
31
Which of the following represents the strongest linear correlation?
A)+)09
B)+)88
C)-.92
D)-.18
A)+)09
B)+)88
C)-.92
D)-.18
فتح الحزمة
افتح القفل للوصول البطاقات البالغ عددها 96 في هذه المجموعة.
فتح الحزمة
k this deck
32
Researchers say that a correlation is significant if:
A)the dots appear to form a straight line on the scatter diagram
B)there is a small probability, such as 5% or 1%, that you could have obtained a correlation this big if in fact there had been no correlation in the population at large
C)the correlation is .05 or greater (or below -.05 if negative)
D)there is a large probability (.50 or larger)that this correlation is greater than that computed in standard tables of what is called the chi-square distribution
فتح الحزمة
افتح القفل للوصول البطاقات البالغ عددها 96 في هذه المجموعة.
فتح الحزمة
k this deck
33
Who is given credit for inventing the statistic called correlation?
A)Ronald Fisher
B)Francis Galton
C)William Gossett
D)Ralph Rosnow
A)Ronald Fisher
B)Francis Galton
C)William Gossett
D)Ralph Rosnow
فتح الحزمة
افتح القفل للوصول البطاقات البالغ عددها 96 في هذه المجموعة.
فتح الحزمة
k this deck
34
Suppose you are making predictions about people's poetry ability based on scores on a general writing-ability test. However, you also happen to have information about their creativity scores when making your predictions. What is it called when you make a prediction using both pieces of information?
A)Ridge regression
B)Multiple regression
C)Bivariate regression
D)Proportion of variance
A)Ridge regression
B)Multiple regression
C)Bivariate regression
D)Proportion of variance
فتح الحزمة
افتح القفل للوصول البطاقات البالغ عددها 96 في هذه المجموعة.
فتح الحزمة
k this deck
35
Two variables, X and Y, have a strong linear correlation. Under what conditions can you determine the direction of causality just from knowing the correlation coefficient?
A)When the correlation is negative
B)When the correlation is positive
C)When there is high power
D)None of the above
A)When the correlation is negative
B)When the correlation is positive
C)When there is high power
D)None of the above
فتح الحزمة
افتح القفل للوصول البطاقات البالغ عددها 96 في هذه المجموعة.
فتح الحزمة
k this deck
36
Which of the following is a way for researchers to rule out alternative directions of causality?
A)conduct a longitudinal study
B)conduct a cross-sectional study
C)conduct a true experiment
D)both A and C
A)conduct a longitudinal study
B)conduct a cross-sectional study
C)conduct a true experiment
D)both A and C
فتح الحزمة
افتح القفل للوصول البطاقات البالغ عددها 96 في هذه المجموعة.
فتح الحزمة
k this deck
37
A researcher notes that the correlation in the group she studies is so large that if there were not a correlation among people in general, there is less than a 5% chance of getting her correlation. Her correlation is thus:
A)statistically significant
B)statistically insignificant
C)nonlinear
D)curvilinear
A)statistically significant
B)statistically insignificant
C)nonlinear
D)curvilinear
فتح الحزمة
افتح القفل للوصول البطاقات البالغ عددها 96 في هذه المجموعة.
فتح الحزمة
k this deck
38
It is a good idea to make a scatter diagram before figuring the correlation coefficient. This is because:
A)there is no point in figuring the correlation if you can see a clear line formed
B)there are different procedures depending on whether there appears to be a positive or a negative correlation
C)it allows you to estimate the degree and direction of correlation to provide a check on your calculations
D)you should only figure a correlation coefficient if you see a clear curvilinear correlation
فتح الحزمة
افتح القفل للوصول البطاقات البالغ عددها 96 في هذه المجموعة.
فتح الحزمة
k this deck
39
Two variables, A and B, have a strong linear correlation. What is the direction of causality?
A)A causes B
B)B causes A
C)Some third variable causes both A and B
D)Any of the above are possible
A)A causes B
B)B causes A
C)Some third variable causes both A and B
D)Any of the above are possible
فتح الحزمة
افتح القفل للوصول البطاقات البالغ عددها 96 في هذه المجموعة.
فتح الحزمة
k this deck
40
Place the four steps for computing the correlation coefficient into the correct order: 1. Add up the cross-products of the Z scores.
2) Change all scores to Z scores.
3) Divide by the number of people in the study.
4) Figure the cross-product of the Z scores for each person.
A)1, 2, 3, 4
B)2, 1, 4, 3
C)4, 3, 1, 2
D)2, 4, 1, 3
2) Change all scores to Z scores.
3) Divide by the number of people in the study.
4) Figure the cross-product of the Z scores for each person.
A)1, 2, 3, 4
B)2, 1, 4, 3
C)4, 3, 1, 2
D)2, 4, 1, 3
فتح الحزمة
افتح القفل للوصول البطاقات البالغ عددها 96 في هذه المجموعة.
فتح الحزمة
k this deck
41
Figuring the multiple correlation coefficient allows you to:
A)view the correlation between different predictor variables, ignoring the criterion variable
B)view each predictor variable separately and correlate it with the criterion variable
C)correlate more than two predictor variables with more than two criterion variables
D)view the overall correlation between a number of predictor variables and one criterion variable
فتح الحزمة
افتح القفل للوصول البطاقات البالغ عددها 96 في هذه المجموعة.
فتح الحزمة
k this deck
42
In multiple regression, the overall correlation between the criterion variable and all the predictor variables is called the:
A)multiple correlation coefficient
B)regression coefficient
C)multiple beta weight
D)proportion of variance accounted for
A)multiple correlation coefficient
B)regression coefficient
C)multiple beta weight
D)proportion of variance accounted for
فتح الحزمة
افتح القفل للوصول البطاقات البالغ عددها 96 في هذه المجموعة.
فتح الحزمة
k this deck
43
When a research article reports the correlations among several variables by listing them across the top and also across the side, then putting the correlations into the table, this is called a:
A)scatter diagram
B)binomial effect size display
C)correlation matrix
D)variance-covariance matrix
A)scatter diagram
B)binomial effect size display
C)correlation matrix
D)variance-covariance matrix
فتح الحزمة
افتح القفل للوصول البطاقات البالغ عددها 96 في هذه المجموعة.
فتح الحزمة
k this deck
44
Sometimes a correlation coefficient is used to describe the consistency of a measure or test. One way to assess the consistency of a measure is to use it with the same group of people twice. The correlation between the two testings is:
A)correlation matrix
B)test-retest reliability
C)intrarater reliability
D)criterion validity
A)correlation matrix
B)test-retest reliability
C)intrarater reliability
D)criterion validity
فتح الحزمة
افتح القفل للوصول البطاقات البالغ عددها 96 في هذه المجموعة.
فتح الحزمة
k this deck
45
The association of a criterion variable with two or more predictor variables is __________. Making predictions in this situation is called __________.
A)positive correlation, positive regression
B)negative correlation, negative regression
C)multiple regression, multiple correlation
D)multiple correlation, multiple regression
A)positive correlation, positive regression
B)negative correlation, negative regression
C)multiple regression, multiple correlation
D)multiple correlation, multiple regression
فتح الحزمة
افتح القفل للوصول البطاقات البالغ عددها 96 في هذه المجموعة.
فتح الحزمة
k this deck
46
In order to make predictions involving raw scores, the first step is to:
A)multiply the standardized regression coefficient by the person's Z score on the predictor variable
B)change the person's predicted Z score on the criterion variable to a raw score
C)change the person's raw score on the predictor variable to a Z score
D)multiply the standardized regression coefficient by the number of people in the sample
فتح الحزمة
افتح القفل للوصول البطاقات البالغ عددها 96 في هذه المجموعة.
فتح الحزمة
k this deck
47
When asterisks are used in a correlation matrix, they typically represent:
A)standardized regression coefficients
B)multivariate scatter diagrams
C)level of statistical significance
D)various predicted values
A)standardized regression coefficients
B)multivariate scatter diagrams
C)level of statistical significance
D)various predicted values
فتح الحزمة
افتح القفل للوصول البطاقات البالغ عددها 96 في هذه المجموعة.
فتح الحزمة
k this deck
48
Which of the following is NOT usually included in a results section for correlation?
A)The value of r
B)The significance level
C)The Z scores
D)A correlation matrix
A)The value of r
B)The significance level
C)The Z scores
D)A correlation matrix
فتح الحزمة
افتح القفل للوصول البطاقات البالغ عددها 96 في هذه المجموعة.
فتح الحزمة
k this deck
49
Comparisons of the degree of linear correlation are considered most accurate in terms of:
A)the standardized regression coefficient
B)the square root of the correlation coefficient
C)the correlation coefficient squared
D)the log linear correlation
A)the standardized regression coefficient
B)the square root of the correlation coefficient
C)the correlation coefficient squared
D)the log linear correlation
فتح الحزمة
افتح القفل للوصول البطاقات البالغ عددها 96 في هذه المجموعة.
فتح الحزمة
k this deck
50
For a correlation of .5, the proportion of variance of one variable that is shared with the other variable is:
A)25%
B)50%
C)55%
D)60%
A)25%
B)50%
C)55%
D)60%
فتح الحزمة
افتح القفل للوصول البطاقات البالغ عددها 96 في هذه المجموعة.
فتح الحزمة
k this deck
51
The correlation coefficient squared is also called the:
A)determinant of regression
B)estimated error of correlation
C)multiple regression constant
D)proportion of variance accounted for
A)determinant of regression
B)estimated error of correlation
C)multiple regression constant
D)proportion of variance accounted for
فتح الحزمة
افتح القفل للوصول البطاقات البالغ عددها 96 في هذه المجموعة.
فتح الحزمة
k this deck
52
With statistical prediction, the variable being predicted from is called the __________ and the variable being predicted to is called the __________.
A)criterion, predictor
B)criterion, beta
C)predictor, criterion
D)predictor, regressor
A)criterion, predictor
B)criterion, beta
C)predictor, criterion
D)predictor, regressor
فتح الحزمة
افتح القفل للوصول البطاقات البالغ عددها 96 في هذه المجموعة.
فتح الحزمة
k this deck
53
A student applying to your graduate program in psychology has a GRE score that is 2.5 standard deviations above the mean. Suppose that the beta in a particular situation for predicting graduate school GPA from GRE scores is .6. What will be this person's predicted Z score for graduate school GPA?
A).25
B)1.5
C)2.5
D)2.7
A).25
B)1.5
C)2.5
D)2.7
فتح الحزمة
افتح القفل للوصول البطاقات البالغ عددها 96 في هذه المجموعة.
فتح الحزمة
k this deck
54
Which of the following is the most likely way for the correlation coefficient to be presented in a research article?
A)p = .05, r < .52
B)p > .05, r(.52)
C)r(.52), p = .05
D)r = .52, p < .05
A)p = .05, r < .52
B)p > .05, r(.52)
C)r(.52), p = .05
D)r = .52, p < .05
فتح الحزمة
افتح القفل للوصول البطاقات البالغ عددها 96 في هذه المجموعة.
فتح الحزمة
k this deck
55
Figure the predicted Z score on the criterion variable (Y)for the following situation: The correlation coefficient is .50 and the Z score for the predictor variable (X)is 1.20.
A).6
B).7
C).8
D)1.6
A).6
B).7
C).8
D)1.6
فتح الحزمة
افتح القفل للوصول البطاقات البالغ عددها 96 في هذه المجموعة.
فتح الحزمة
k this deck
56
Compare these two correlation coefficients: a = .4 and b = .8
A)8 is twice as strong as .4
B)8 is three times as strong as .4
C)8 is four times as strong as .4
D)these correlation coefficients are equally strong
A)8 is twice as strong as .4
B)8 is three times as strong as .4
C)8 is four times as strong as .4
D)these correlation coefficients are equally strong
فتح الحزمة
افتح القفل للوصول البطاقات البالغ عددها 96 في هذه المجموعة.
فتح الحزمة
k this deck
57
In a particular industry it is known that the standardized regression coefficient for predicting likely profit from number of advertisements is .7. A company is planning to place 18 advertisements. Which of the following pieces of information will be needed as part of predicting the actual amount of profit?
A)Length of time the company has been in business
B)Mean number of advertisements in general and standard deviation
C)This company's profit to date
D)This company's number of advertisements in the previous year
A)Length of time the company has been in business
B)Mean number of advertisements in general and standard deviation
C)This company's profit to date
D)This company's number of advertisements in the previous year
فتح الحزمة
افتح القفل للوصول البطاقات البالغ عددها 96 في هذه المجموعة.
فتح الحزمة
k this deck
58
The multiple correlation coefficient squared (R2)is the proportion of variance in the criterion variable accounted for by:
A)the variance and standard deviation of the sample scores
B)the correlation matrix
C)all of the predictor variables
D)all of the criterion variables
A)the variance and standard deviation of the sample scores
B)the correlation matrix
C)all of the predictor variables
D)all of the criterion variables
فتح الحزمة
افتح القفل للوصول البطاقات البالغ عددها 96 في هذه المجموعة.
فتح الحزمة
k this deck
59
If the correlation coefficient is .45, what is the proportion of variance accounted for?
A).20
B).24
C).67
D).90
A).20
B).24
C).67
D).90
فتح الحزمة
افتح القفل للوصول البطاقات البالغ عددها 96 في هذه المجموعة.
فتح الحزمة
k this deck
60
A research article reports a significant correlation using the .01 significance level. How would this be presented in the article if the correlation coefficient was .43?
A)r = .43, p < .01
B)r = .43, significant
C)r(.43)= significant
D)p > .01, r = .43
A)r = .43, p < .01
B)r = .43, significant
C)r(.43)= significant
D)p > .01, r = .43
فتح الحزمة
افتح القفل للوصول البطاقات البالغ عددها 96 في هذه المجموعة.
فتح الحزمة
k this deck
61
A scatter diagram shows a pattern of dots in which the dots generally go up and to the right. This pattern is an example of a(n)__________ correlation.
فتح الحزمة
افتح القفل للوصول البطاقات البالغ عددها 96 في هذه المجموعة.
فتح الحزمة
k this deck
62
A scatter diagram shows the relation between hearing sensitivity and love of music (you are predicting love of music from hearing sensitivity). A dot located at 4.5 across and 8 up means the person had a score of 4.5 on __________.
فتح الحزمة
افتح القفل للوصول البطاقات البالغ عددها 96 في هذه المجموعة.
فتح الحزمة
k this deck
63
In a scatter diagram, the predictor variable goes on the __________ axis.
فتح الحزمة
افتح القفل للوصول البطاقات البالغ عددها 96 في هذه المجموعة.
فتح الحزمة
k this deck
64
A(n)__________ is a table showing the correlations among several variables.
فتح الحزمة
افتح القفل للوصول البطاقات البالغ عددها 96 في هذه المجموعة.
فتح الحزمة
k this deck
65
A scatter diagram shows a pattern of dots in which the dots generally go down and to the right. This pattern is an example of a(n)__________ correlation.
فتح الحزمة
افتح القفل للوصول البطاقات البالغ عددها 96 في هذه المجموعة.
فتح الحزمة
k this deck
66
A study finds that the scarier the movie a person is watching, the more popcorn the person will eat. This relation between scariness of movies and popcorn is an example of a(n)__________ correlation.
فتح الحزمة
افتح القفل للوصول البطاقات البالغ عددها 96 في هذه المجموعة.
فتح الحزمة
k this deck
67
A research article reports that a score is statistically significant. This means that it is unlikely that a correlation this high would have been observed in the group studied if the correlation were in fact zero for __________.
فتح الحزمة
افتح القفل للوصول البطاقات البالغ عددها 96 في هذه المجموعة.
فتح الحزمة
k this deck
68
A(n)__________ is a graphic display of the pattern of relationship between two variables.
فتح الحزمة
افتح القفل للوصول البطاقات البالغ عددها 96 في هذه المجموعة.
فتح الحزمة
k this deck
69
It is impossible for two variables to be essentially unrelated to each other. (True or False)
فتح الحزمة
افتح القفل للوصول البطاقات البالغ عددها 96 في هذه المجموعة.
فتح الحزمة
k this deck
70
When using Z scores, the cross-product of a high score with a high score will always be __________.
فتح الحزمة
افتح القفل للوصول البطاقات البالغ عددها 96 في هذه المجموعة.
فتح الحزمة
k this deck
71
A perfect linear correlation means that all the dots fall exactly on the straight line. (True or False)
فتح الحزمة
افتح القفل للوصول البطاقات البالغ عددها 96 في هذه المجموعة.
فتح الحزمة
k this deck
72
If the true pattern of association between variables is curvilinear, figuring the correlation in the usual way could result in little or no correlation. (True or False)
فتح الحزمة
افتح القفل للوصول البطاقات البالغ عددها 96 في هذه المجموعة.
فتح الحزمة
k this deck
73
Multiplying a person's Z score on one variable by the person's Z score on another variable creates what is called a(n)__________ of Z scores.
فتح الحزمة
افتح القفل للوصول البطاقات البالغ عددها 96 في هذه المجموعة.
فتح الحزمة
k this deck
74
When a research article reports r = .35, p < .05, the "p < .05" means that the result is statistically __________.
فتح الحزمة
افتح القفل للوصول البطاقات البالغ عددها 96 في هذه المجموعة.
فتح الحزمة
k this deck
75
In a perfect linear correlation, the dots in a scatter diagram all fall __________.
فتح الحزمة
افتح القفل للوصول البطاقات البالغ عددها 96 في هذه المجموعة.
فتح الحزمة
k this deck
76
A scatter diagram shows a pattern in which the dots go roughly straight across and then about halfway across start going down. This is an example of a(n)__________ correlation.
فتح الحزمة
افتح القفل للوصول البطاقات البالغ عددها 96 في هذه المجموعة.
فتح الحزمة
k this deck
77
A scatter diagram in which the dots form a kind of upside-down "U" shape is an example of a(n)__________ correlation.
فتح الحزمة
افتح القفل للوصول البطاقات البالغ عددها 96 في هذه المجموعة.
فتح الحزمة
k this deck
78
When high scores go with high scores, and low with low, the correlation coefficient will be between _________ and __________.
فتح الحزمة
افتح القفل للوصول البطاقات البالغ عددها 96 في هذه المجموعة.
فتح الحزمة
k this deck
79
A study finds that the longer a book, the less willing children are to read it. This relation between book length and children's interest is an example of a(n)__________ correlation.
فتح الحزمة
افتح القفل للوصول البطاقات البالغ عددها 96 في هذه المجموعة.
فتح الحزمة
k this deck
80
When using Z scores, the cross-product of a high score with a low score will always be __________.
فتح الحزمة
افتح القفل للوصول البطاقات البالغ عددها 96 في هذه المجموعة.
فتح الحزمة
k this deck
فتح الحزمة
افتح القفل للوصول البطاقات البالغ عددها 96 في هذه المجموعة.


