Deck 5: Exploring Data With Graphs
ملء الشاشة (f)
سؤال
What is this graph known as? 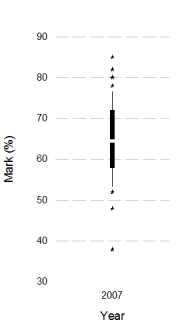
A)A box-whisker diagram
B)A scatterplot
C)A histogram
D)An error bar chart
A)A box-whisker diagram
B)A scatterplot
C)A histogram
D)An error bar chart
سؤال
In IBM SPSS,what is this graph known as? 
A)Simple bar chart
B)Clustered bar chart
C)A histogram
C)Frequency polygon
A)Simple bar chart
B)Clustered bar chart
C)A histogram
C)Frequency polygon
سؤال
سؤال
سؤال
In IBM SPSS,the following graph is known as a: 
A)Simple scatterplot
B)Scatterplot matrix
C)Summary point plot
D)Grouped scatterplot
A)Simple scatterplot
B)Scatterplot matrix
C)Summary point plot
D)Grouped scatterplot
سؤال
What is the graph below known as? 
A)1-D boxplot
B)Clustered bar chart
C)Clustered boxplot
D)Simple boxplot
A)1-D boxplot
B)Clustered bar chart
C)Clustered boxplot
D)Simple boxplot
سؤال
Looking at the graph below,which of the following statements are correct? 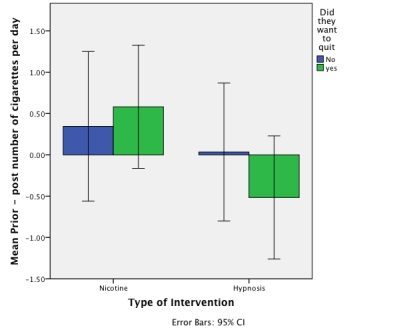
A)On average,for those who wanted to quit smoking,the nicotine patches reduced the number of cigarettes smoked per day,whereas hypnosis actually increased the number of cigarettes smoked per day.
B)On average,the nicotine intervention was more successful in those who wanted to quit smoking than in those who did not want to quit,whereas the hypnosis intervention was more successful in those who did not want to quit smoking than in those who did.
C)All of the statements are correct.
D)Overall,the nicotine intervention was the most successful at reducing the number of cigarettes smoked per day.
سؤال
Approximately what is the mean success score for those who wanted to quit in the hypnosis group? 
A)The graph does not display the mean.
B)-1.00
C)1.00
D)0.00
A)The graph does not display the mean.
B)-1.00
C)1.00
D)0.00
سؤال
Based on the chart,what was the interquartile range of marks (approximately). 
A)7%
B)22%
C)47%
D)14%
A)7%
B)22%
C)47%
D)14%
سؤال
Looking at the graph below,approximately what was the median success score for the nicotine group? 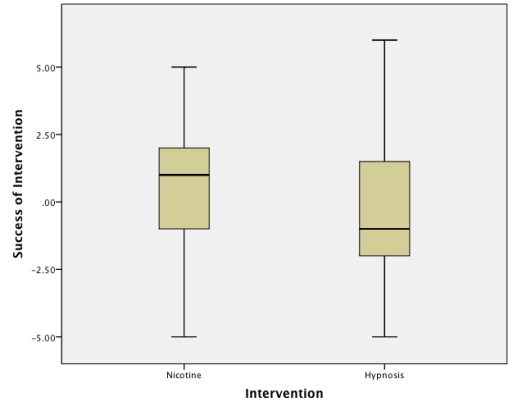
A)-5.00
B)1.00
C)2.00
D)-1.00c.
A)-5.00
B)1.00
C)2.00
D)-1.00c.
سؤال
Looking at the graph below,which intervention was the most successful at reducing the number of cigarettes smoked each day in those who did not want to quit? 
A)Nicotine patches
B)Hypnosis
C)Both interventions were equally successful.
D)Neither group had any effect at all.b.
A)Nicotine patches
B)Hypnosis
C)Both interventions were equally successful.
D)Neither group had any effect at all.b.
سؤال
Based on the chart,what was the median mark (approximately)? 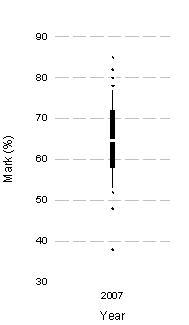
A)58%
B)77%
C)65%
D)72%
A)58%
B)77%
C)65%
D)72%
سؤال
What can we say about the graph below? 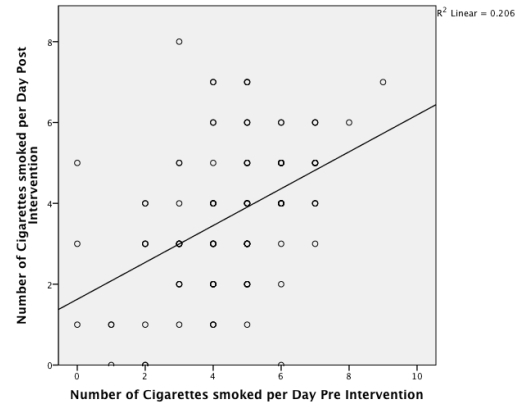
A)There is a negative relationship between the number of cigarettes smoked per day before the intervention and the number of cigarettes smoked after the intervention.
B)There is no relationship between the two variables
C)The participants who smoked the most cigarettes per day before the intervention,smoked the fewest cigarettes per day after the intervention.
D)There is a positive relationship between the number of cigarettes smoked per day before the intervention and the number of cigarettes smoked after the intervention..
سؤال
Looking at the graph below,which intervention was the most successful at reducing the number of cigarettes smoked each day in those who wanted to quit? 
A)Both interventions were equally successful.
B)Neither group had any effect.
C)Nicotine patches
D)Hypnosis
A)Both interventions were equally successful.
B)Neither group had any effect.
C)Nicotine patches
D)Hypnosis
سؤال
A study was done to investigate the effect of 'motivation to quit' on the success rate of a new intervention developed to reduce the number of cigarettes smoked per day in a group of smokers.Looking at the graph below,what can we say about the relationship between motivation to quit and the success rate of the intervention? 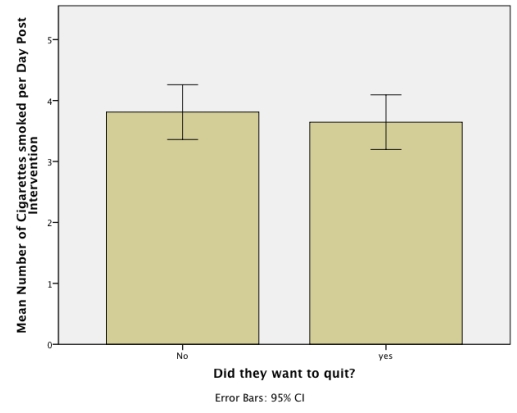
A)Whether a person wanted to quit smoking had no effect on the success of the smoking intervention.
B)There were the same number of people who wanted to quit smoking as who didn't.
C)We can't say anything about the success of the intervention because the graph does not take into account the number of cigarettes smoked per day pre-intervention.
D)The medians were the same in people who wanted to quit smoking and those that didn't.
سؤال
What does the graph below show? 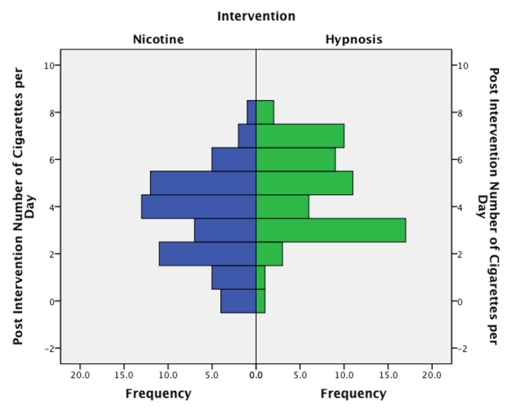
A)Both groups show a positively skewed distribution.
B)Both groups show a negatively skewed distribution.
C)For those who used nicotine patches there is a fairly normal distribution,whereas those who used hypnosis show a slightly negatively skewed distribution.
D)For those who used nicotine patches there is a fairly normal distribution,whereas those who used hypnosis show a positively skewed distribution.
سؤال
What is the graph below known as? 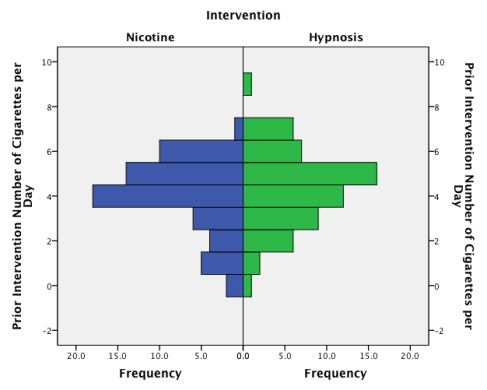
A)Population pyramid
B)Stacked histogram
C)Frequency polygon
D)Stacked bar chart
A)Population pyramid
B)Stacked histogram
C)Frequency polygon
D)Stacked bar chart
سؤال
Which of the following statements best describes the graph below? 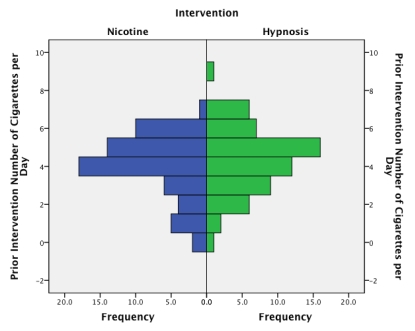
A)The graph shows that for those who used nicotine patches there is a fairly normal distribution,whereas those who used hypnosis show a skewed distribution,where a very small proportion of people (relative to those using nicotine)smoke more than 2 cigarettes per day.
B)The graph shows that for those who used hypnosis there is a fairly normal distribution,whereas those who used nicotine patches show a skewed distribution,where a very large proportion of people (relative to those using nicotine)smoke less than 4 cigarettes per day.
C)The graph looks fairly unsymmetrical,indicating that the two groups are from different populations.
D)The graph looks fairly symmetrical.This indicates that both groups had a similar spread of scores before the intervention.
سؤال
سؤال
Approximately what is the median success score for those in the hypnosis group who did not want to quit? 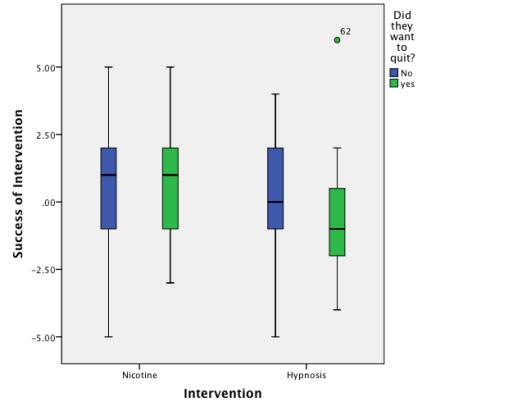
A)1.00
B)0.00
C)-1.00
D)2.00
A)1.00
B)0.00
C)-1.00
D)2.00
سؤال
We took a sample of children who had been learning to play a musical instrument for five years.We measured the number of hours they spent practising each week and assessed their musical skill by how many of 8 increasingly difficult exams they had passed.We also asked them whether their parents forced them to practise or not (were their parents pushy?).What does the graph suggest about children who spend approximately 1 hour practising a week? 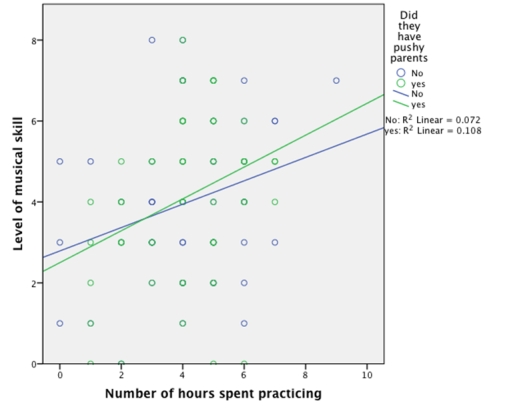
A)They were less affected by having a pushy parent than those that practised for 7 hours.
B)They had less variability in their ability than those who didn't practise at all.
C)On average,these children will be more musically skilled if they do not have pushy parents than if they do have pushy parents.
D)On average,these children will be more musically skilled if they have pushy parents than if they do not have pushy parents.
سؤال
The graph below shows the mean success rate of cutting down on smoking (positive score = success)in people who wanted to quit and people who did not want to quit.Which of the following statements is the most true? 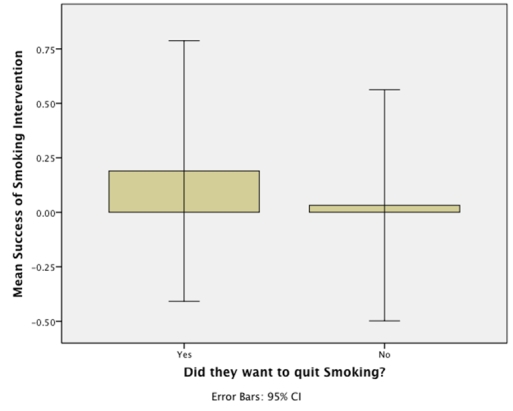
A)On average,people who wanted to quit were 25 times more successful than those who did not.
B)On average,success was six times higher in people who wanted to quit than in those who did not.
C)The average success was significantly higher in people who wanted to quit.
D)The effect in the population is likely to be the same for those who did and did not want to quit.
سؤال
We took a sample of children who had been learning to play a musical instrument for five years.We measured the number of hours they spent practising each week and assessed their musical skill by how many of 8 increasingly difficult exams they had passed.We also asked them whether their parents forced them to practise or not (were their parents pushy?).What does the following graph show? 
A)The more time spent practising,the more musically skilled the children were and this relationship was stronger for those who had pushy parents compared to those who did not.
B)The more time spent practising,the more musically skilled the children were,and this relationship was stronger for children who did not have pushy parents than for those who did.
C)Children with pushy parents always passed more grade exams than those without.
D)Practice causes better exam performance.

فتح الحزمة
قم بالتسجيل لفتح البطاقات في هذه المجموعة!
Unlock Deck
Unlock Deck
1/23
العب
ملء الشاشة (f)
Deck 5: Exploring Data With Graphs
1
What is this graph known as?
A)A box-whisker diagram
B)A scatterplot
C)A histogram
D)An error bar chart
A)A box-whisker diagram
B)A scatterplot
C)A histogram
D)An error bar chart
A
2
In IBM SPSS,what is this graph known as?
A)Simple bar chart
B)Clustered bar chart
C)A histogram
C)Frequency polygon
A)Simple bar chart
B)Clustered bar chart
C)A histogram
C)Frequency polygon
B
3
What does a histogram show?
A)A histogram is a graph in which values of observations are plotted on the horizontal axis,and the frequency with which each value occurs in the data set is plotted on the vertical axis.
B)A histogram is a graph in which values of observations are plotted on the horizontal axis,and their density is plotted on the vertical axis.
C)A histogram is a graph in which levels of the independent variable are plotted on the horizontal axis,and the mean of observations is plotted on the vertical axis.
D)A histogram is a graph in which values of one variable are plotted against values of a different variable.
A
4
Imagine we took a group of smokers,recorded the number of cigarettes they smoked each day,whether they wanted to quit smoking or not,and then split them randomly into one of two 6-week interventions; 'hypnosis' or 'nicotine patch'.After the 6 weeks,we again recorded how many cigarettes they smoked each day and subtracted this number from the number of cigarettes they each smoked pre-intervention,to produce an intervention success score for each participant.Out of the following options,which would be the best method of looking at which intervention was the most successful,taking into account whether the participant wanted to quit or not?
A)Clustered boxplot
B)Frequency polygon
C)Simple histogram
D)Population pyramidb.
A)Clustered boxplot
B)Frequency polygon
C)Simple histogram
D)Population pyramidb.
فتح الحزمة
افتح القفل للوصول البطاقات البالغ عددها 23 في هذه المجموعة.
فتح الحزمة
k this deck
5
In IBM SPSS,the following graph is known as a:
A)Simple scatterplot
B)Scatterplot matrix
C)Summary point plot
D)Grouped scatterplot
A)Simple scatterplot
B)Scatterplot matrix
C)Summary point plot
D)Grouped scatterplot
فتح الحزمة
افتح القفل للوصول البطاقات البالغ عددها 23 في هذه المجموعة.
فتح الحزمة
k this deck
6
What is the graph below known as?
A)1-D boxplot
B)Clustered bar chart
C)Clustered boxplot
D)Simple boxplot
A)1-D boxplot
B)Clustered bar chart
C)Clustered boxplot
D)Simple boxplot
فتح الحزمة
افتح القفل للوصول البطاقات البالغ عددها 23 في هذه المجموعة.
فتح الحزمة
k this deck
7
Looking at the graph below,which of the following statements are correct?
A)On average,for those who wanted to quit smoking,the nicotine patches reduced the number of cigarettes smoked per day,whereas hypnosis actually increased the number of cigarettes smoked per day.
B)On average,the nicotine intervention was more successful in those who wanted to quit smoking than in those who did not want to quit,whereas the hypnosis intervention was more successful in those who did not want to quit smoking than in those who did.
C)All of the statements are correct.
D)Overall,the nicotine intervention was the most successful at reducing the number of cigarettes smoked per day.
فتح الحزمة
افتح القفل للوصول البطاقات البالغ عددها 23 في هذه المجموعة.
فتح الحزمة
k this deck
8
Approximately what is the mean success score for those who wanted to quit in the hypnosis group?
A)The graph does not display the mean.
B)-1.00
C)1.00
D)0.00
A)The graph does not display the mean.
B)-1.00
C)1.00
D)0.00
فتح الحزمة
افتح القفل للوصول البطاقات البالغ عددها 23 في هذه المجموعة.
فتح الحزمة
k this deck
9
Based on the chart,what was the interquartile range of marks (approximately).
A)7%
B)22%
C)47%
D)14%
A)7%
B)22%
C)47%
D)14%
فتح الحزمة
افتح القفل للوصول البطاقات البالغ عددها 23 في هذه المجموعة.
فتح الحزمة
k this deck
10
Looking at the graph below,approximately what was the median success score for the nicotine group?
A)-5.00
B)1.00
C)2.00
D)-1.00c.
A)-5.00
B)1.00
C)2.00
D)-1.00c.
فتح الحزمة
افتح القفل للوصول البطاقات البالغ عددها 23 في هذه المجموعة.
فتح الحزمة
k this deck
11
Looking at the graph below,which intervention was the most successful at reducing the number of cigarettes smoked each day in those who did not want to quit?
A)Nicotine patches
B)Hypnosis
C)Both interventions were equally successful.
D)Neither group had any effect at all.b.
A)Nicotine patches
B)Hypnosis
C)Both interventions were equally successful.
D)Neither group had any effect at all.b.
فتح الحزمة
افتح القفل للوصول البطاقات البالغ عددها 23 في هذه المجموعة.
فتح الحزمة
k this deck
12
Based on the chart,what was the median mark (approximately)?
A)58%
B)77%
C)65%
D)72%
A)58%
B)77%
C)65%
D)72%
فتح الحزمة
افتح القفل للوصول البطاقات البالغ عددها 23 في هذه المجموعة.
فتح الحزمة
k this deck
13
What can we say about the graph below?
A)There is a negative relationship between the number of cigarettes smoked per day before the intervention and the number of cigarettes smoked after the intervention.
B)There is no relationship between the two variables
C)The participants who smoked the most cigarettes per day before the intervention,smoked the fewest cigarettes per day after the intervention.
D)There is a positive relationship between the number of cigarettes smoked per day before the intervention and the number of cigarettes smoked after the intervention..
فتح الحزمة
افتح القفل للوصول البطاقات البالغ عددها 23 في هذه المجموعة.
فتح الحزمة
k this deck
14
Looking at the graph below,which intervention was the most successful at reducing the number of cigarettes smoked each day in those who wanted to quit?
A)Both interventions were equally successful.
B)Neither group had any effect.
C)Nicotine patches
D)Hypnosis
A)Both interventions were equally successful.
B)Neither group had any effect.
C)Nicotine patches
D)Hypnosis
فتح الحزمة
افتح القفل للوصول البطاقات البالغ عددها 23 في هذه المجموعة.
فتح الحزمة
k this deck
15
A study was done to investigate the effect of 'motivation to quit' on the success rate of a new intervention developed to reduce the number of cigarettes smoked per day in a group of smokers.Looking at the graph below,what can we say about the relationship between motivation to quit and the success rate of the intervention?
A)Whether a person wanted to quit smoking had no effect on the success of the smoking intervention.
B)There were the same number of people who wanted to quit smoking as who didn't.
C)We can't say anything about the success of the intervention because the graph does not take into account the number of cigarettes smoked per day pre-intervention.
D)The medians were the same in people who wanted to quit smoking and those that didn't.
فتح الحزمة
افتح القفل للوصول البطاقات البالغ عددها 23 في هذه المجموعة.
فتح الحزمة
k this deck
16
What does the graph below show?
A)Both groups show a positively skewed distribution.
B)Both groups show a negatively skewed distribution.
C)For those who used nicotine patches there is a fairly normal distribution,whereas those who used hypnosis show a slightly negatively skewed distribution.
D)For those who used nicotine patches there is a fairly normal distribution,whereas those who used hypnosis show a positively skewed distribution.
فتح الحزمة
افتح القفل للوصول البطاقات البالغ عددها 23 في هذه المجموعة.
فتح الحزمة
k this deck
17
What is the graph below known as?
A)Population pyramid
B)Stacked histogram
C)Frequency polygon
D)Stacked bar chart
A)Population pyramid
B)Stacked histogram
C)Frequency polygon
D)Stacked bar chart
فتح الحزمة
افتح القفل للوصول البطاقات البالغ عددها 23 في هذه المجموعة.
فتح الحزمة
k this deck
18
Which of the following statements best describes the graph below?
A)The graph shows that for those who used nicotine patches there is a fairly normal distribution,whereas those who used hypnosis show a skewed distribution,where a very small proportion of people (relative to those using nicotine)smoke more than 2 cigarettes per day.
B)The graph shows that for those who used hypnosis there is a fairly normal distribution,whereas those who used nicotine patches show a skewed distribution,where a very large proportion of people (relative to those using nicotine)smoke less than 4 cigarettes per day.
C)The graph looks fairly unsymmetrical,indicating that the two groups are from different populations.
D)The graph looks fairly symmetrical.This indicates that both groups had a similar spread of scores before the intervention.
فتح الحزمة
افتح القفل للوصول البطاقات البالغ عددها 23 في هذه المجموعة.
فتح الحزمة
k this deck
19
Imagine we took a group of smokers,recorded how many cigarettes they smoked each day and then split them randomly into one of two 6-week interventions; 'hypnosis' or 'nicotine patch'.After the 6 weeks,we again recorded how many cigarettes they smoked each day and subtracted this number from the number of cigarettes they each smoked pre-intervention,to produce a intervention success score for each participant.Out of the following options,which would be the best method of displaying the results?
A)A simple bar chart with the variable 'intervention method' on the y-axis and 'intervention success' on the x-axis.
B)A simple boxplot with the variable 'intervention method' on the x-axis and 'intervention success' on the y-axis.
C)A clustered boxplot with 'intervention success' on the y-axis and 'intervention method' on the x-axis
D)A simple boxplot with the variable 'intervention method' on the y-axis and 'intervention success' on the x-axis.
فتح الحزمة
افتح القفل للوصول البطاقات البالغ عددها 23 في هذه المجموعة.
فتح الحزمة
k this deck
20
Approximately what is the median success score for those in the hypnosis group who did not want to quit?
A)1.00
B)0.00
C)-1.00
D)2.00
A)1.00
B)0.00
C)-1.00
D)2.00
فتح الحزمة
افتح القفل للوصول البطاقات البالغ عددها 23 في هذه المجموعة.
فتح الحزمة
k this deck
21
We took a sample of children who had been learning to play a musical instrument for five years.We measured the number of hours they spent practising each week and assessed their musical skill by how many of 8 increasingly difficult exams they had passed.We also asked them whether their parents forced them to practise or not (were their parents pushy?).What does the graph suggest about children who spend approximately 1 hour practising a week?
A)They were less affected by having a pushy parent than those that practised for 7 hours.
B)They had less variability in their ability than those who didn't practise at all.
C)On average,these children will be more musically skilled if they do not have pushy parents than if they do have pushy parents.
D)On average,these children will be more musically skilled if they have pushy parents than if they do not have pushy parents.
فتح الحزمة
افتح القفل للوصول البطاقات البالغ عددها 23 في هذه المجموعة.
فتح الحزمة
k this deck
22
The graph below shows the mean success rate of cutting down on smoking (positive score = success)in people who wanted to quit and people who did not want to quit.Which of the following statements is the most true?
A)On average,people who wanted to quit were 25 times more successful than those who did not.
B)On average,success was six times higher in people who wanted to quit than in those who did not.
C)The average success was significantly higher in people who wanted to quit.
D)The effect in the population is likely to be the same for those who did and did not want to quit.
فتح الحزمة
افتح القفل للوصول البطاقات البالغ عددها 23 في هذه المجموعة.
فتح الحزمة
k this deck
23
We took a sample of children who had been learning to play a musical instrument for five years.We measured the number of hours they spent practising each week and assessed their musical skill by how many of 8 increasingly difficult exams they had passed.We also asked them whether their parents forced them to practise or not (were their parents pushy?).What does the following graph show?
A)The more time spent practising,the more musically skilled the children were and this relationship was stronger for those who had pushy parents compared to those who did not.
B)The more time spent practising,the more musically skilled the children were,and this relationship was stronger for children who did not have pushy parents than for those who did.
C)Children with pushy parents always passed more grade exams than those without.
D)Practice causes better exam performance.
فتح الحزمة
افتح القفل للوصول البطاقات البالغ عددها 23 في هذه المجموعة.
فتح الحزمة
k this deck
فتح الحزمة
افتح القفل للوصول البطاقات البالغ عددها 23 في هذه المجموعة.


