Deck 15: Glm 4: Repeated-Measures Designs
ملء الشاشة (f)
سؤال
سؤال
The following SPSS output represents three conditions (based on groups of individuals capacity to undertake a specific test in relation to computer use) and sphericity has not been violated. How would the difference between conditions be reported? 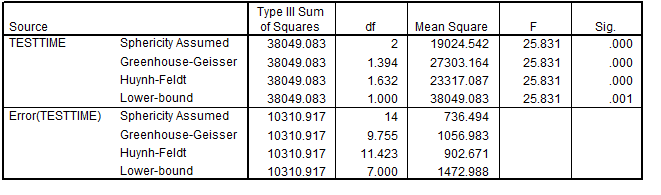 Source:http:/ / www.lifesci.sussex.ac.uk/ home/ Zoltan_Dienes/ RM%20II%20SPSS%20repeated%20measures.doc
A) F(2,14) = 25.83, p > 0.001
B) F(2,14) = 25.83, p < 0.01
C) F(1,7) = 25.83, p > 0.001
D) F(1,7) = 25.83, p < 0.01
Source:http:/ / www.lifesci.sussex.ac.uk/ home/ Zoltan_Dienes/ RM%20II%20SPSS%20repeated%20measures.docA) F(2,14) = 25.83, p > 0.001
B) F(2,14) = 25.83, p < 0.01
C) F(1,7) = 25.83, p > 0.001
D) F(1,7) = 25.83, p < 0.01
سؤال
سؤال
In the analysis of the table below, the SS are all the same no matter which sphericity correction is applied. This means 
A) The data across all levels is uncorrelated
B) The data across all levels is correlated
C) The distributions across the levels forms a sphere
D) Not enough information
A) The data across all levels is uncorrelated
B) The data across all levels is correlated
C) The distributions across the levels forms a sphere
D) Not enough information
سؤال
سؤال
سؤال
سؤال
سؤال
سؤال
سؤال
An experiment was carried out in which participants learned words in several conditions: no learning strategy, a verbal learning strategy, visual one and a verbal-visual one. The table below outlines the results from this experiment? What does this table indicate? Tests of Within-Subjects Effects
Measure: MEASURE_1
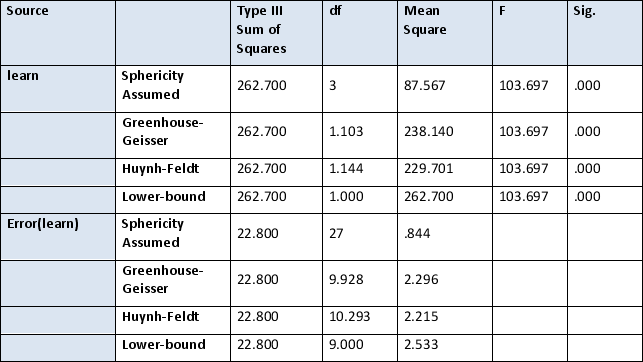
A) There is too much sphericity in the model.
B) There are too many errors in the model.
C) The null hypothesis can be rejected.
D) The null hypothesis must be rejected.
Measure: MEASURE_1
A) There is too much sphericity in the model.
B) There are too many errors in the model.
C) The null hypothesis can be rejected.
D) The null hypothesis must be rejected.
سؤال
سؤال
سؤال
سؤال
سؤال
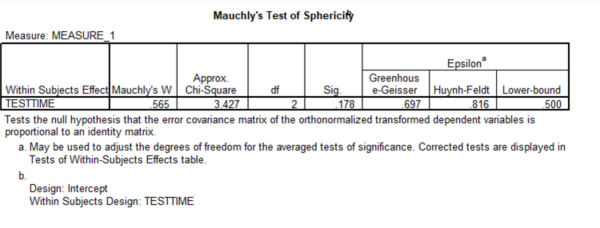
In the output below, what does Mauchly's test of sphericity indicate?
 Source:http:/ / www.lifesci.sussex.ac.uk/ home/ Zoltan_Dienes/ RM%20II%20SPSS%20repeated%20measures.doc
A) Not significant
B) Significant
C) Highly significant
D) None of the above
Source:http:/ / www.lifesci.sussex.ac.uk/ home/ Zoltan_Dienes/ RM%20II%20SPSS%20repeated%20measures.docA) Not significant
B) Significant
C) Highly significant
D) None of the above
سؤال
In a study examining attitudes to ethnic minorities the following output was obtained via SPSS. Assuming sphericity, how would the result be reported?  Source: http:/ / www.visualstatistics.net/ SPSS%20workbook/ one-way_repeated_measures_anova.htm
A) F(3,18) = 61.465, p < .01
B) F(3,18) = 61.465, p < .05
C) F(2.44,14.62) = 76.63 p < .01
D) F(2.44,14.62) = 76.63 p < .05
Source: http:/ / www.visualstatistics.net/ SPSS%20workbook/ one-way_repeated_measures_anova.htmA) F(3,18) = 61.465, p < .01
B) F(3,18) = 61.465, p < .05
C) F(2.44,14.62) = 76.63 p < .01
D) F(2.44,14.62) = 76.63 p < .05
سؤال
سؤال
سؤال
سؤال
In a study examining attitudes to ethnic minorities the following output was obtained via SPSS. In relation to this same experiment and the SPSS output detailed below, what does the information in the following box plot demonstrate? 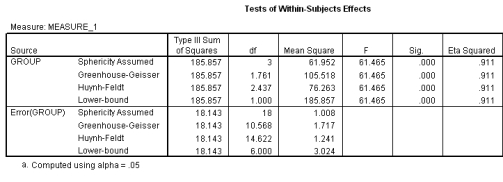
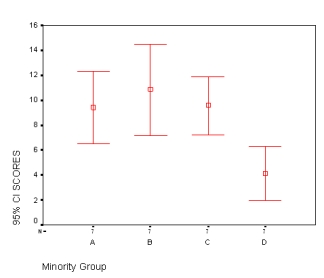
A) Confidence intervals in A, B and C overlap.
B) Confidence intervals in B, C and D overlap.
C) Confidence intervals in D, A and B overlap.
D) None of the above.
A) Confidence intervals in A, B and C overlap.
B) Confidence intervals in B, C and D overlap.
C) Confidence intervals in D, A and B overlap.
D) None of the above.
سؤال
In terms of Mauchly's test of sphericity, what does the table below indicate? 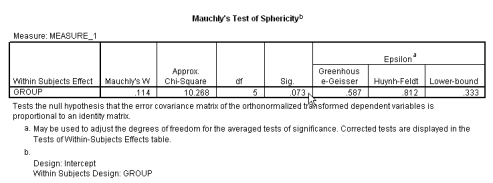 Source: http:/ / www.visualstatistics.net/ SPSS%20workbook/ one-way_repeated_measures_anova.htm
A) The hypothesis of sphericity is accepted.
B) The hypothesis of sphericity is rejected.
C) The hypothesis of sphericity is significant.
D) None of the above.
Source: http:/ / www.visualstatistics.net/ SPSS%20workbook/ one-way_repeated_measures_anova.htmA) The hypothesis of sphericity is accepted.
B) The hypothesis of sphericity is rejected.
C) The hypothesis of sphericity is significant.
D) None of the above.

فتح الحزمة
قم بالتسجيل لفتح البطاقات في هذه المجموعة!
Unlock Deck
Unlock Deck
1/22
العب
ملء الشاشة (f)
Deck 15: Glm 4: Repeated-Measures Designs
1
When repeated measures are used, which assumption is violated?
A) Scores in the same conditions are dependent.
B) Scores in the same conditions are independent.
C) Scores in different conditions are independent.
D) Scores in different conditions are dependent.
A) Scores in the same conditions are dependent.
B) Scores in the same conditions are independent.
C) Scores in different conditions are independent.
D) Scores in different conditions are dependent.
Scores in different conditions are independent.
2
The following SPSS output represents three conditions (based on groups of individuals capacity to undertake a specific test in relation to computer use) and sphericity has not been violated. How would the difference between conditions be reported? Source:http:/ / www.lifesci.sussex.ac.uk/ home/ Zoltan_Dienes/ RM%20II%20SPSS%20repeated%20measures.doc
A) F(2,14) = 25.83, p > 0.001
B) F(2,14) = 25.83, p < 0.01
C) F(1,7) = 25.83, p > 0.001
D) F(1,7) = 25.83, p < 0.01
Source:http:/ / www.lifesci.sussex.ac.uk/ home/ Zoltan_Dienes/ RM%20II%20SPSS%20repeated%20measures.docA) F(2,14) = 25.83, p > 0.001
B) F(2,14) = 25.83, p < 0.01
C) F(1,7) = 25.83, p > 0.001
D) F(1,7) = 25.83, p < 0.01
F(1,7) = 25.83, p < 0.01
3
What is not an advantage of repeated-measures designs in comparison to independent measures designs?
A) Each participant acts as their own control.
B) Researchers can study cross-cultural effects more easily.
C) Researchers can study trends more easily.
D) They require fewer participants overall.
A) Each participant acts as their own control.
B) Researchers can study cross-cultural effects more easily.
C) Researchers can study trends more easily.
D) They require fewer participants overall.
Researchers can study cross-cultural effects more easily.
4
In the analysis of the table below, the SS are all the same no matter which sphericity correction is applied. This means
A) The data across all levels is uncorrelated
B) The data across all levels is correlated
C) The distributions across the levels forms a sphere
D) Not enough information
A) The data across all levels is uncorrelated
B) The data across all levels is correlated
C) The distributions across the levels forms a sphere
D) Not enough information
فتح الحزمة
افتح القفل للوصول البطاقات البالغ عددها 22 في هذه المجموعة.
فتح الحزمة
k this deck
5
In a repeated-measures design with one factor of four levels and three participants, what are the residual degrees of freedom?
A) 3
B) 2
C) 12
D) 11
A) 3
B) 2
C) 12
D) 11
فتح الحزمة
افتح القفل للوصول البطاقات البالغ عددها 22 في هذه المجموعة.
فتح الحزمة
k this deck
6
What is not a form of counterbalancing?
A) Even-number algorithms
B) Odd-number algorithms
C) Random number algorithms
D) Heuristics
A) Even-number algorithms
B) Odd-number algorithms
C) Random number algorithms
D) Heuristics
فتح الحزمة
افتح القفل للوصول البطاقات البالغ عددها 22 في هذه المجموعة.
فتح الحزمة
k this deck
7
An experiment was carried out in which participants learned words in several conditions: no learning strategy, a verbal learning strategy, visual one and a verbal-visual one. What safeguard could the researchers put in place to overcome the difficulties with repeated measures?
A) Counterbalancing
B) Something to keep the participants awake
C) Measure an appropriate covariate
D) Before and after measurements
A) Counterbalancing
B) Something to keep the participants awake
C) Measure an appropriate covariate
D) Before and after measurements
فتح الحزمة
افتح القفل للوصول البطاقات البالغ عددها 22 في هذه المجموعة.
فتح الحزمة
k this deck
8
Which of the following statements about the assumption of sphericity is not true?
A) It is tested using Mauchly's test in SPSS.
B) It does not apply when a variable has only two levels.
C) It does not apply when multivariate tests are used.
D) It is the assumption that the variances for levels of a repeated-measures variable are equal.
A) It is tested using Mauchly's test in SPSS.
B) It does not apply when a variable has only two levels.
C) It does not apply when multivariate tests are used.
D) It is the assumption that the variances for levels of a repeated-measures variable are equal.
فتح الحزمة
افتح القفل للوصول البطاقات البالغ عددها 22 في هذه المجموعة.
فتح الحزمة
k this deck
9
Which of the following is not a source of variability in repeated-measures ANOVA
A) Between factors
B) Between treatments
C) Between individuals
D) Residual
A) Between factors
B) Between treatments
C) Between individuals
D) Residual
فتح الحزمة
افتح القفل للوصول البطاقات البالغ عددها 22 في هذه المجموعة.
فتح الحزمة
k this deck
10
If sphericity is to be an issue in a repeated-measures design, what is the minimum number of conditions required?
A) 1
B) 2
C) 3
D) None of the above
A) 1
B) 2
C) 3
D) None of the above
فتح الحزمة
افتح القفل للوصول البطاقات البالغ عددها 22 في هذه المجموعة.
فتح الحزمة
k this deck
11
An experiment was carried out in which participants learned words in several conditions: no learning strategy, a verbal learning strategy, visual one and a verbal-visual one. The table below outlines the results from this experiment? What does this table indicate? Tests of Within-Subjects Effects
Measure: MEASURE_1
A) There is too much sphericity in the model.
B) There are too many errors in the model.
C) The null hypothesis can be rejected.
D) The null hypothesis must be rejected.
Measure: MEASURE_1
A) There is too much sphericity in the model.
B) There are too many errors in the model.
C) The null hypothesis can be rejected.
D) The null hypothesis must be rejected.
فتح الحزمة
افتح القفل للوصول البطاقات البالغ عددها 22 في هذه المجموعة.
فتح الحزمة
k this deck
12
What is sphericity?
A) An assumption that means the data distribution must be round.
B) The critical value area of the graph is round.
C) A way of rounding up the decimal points.
D) An assumption that means the data in each level should uncorrelated.
A) An assumption that means the data distribution must be round.
B) The critical value area of the graph is round.
C) A way of rounding up the decimal points.
D) An assumption that means the data in each level should uncorrelated.
فتح الحزمة
افتح القفل للوصول البطاقات البالغ عددها 22 في هذه المجموعة.
فتح الحزمة
k this deck
13
When the assumption of sphericity is violated what action is needed?
A) Correct the model degrees of freedom.
B) Correct the error degrees of freedom.
C) Do both a and
D) Correct the F-ratio.
A) Correct the model degrees of freedom.
B) Correct the error degrees of freedom.
C) Do both a and
D) Correct the F-ratio.
فتح الحزمة
افتح القفل للوصول البطاقات البالغ عددها 22 في هذه المجموعة.
فتح الحزمة
k this deck
14
When sphericity is violated, what test statistics should be used?
A) ANCOVA
B) MANOVA
C) MANCOVA
D) None of the above
A) ANCOVA
B) MANOVA
C) MANCOVA
D) None of the above
فتح الحزمة
افتح القفل للوصول البطاقات البالغ عددها 22 في هذه المجموعة.
فتح الحزمة
k this deck
15
The Greenhouse-Geisser correction refers to
A) Temperature control
B) A way of dealing with sphericity
C) Raising the sample size
D) Lowering humidity
A) Temperature control
B) A way of dealing with sphericity
C) Raising the sample size
D) Lowering humidity
فتح الحزمة
افتح القفل للوصول البطاقات البالغ عددها 22 في هذه المجموعة.
فتح الحزمة
k this deck
16
In the output below, what does Mauchly's test of sphericity indicate?
Source:http:/ / www.lifesci.sussex.ac.uk/ home/ Zoltan_Dienes/ RM%20II%20SPSS%20repeated%20measures.doc
A) Not significant
B) Significant
C) Highly significant
D) None of the above
Source:http:/ / www.lifesci.sussex.ac.uk/ home/ Zoltan_Dienes/ RM%20II%20SPSS%20repeated%20measures.docA) Not significant
B) Significant
C) Highly significant
D) None of the above
فتح الحزمة
افتح القفل للوصول البطاقات البالغ عددها 22 في هذه المجموعة.
فتح الحزمة
k this deck
17
In a study examining attitudes to ethnic minorities the following output was obtained via SPSS. Assuming sphericity, how would the result be reported? Source: http:/ / www.visualstatistics.net/ SPSS%20workbook/ one-way_repeated_measures_anova.htm
A) F(3,18) = 61.465, p < .01
B) F(3,18) = 61.465, p < .05
C) F(2.44,14.62) = 76.63 p < .01
D) F(2.44,14.62) = 76.63 p < .05
Source: http:/ / www.visualstatistics.net/ SPSS%20workbook/ one-way_repeated_measures_anova.htmA) F(3,18) = 61.465, p < .01
B) F(3,18) = 61.465, p < .05
C) F(2.44,14.62) = 76.63 p < .01
D) F(2.44,14.62) = 76.63 p < .05
فتح الحزمة
افتح القفل للوصول البطاقات البالغ عددها 22 في هذه المجموعة.
فتح الحزمة
k this deck
18
An experiment was carried out in which participants learned words in several conditions: no learning strategy, a verbal learning strategy, a visual one and a verbal-visual one. What considerations would the researchers not need to take into account?
A) Fatigue
B) Learning effects
C) Asymmetric transfer
D) Parametric assumptions
A) Fatigue
B) Learning effects
C) Asymmetric transfer
D) Parametric assumptions
فتح الحزمة
افتح القفل للوصول البطاقات البالغ عددها 22 في هذه المجموعة.
فتح الحزمة
k this deck
19
A nutritionist conducted an experiment on memory for dreams. She wanted to test whether it really was true that eating cheese before going to bed made you have bad dreams. Over three nights, the nutritionist fed people different foods before bed. On one night they had nothing to eat, a second night they had a big plate of cheese, and the third night they had another dairy product, milk, before bed. All people were given all foods at some point over the three nights. The nutritionist measured heart rate during dreams as an index of distress. How should these data be analysed?
A) One-way independent ANOVA
B) One-way repeated measures ANOVA
C) Three-way repeated measures ANOVA
D) Three-way independent ANOVA
A) One-way independent ANOVA
B) One-way repeated measures ANOVA
C) Three-way repeated measures ANOVA
D) Three-way independent ANOVA
فتح الحزمة
افتح القفل للوصول البطاقات البالغ عددها 22 في هذه المجموعة.
فتح الحزمة
k this deck
20
If there is sphericity in a repeated-measures design the outcome could be that
A) The p-value will be too high.
B) The p-value will be too low.
C) A p-value cannot be computed.
D) The p-value will not be related to the model
A) The p-value will be too high.
B) The p-value will be too low.
C) A p-value cannot be computed.
D) The p-value will not be related to the model
فتح الحزمة
افتح القفل للوصول البطاقات البالغ عددها 22 في هذه المجموعة.
فتح الحزمة
k this deck
21
In a study examining attitudes to ethnic minorities the following output was obtained via SPSS. In relation to this same experiment and the SPSS output detailed below, what does the information in the following box plot demonstrate?
A) Confidence intervals in A, B and C overlap.
B) Confidence intervals in B, C and D overlap.
C) Confidence intervals in D, A and B overlap.
D) None of the above.
A) Confidence intervals in A, B and C overlap.
B) Confidence intervals in B, C and D overlap.
C) Confidence intervals in D, A and B overlap.
D) None of the above.
فتح الحزمة
افتح القفل للوصول البطاقات البالغ عددها 22 في هذه المجموعة.
فتح الحزمة
k this deck
22
In terms of Mauchly's test of sphericity, what does the table below indicate? Source: http:/ / www.visualstatistics.net/ SPSS%20workbook/ one-way_repeated_measures_anova.htm
A) The hypothesis of sphericity is accepted.
B) The hypothesis of sphericity is rejected.
C) The hypothesis of sphericity is significant.
D) None of the above.
Source: http:/ / www.visualstatistics.net/ SPSS%20workbook/ one-way_repeated_measures_anova.htmA) The hypothesis of sphericity is accepted.
B) The hypothesis of sphericity is rejected.
C) The hypothesis of sphericity is significant.
D) None of the above.
فتح الحزمة
افتح القفل للوصول البطاقات البالغ عددها 22 في هذه المجموعة.
فتح الحزمة
k this deck
فتح الحزمة
افتح القفل للوصول البطاقات البالغ عددها 22 في هذه المجموعة.


