Deck 3: Summarizing Scores With Measures of Central Tendency
ملء الشاشة (f)
سؤال
سؤال
سؤال
سؤال
سؤال
سؤال
سؤال
سؤال
سؤال
سؤال
سؤال
سؤال
سؤال
سؤال
سؤال
سؤال
سؤال
سؤال
سؤال
سؤال
سؤال
سؤال
سؤال
سؤال
Find the mode of the scores in the following frequency distribution. 
سؤال
سؤال
Find the mean of the scores in the following frequency distribution. 
سؤال
سؤال
For the following order of the measures of centrality, draw the shape that best describes the associated distribution. 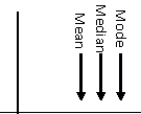
سؤال
سؤال
سؤال
سؤال
سؤال
سؤال
سؤال
سؤال
سؤال
سؤال
سؤال
سؤال
سؤال
Does the following graph indicate the existence of a relationship? Explain your answer.
Mean Number of Errors on Driving Test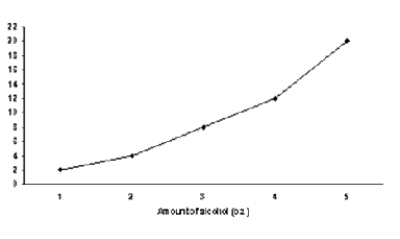
Mean Number of Errors on Driving Test
سؤال
سؤال
For the following set of scores, what is are)  ?
?
7, 8, 10, 10, 11, 12, 13, 13, 15
?7, 8, 10, 10, 11, 12, 13, 13, 15
سؤال
سؤال
سؤال
سؤال
سؤال
سؤال
سؤال
سؤال
سؤال
سؤال
Does the following graph indicate the existence of a relationship? Explain your answer. 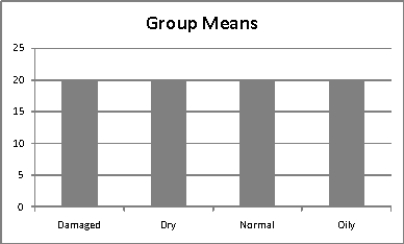
سؤال
سؤال
Based on the following results of an experiment, how many errors would a person who drank 4 oz.of alcohol make?
Mean Number of Errors on Driving Test
Mean Number of Errors on Driving Test
سؤال
سؤال
سؤال
سؤال
سؤال

فتح الحزمة
قم بالتسجيل لفتح البطاقات في هذه المجموعة!
Unlock Deck
Unlock Deck
1/60
العب
ملء الشاشة (f)
Deck 3: Summarizing Scores With Measures of Central Tendency
1
With respect to other scores in a distribution, measures of central tendency
A)are around the other scores.
B)are the points around which most of the scores are located.
C)usually fall in the tails or extremes of the distribution.
D)are never actually equal to one of the scores in the distribution.
A)are around the other scores.
B)are the points around which most of the scores are located.
C)usually fall in the tails or extremes of the distribution.
D)are never actually equal to one of the scores in the distribution.
B
2
With respect to a graph of a frequency distribution, a positive deviation score
A)will be located to the right of the mean.
B)will be located to the left of the mean.
C)cannot be found.
D)indicates the raw score's location relative to the median.
A)will be located to the right of the mean.
B)will be located to the left of the mean.
C)cannot be found.
D)indicates the raw score's location relative to the median.
A
3
Adding numbers is an important procedure in statistics.Instead of saying "add up all of the scores," we use the symbol
A)N.
B)X.
C)Σ.
D)Y.
A)N.
B)X.
C)Σ.
D)Y.
C
4
The mode is defined as
A)the most frequently occurring score.
B)the mathematical center of the distribution.
C)the smallest deviation from the mean.
D)the point at or below which 50% of the scores fall.
A)the most frequently occurring score.
B)the mathematical center of the distribution.
C)the smallest deviation from the mean.
D)the point at or below which 50% of the scores fall.
فتح الحزمة
افتح القفل للوصول البطاقات البالغ عددها 60 في هذه المجموعة.
فتح الحزمة
k this deck
5
Why shouldn't the mode be used with the following set of scores? 2, 5, 3, 3, 4, 2, 4, 5, 1, 1
A)The data are obviously not nominal.
B)There is no mode.
C)The scores are positively skewed.
D)The scores are negatively skewed.
A)The data are obviously not nominal.
B)There is no mode.
C)The scores are positively skewed.
D)The scores are negatively skewed.
فتح الحزمة
افتح القفل للوصول البطاقات البالغ عددها 60 في هذه المجموعة.
فتح الحزمة
k this deck
6
The mean is the preferred measure of central tendency when
A)the scale of measurement is interval.
B)the scale of measurement is ordinal, interval, or ratio, and the distribution is skewed.
C)the scale of measurement is ratio.
D)the distribution is symmetrical, and the scale of measurement is interval or ratio.
A)the scale of measurement is interval.
B)the scale of measurement is ordinal, interval, or ratio, and the distribution is skewed.
C)the scale of measurement is ratio.
D)the distribution is symmetrical, and the scale of measurement is interval or ratio.
فتح الحزمة
افتح القفل للوصول البطاقات البالغ عددها 60 في هذه المجموعة.
فتح الحزمة
k this deck
7
When we graph results from an experiment, a line graph is appropriate when
A)the independent variable is interval or ratio.
B)the independent variable is nominal or ordinal.
C)the dependent variable is nominal or ordinal.
D)the dependent variable is interval or ratio.
A)the independent variable is interval or ratio.
B)the independent variable is nominal or ordinal.
C)the dependent variable is nominal or ordinal.
D)the dependent variable is interval or ratio.
فتح الحزمة
افتح القفل للوصول البطاقات البالغ عددها 60 في هذه المجموعة.
فتح الحزمة
k this deck
8
An experimenter investigated the ability to concentrate under different conditions of crowding.Concentration was measured as the amount of time it took the participant to complete a word puzzle.How should the experimenter summarize the scores on the dependent variable?
A)Find the mode for crowding because crowding scores are nominal.
B)Find the mean amount of crowding, if crowding scores are normally distributed.
C)Find the mean amount of time it took to solve the puzzle, if time scores are normally distributed.
D)Find the median amount of time it took to solve the puzzle because time scores are ordinal.
فتح الحزمة
افتح القفل للوصول البطاقات البالغ عددها 60 في هذه المجموعة.
فتح الحزمة
k this deck
9
To obtain the mean, we would
A)count all the scores and divide by the total number of scores.
B)add all the scores and divide by the sum of all the scores.
C)divide the total number of scores by the sum of all the scores.
D)add all the scores and divide by the total number of scores.
A)count all the scores and divide by the total number of scores.
B)add all the scores and divide by the sum of all the scores.
C)divide the total number of scores by the sum of all the scores.
D)add all the scores and divide by the total number of scores.
فتح الحزمة
افتح القفل للوصول البطاقات البالغ عددها 60 في هذه المجموعة.
فتح الحزمة
k this deck
10
The mean is used most often in behavioral research because researchers tend to
A)measure variables that have interval or ratio scores, and the scores form approximately normal distributions.
B)conduct research in which the mathematical center of a distribution is required.
C)conduct research in which only the most frequently occurring score is needed.
D)measure variables that have interval or ratio scores, and the scores usually do not form a normal distribution.
فتح الحزمة
افتح القفل للوصول البطاقات البالغ عددها 60 في هذه المجموعة.
فتح الحزمة
k this deck
11
When we graph the results of an experiment, the Y axis indicates the
A)measure of central tendency we have used for the dependent variable.
B)raw score values for each subject on the dependent variable.
C)raw score values for each subject on the independent variable.
D)levels of the independent variable.
A)measure of central tendency we have used for the dependent variable.
B)raw score values for each subject on the dependent variable.
C)raw score values for each subject on the independent variable.
D)levels of the independent variable.
فتح الحزمة
افتح القفل للوصول البطاقات البالغ عددها 60 في هذه المجموعة.
فتح الحزمة
k this deck
12
The median is defined as
A)the most frequently occurring score.
B)the mathematical center of the distribution.
C)the smallest deviation from the mean.
D)the point at or below which 50% of the scores fall.
A)the most frequently occurring score.
B)the mathematical center of the distribution.
C)the smallest deviation from the mean.
D)the point at or below which 50% of the scores fall.
فتح الحزمة
افتح القفل للوصول البطاقات البالغ عددها 60 في هذه المجموعة.
فتح الحزمة
k this deck
13
A deviation is more informative than a raw score because it
A)describes the shape of the distribution.
B)has a greater numeric value.
C)is a transformation of the raw score.
D)gives the score's location relative to the mean.
A)describes the shape of the distribution.
B)has a greater numeric value.
C)is a transformation of the raw score.
D)gives the score's location relative to the mean.
فتح الحزمة
افتح القفل للوصول البطاقات البالغ عددها 60 في هذه المجموعة.
فتح الحزمة
k this deck
14
The median is the appropriate measure of central tendency when
A)the scale of measurement is nominal.
B)the scores are ordinal, or when the distribution is skewed and the scores are interval or ratio.
C)the scale of measurement is ratio.
D)the distribution is symmetrical, and the scale of measurement is interval or ratio.
A)the scale of measurement is nominal.
B)the scores are ordinal, or when the distribution is skewed and the scores are interval or ratio.
C)the scale of measurement is ratio.
D)the distribution is symmetrical, and the scale of measurement is interval or ratio.
فتح الحزمة
افتح القفل للوصول البطاقات البالغ عددها 60 في هذه المجموعة.
فتح الحزمة
k this deck
15
The best predictor of an individual score in a sample of scores is the
A)sum of the deviations of the scores from the mean.
B)score minus the mean.
C)mean of the sample of scores.
D)total error in the sample of scores.
A)sum of the deviations of the scores from the mean.
B)score minus the mean.
C)mean of the sample of scores.
D)total error in the sample of scores.
فتح الحزمة
افتح القفل للوصول البطاقات البالغ عددها 60 في هذه المجموعة.
فتح الحزمة
k this deck
16
When we refer to a score's deviation, we are referring to
A)how far it is from other scores.
B)how far it is from the mean.
C)how close it is to the other scores.
D)how much error occurred in measuring it.
A)how far it is from other scores.
B)how far it is from the mean.
C)how close it is to the other scores.
D)how much error occurred in measuring it.
فتح الحزمة
افتح القفل للوصول البطاقات البالغ عددها 60 في هذه المجموعة.
فتح الحزمة
k this deck
17
The mean is defined as
A)the most frequently occurring score.
B)the mathematical center of the distribution.
C)the smallest deviation from the center score.
D)the point at or below which 50% of the scores fall.
A)the most frequently occurring score.
B)the mathematical center of the distribution.
C)the smallest deviation from the center score.
D)the point at or below which 50% of the scores fall.
فتح الحزمة
افتح القفل للوصول البطاقات البالغ عددها 60 في هذه المجموعة.
فتح الحزمة
k this deck
18
In order to decide which measure of central tendency is appropriate, you must first determine
A)the appropriate graph to use and the independent variable.
B)the appropriate graph to use and the dependent variable.
C)how the data will be collected.
D)the scale of measurement being used and the shape of the distribution.
A)the appropriate graph to use and the independent variable.
B)the appropriate graph to use and the dependent variable.
C)how the data will be collected.
D)the scale of measurement being used and the shape of the distribution.
فتح الحزمة
افتح القفل للوصول البطاقات البالغ عددها 60 في هذه المجموعة.
فتح الحزمة
k this deck
19
When a very skewed distribution is involved,
A)use the mode because the most frequently occurring score will be the point around which most scores will be located.
B)use the median because it is more representative of most of the scores.
C)use the mean because it will best represent the extreme scores in the tail.
D)no measure of central tendency should be calculated.
فتح الحزمة
افتح القفل للوصول البطاقات البالغ عددها 60 في هذه المجموعة.
فتح الحزمة
k this deck
20
Error refers to expected errors in predicting unknown scores and is represented by
A)the deviation of the median from the mean.
B)a statistic obtained from a skewed sample.
C)the deviation of a score from the mean.
D)the differences between raw scores in a sample.
A)the deviation of the median from the mean.
B)a statistic obtained from a skewed sample.
C)the deviation of a score from the mean.
D)the differences between raw scores in a sample.
فتح الحزمة
افتح القفل للوصول البطاقات البالغ عددها 60 في هذه المجموعة.
فتح الحزمة
k this deck
21
Find the mean of the following data set.
8, 7, 2, 4, 4, 8, 2, 4, 6, 5, 7, 3, 9, 4, 5, 4, 7
8, 7, 2, 4, 4, 8, 2, 4, 6, 5, 7, 3, 9, 4, 5, 4, 7
فتح الحزمة
افتح القفل للوصول البطاقات البالغ عددها 60 في هذه المجموعة.
فتح الحزمة
k this deck
22
The mean tends to be lower than the median for distributions).
A)negatively skewed
B)positively skewed
C)normal
D)any
A)negatively skewed
B)positively skewed
C)normal
D)any
فتح الحزمة
افتح القفل للوصول البطاقات البالغ عددها 60 في هذه المجموعة.
فتح الحزمة
k this deck
23
Find the median of the following data set.
8, 7, 2, 4, 4, 8, 2, 4, 6, 5, 7, 3, 9, 4, 5, 4, 7
8, 7, 2, 4, 4, 8, 2, 4, 6, 5, 7, 3, 9, 4, 5, 4, 7
فتح الحزمة
افتح القفل للوصول البطاقات البالغ عددها 60 في هذه المجموعة.
فتح الحزمة
k this deck
24
Find the mode of the scores in the following frequency distribution.
فتح الحزمة
افتح القفل للوصول البطاقات البالغ عددها 60 في هذه المجموعة.
فتح الحزمة
k this deck
25
A bimodal distribution will have modes).
A)two
B)two or fewer
C)two or more
D)no
A)two
B)two or fewer
C)two or more
D)no
فتح الحزمة
افتح القفل للوصول البطاقات البالغ عددها 60 في هذه المجموعة.
فتح الحزمة
k this deck
26
Find the mean of the scores in the following frequency distribution.
فتح الحزمة
افتح القفل للوصول البطاقات البالغ عددها 60 في هذه المجموعة.
فتح الحزمة
k this deck
27
The sum of the deviations around the mean.
A)always equals zero.
B)always equals one.
C)typically but not always equals zero.
D)typically but not always equals one.
A)always equals zero.
B)always equals one.
C)typically but not always equals zero.
D)typically but not always equals one.
فتح الحزمة
افتح القفل للوصول البطاقات البالغ عددها 60 في هذه المجموعة.
فتح الحزمة
k this deck
28
For the following order of the measures of centrality, draw the shape that best describes the associated distribution.
فتح الحزمة
افتح القفل للوصول البطاقات البالغ عددها 60 في هذه المجموعة.
فتح الحزمة
k this deck
29
Find the mode of the following data set.
8, 7, 2, 4, 4, 8, 2, 4, 6, 5, 7, 3, 9, 4, 5, 4, 7
8, 7, 2, 4, 4, 8, 2, 4, 6, 5, 7, 3, 9, 4, 5, 4, 7
فتح الحزمة
افتح القفل للوصول البطاقات البالغ عددها 60 في هذه المجموعة.
فتح الحزمة
k this deck
30
When the mean is used to predict scores, a deviation indicates
A)the sample is representative of the population.
B)the difference between the we predict and the score an individual actually gets.
C)the sum of all the deviations.
D)the individual's observed score.
A)the sample is representative of the population.
B)the difference between the we predict and the score an individual actually gets.
C)the sum of all the deviations.
D)the individual's observed score.
فتح الحزمة
افتح القفل للوصول البطاقات البالغ عددها 60 في هذه المجموعة.
فتح الحزمة
k this deck
31
Which of the following distributions are unimodal?
A)4, 4, 4, 4, 5
B)1, 2, 3, 4, 5
C)1, 1, 3, 5, 5
D)1, 1.1, .1, 11, .11
A)4, 4, 4, 4, 5
B)1, 2, 3, 4, 5
C)1, 1, 3, 5, 5
D)1, 1.1, .1, 11, .11
فتح الحزمة
افتح القفل للوصول البطاقات البالغ عددها 60 في هذه المجموعة.
فتح الحزمة
k this deck
32
Find the mode of each of the following two data sets.
Set A: 35, 14, 30, 22, 19, 43, 35, 24, 27, 30, 32, 41, 20, 21, 30, 25, 20, 19, 18, 28
Set B: 35, 14, 30, 22, 19, 43, 35, 24, 27, 30, 32, 41, 209, 21, 30, 25, 20, 19, 18, 28
Does the extreme score 209) impact the mode? Explain.
Set A: 35, 14, 30, 22, 19, 43, 35, 24, 27, 30, 32, 41, 20, 21, 30, 25, 20, 19, 18, 28
Set B: 35, 14, 30, 22, 19, 43, 35, 24, 27, 30, 32, 41, 209, 21, 30, 25, 20, 19, 18, 28
Does the extreme score 209) impact the mode? Explain.
فتح الحزمة
افتح القفل للوصول البطاقات البالغ عددها 60 في هذه المجموعة.
فتح الحزمة
k this deck
33
µ is the symbol for the
A)population median.
B)population mode.
C)population mean.
D)sample mean.
A)population median.
B)population mode.
C)population mean.
D)sample mean.
فتح الحزمة
افتح القفل للوصول البطاقات البالغ عددها 60 في هذه المجموعة.
فتح الحزمة
k this deck
34
What is the mean for the following set of scores: 19, 1, 1, 2, 2?
A)5
B)1
C)2
D)25
A)5
B)1
C)2
D)25
فتح الحزمة
افتح القفل للوصول البطاقات البالغ عددها 60 في هذه المجموعة.
فتح الحزمة
k this deck
35
Suppose you received a 95 on an exam where the mean score was 83.What is your score's deviation?
A)12
B)-12
C)89
D)0
A)12
B)-12
C)89
D)0
فتح الحزمة
افتح القفل للوصول البطاقات البالغ عددها 60 في هذه المجموعة.
فتح الحزمة
k this deck
36
The population mean is estimated by
A)calculating the mean of as many scores as we can get from the population.
B)calculating the mean of a sample drawn from the population.
C)calculating the mean of a sample and then transforming it to reflect the size of the population.
D)calculating all measures of central tendency for a sample drawn from the population.
فتح الحزمة
افتح القفل للوصول البطاقات البالغ عددها 60 في هذه المجموعة.
فتح الحزمة
k this deck
37
Find the mean of the following distribution.
Score f 8 3
7 1
6 0
5 4
4 2
3 3
2 1
1 5
Score f 8 3
7 1
6 0
5 4
4 2
3 3
2 1
1 5
فتح الحزمة
افتح القفل للوصول البطاقات البالغ عددها 60 في هذه المجموعة.
فتح الحزمة
k this deck
38
What shape would you say best describes the following set of scores?
2, 2, 3, 3, 3, 3, 4, 4, 5, 6, 7, 7, 8, 8, 8, 8, 9, 9
2, 2, 3, 3, 3, 3, 4, 4, 5, 6, 7, 7, 8, 8, 8, 8, 9, 9
فتح الحزمة
افتح القفل للوصول البطاقات البالغ عددها 60 في هذه المجموعة.
فتح الحزمة
k this deck
39
In an effort to quit smoking, Pat began eating butterscotch hard candies.For the month of September, Pat's mean was 24 pieces of candy per day.What was the total number of butterscotch candies that Pat consumed in September?
فتح الحزمة
افتح القفل للوصول البطاقات البالغ عددها 60 في هذه المجموعة.
فتح الحزمة
k this deck
40
What is the ΣX for the scores of 5, 1, 5, 2, and 10?
A)23
B)500
C)5
D)4.6
A)23
B)500
C)5
D)4.6
فتح الحزمة
افتح القفل للوصول البطاقات البالغ عددها 60 في هذه المجموعة.
فتح الحزمة
k this deck
41
Does the following graph indicate the existence of a relationship? Explain your answer.
Mean Number of Errors on Driving Test
Mean Number of Errors on Driving Test
فتح الحزمة
افتح القفل للوصول البطاقات البالغ عددها 60 في هذه المجموعة.
فتح الحزمة
k this deck
42
During the past six baseball games he played, Jimmy got 3, 2, 0, 1, 1, and 3 hits.What is his ΣX?
فتح الحزمة
افتح القفل للوصول البطاقات البالغ عددها 60 في هذه المجموعة.
فتح الحزمة
k this deck
43
For the following set of scores, what is are) ?
7, 8, 10, 10, 11, 12, 13, 13, 15
?7, 8, 10, 10, 11, 12, 13, 13, 15
فتح الحزمة
افتح القفل للوصول البطاقات البالغ عددها 60 في هذه المجموعة.
فتح الحزمة
k this deck
44
Five students took a personality test.Their deviation scores were -4, +3, +1, -2, +2.Assuming that these scores form a normal distribution, arrange the deviations so their order represents their ranking in terms of frequency, from highest to lowest?
فتح الحزمة
افتح القفل للوصول البطاقات البالغ عددها 60 في هذه المجموعة.
فتح الحزمة
k this deck
45
Five students took a personality test.Their deviation scores were -4, +3, +1, -2, +2.Assuming that these scores
form a normal distribution, which scores) would have the highest frequency?
form a normal distribution, which scores) would have the highest frequency?
فتح الحزمة
افتح القفل للوصول البطاقات البالغ عددها 60 في هذه المجموعة.
فتح الحزمة
k this deck
46
An experiment has been conducted using three different conditions on the independent variable.For each of the conditions, a sample group mean of 15 was obtained.Assuming each condition results in a normal distribution, how many normal distributions do we envision from this experiment, and what are their population means?
فتح الحزمة
افتح القفل للوصول البطاقات البالغ عددها 60 في هذه المجموعة.
فتح الحزمة
k this deck
47
The equipment failed to record the reaction time for one trial in an experiment.The reaction times in milliseconds) for the other trials were 505, 630, 490, 650, and 560.What is the best estimate for the missing value?
فتح الحزمة
افتح القفل للوصول البطاقات البالغ عددها 60 في هذه المجموعة.
فتح الحزمة
k this deck
48
Five students took a personality test.Their deviation scores were -4, +3, +1, -2, and +2.Assuming that these scores
form a normal distribution, which deviation represents the highest raw score?
form a normal distribution, which deviation represents the highest raw score?
فتح الحزمة
افتح القفل للوصول البطاقات البالغ عددها 60 في هذه المجموعة.
فتح الحزمة
k this deck
49
What is the mode in the following data set?
5 4 4 5 6 8 1 1 8 6
5 4 4 5 6 8 1 1 8 6
فتح الحزمة
افتح القفل للوصول البطاقات البالغ عددها 60 في هذه المجموعة.
فتح الحزمة
k this deck
50
Suppose you did a study with four different experimental conditions.Note what would likely have to present for evidence of a relationship to be present.
فتح الحزمة
افتح القفل للوصول البطاقات البالغ عددها 60 في هذه المجموعة.
فتح الحزمة
k this deck
51
Suppose a given researcher has established that for a particular measure of introversion, μ = 25.You've administered this same measure of introversion to a group of 125 subjects and have found a sample mean of 20.What do these two values tell us in the context of this example), and is it at all concerning that the two values are not identical?
فتح الحزمة
افتح القفل للوصول البطاقات البالغ عددها 60 في هذه المجموعة.
فتح الحزمة
k this deck
52
Find the deviation from the mean for each value in the following distribution.
Score f 8 3
7 1
6 0
5 4
4 2
3 3
2 1
1 5
Score f 8 3
7 1
6 0
5 4
4 2
3 3
2 1
1 5
فتح الحزمة
افتح القفل للوصول البطاقات البالغ عددها 60 في هذه المجموعة.
فتح الحزمة
k this deck
53
Does the following graph indicate the existence of a relationship? Explain your answer.
فتح الحزمة
افتح القفل للوصول البطاقات البالغ عددها 60 في هذه المجموعة.
فتح الحزمة
k this deck
54
If you're interested in knowing the income for a given locality in the United States, what is probably the preferred measure of central tendency and why?
فتح الحزمة
افتح القفل للوصول البطاقات البالغ عددها 60 في هذه المجموعة.
فتح الحزمة
k this deck
55
Based on the following results of an experiment, how many errors would a person who drank 4 oz.of alcohol make?
Mean Number of Errors on Driving Test
Mean Number of Errors on Driving Test
فتح الحزمة
افتح القفل للوصول البطاقات البالغ عددها 60 في هذه المجموعة.
فتح الحزمة
k this deck
56
In general, what does a measure of central tendency inform us about?
فتح الحزمة
افتح القفل للوصول البطاقات البالغ عددها 60 في هذه المجموعة.
فتح الحزمة
k this deck
57
Frank earned an exam score that equaled the class mean.Can we determine his deviation score without actual values? Explain.
فتح الحزمة
افتح القفل للوصول البطاقات البالغ عددها 60 في هذه المجموعة.
فتح الحزمة
k this deck
58
For the following data set, find the mode, median, and the mean.What shape do these measures of centrality suggest for the data?
Score f 88 2
87 4
86 7
85 9
84 15
83 1
Score f 88 2
87 4
86 7
85 9
84 15
83 1
فتح الحزمة
افتح القفل للوصول البطاقات البالغ عددها 60 في هذه المجموعة.
فتح الحزمة
k this deck
59
For the following data set, find the mode, median, and the mean.What shape do these measures of centrality suggest for the data?
Score f 37 2
36 4
35 8
34 3
33 1
32 8
31 3
30 1
Score f 37 2
36 4
35 8
34 3
33 1
32 8
31 3
30 1
فتح الحزمة
افتح القفل للوصول البطاقات البالغ عددها 60 في هذه المجموعة.
فتح الحزمة
k this deck
60
Suppose you are told that your exam score is exactly at the median.What does this tell you about where your score falls in the distribution?
فتح الحزمة
افتح القفل للوصول البطاقات البالغ عددها 60 في هذه المجموعة.
فتح الحزمة
k this deck
فتح الحزمة
افتح القفل للوصول البطاقات البالغ عددها 60 في هذه المجموعة.


