Deck 2: Organizing and Graphing Data
ملء الشاشة (f)
سؤال
Use the following to answer questions :
The following table gives the frequency distribution of the highest degrees held by 25 professionals.

The percentage of persons with a Bachelor's degree as the highest degree is:
The following table gives the frequency distribution of the highest degrees held by 25 professionals.
The percentage of persons with a Bachelor's degree as the highest degree is:
سؤال
سؤال
سؤال
Use the following to answer questions :
The following table gives the frequency distribution of opinions of 50 persons in regard to an issue.

The percentage of persons who are either against this issue or have no opinion is:
The following table gives the frequency distribution of opinions of 50 persons in regard to an issue.
The percentage of persons who are either against this issue or have no opinion is:
سؤال
سؤال
سؤال
سؤال
Use the following to answer questions :
The following table gives the frequency distribution of the highest degrees held by 25 professionals.
The percentage of persons who do not hold a Doctorate is:
The following table gives the frequency distribution of the highest degrees held by 25 professionals.
The percentage of persons who do not hold a Doctorate is:
سؤال
Use the following to answer questions :
The following table gives the frequency distribution of the highest degrees held by 25 professionals.
The percentage of persons who hold a Doctorate is:
The following table gives the frequency distribution of the highest degrees held by 25 professionals.
The percentage of persons who hold a Doctorate is:
سؤال
سؤال
سؤال
سؤال
Use the following to answer questions :
The following table gives the frequency distribution of the highest degrees held by 25 professionals.
The number of persons with a Master's degree as their highest degree is:
The following table gives the frequency distribution of the highest degrees held by 25 professionals.
The number of persons with a Master's degree as their highest degree is:
سؤال
Use the following to answer questions :
The following table gives the frequency distribution of opinions of 50 persons in regard to an issue.
The percentage of persons who are either in favor of this issue or have no opinion is:
The following table gives the frequency distribution of opinions of 50 persons in regard to an issue.
The percentage of persons who are either in favor of this issue or have no opinion is:
سؤال
سؤال
Use the following to answer questions :
The following table gives the frequency distribution of opinions of 50 persons in regard to an issue.
The sample size is:
The following table gives the frequency distribution of opinions of 50 persons in regard to an issue.
The sample size is:
سؤال
سؤال
Use the following to answer questions :
The following table gives the frequency distribution of opinions of 50 persons in regard to an issue.
The percentage of persons who have no opinion is:
The following table gives the frequency distribution of opinions of 50 persons in regard to an issue.
The percentage of persons who have no opinion is:
سؤال
Use the following to answer questions :
The following table gives the frequency distribution of opinions of 50 persons in regard to an issue.
The relative frequency,expressed to two decimal places,of the "Against" category is:
The following table gives the frequency distribution of opinions of 50 persons in regard to an issue.
The relative frequency,expressed to two decimal places,of the "Against" category is:
سؤال
Use the following to answer questions :
The following table gives the frequency distribution of the highest degrees held by 25 professionals.
The number of persons who possess a Doctorate is:
The following table gives the frequency distribution of the highest degrees held by 25 professionals.
The number of persons who possess a Doctorate is:
سؤال
سؤال
Use the following to answer questions :
The following table gives the frequency distribution of test scores for a math class of 30 students.

The number of classes in this frequency table is:
The following table gives the frequency distribution of test scores for a math class of 30 students.
The number of classes in this frequency table is:
سؤال
Use the following to answer questions :
The following table gives the frequency distribution of test scores for a math class of 30 students.
The upper limit of the fourth class is:
The following table gives the frequency distribution of test scores for a math class of 30 students.
The upper limit of the fourth class is:
سؤال
Use the following to answer questions :
The following table gives the frequency distribution of test scores for a math class of 30 students.
The lower boundary of the first class is:
The following table gives the frequency distribution of test scores for a math class of 30 students.
The lower boundary of the first class is:
سؤال
سؤال
سؤال
Use the following to answer questions :
The following table gives the frequency distribution of test scores for a math class of 30 students.
The percentage of students who scored 80 or less on the test,rounded to two decimal places,is:
The following table gives the frequency distribution of test scores for a math class of 30 students.
The percentage of students who scored 80 or less on the test,rounded to two decimal places,is:
سؤال
Use the following to answer questions :
The following table gives the frequency distribution of rents paid per month by 500 families selected from a city.

The width of each class in this frequency table is:
The following table gives the frequency distribution of rents paid per month by 500 families selected from a city.
The width of each class in this frequency table is:
سؤال
Use the following to answer questions :
The following table gives the frequency distribution of test scores for a math class of 30 students.
The midpoint of the fourth class is:
The following table gives the frequency distribution of test scores for a math class of 30 students.
The midpoint of the fourth class is:
سؤال
In a frequency distribution,the correct notation for the sum of the frequencies is:
A)
B)
C)
D)
A)
B)
C)
D)
سؤال
Use the following to answer questions :
The following table gives the frequency distribution of test scores for a math class of 30 students.
The relative frequency of the second class,rounded to three decimal places,is:
The following table gives the frequency distribution of test scores for a math class of 30 students.
The relative frequency of the second class,rounded to three decimal places,is:
سؤال
Use the following to answer questions :
The following table gives the frequency distribution of test scores for a math class of 30 students.
The lower limit of the fourth class is:
The following table gives the frequency distribution of test scores for a math class of 30 students.
The lower limit of the fourth class is:
سؤال
Use the following to answer questions :
The following table gives the frequency distribution of rents paid per month by 500 families selected from a city.
The number of classes in this frequency table is:
The following table gives the frequency distribution of rents paid per month by 500 families selected from a city.
The number of classes in this frequency table is:
سؤال
Use the following to answer questions :
The following table gives the frequency distribution of rents paid per month by 500 families selected from a city.
The midpoint of the second class is:
The following table gives the frequency distribution of rents paid per month by 500 families selected from a city.
The midpoint of the second class is:
سؤال
Use the following to answer questions :
The following table gives the frequency distribution of rents paid per month by 500 families selected from a city.
The lower boundary of the fifth class is:
The following table gives the frequency distribution of rents paid per month by 500 families selected from a city.
The lower boundary of the fifth class is:
سؤال
Use the following to answer questions :
The following table gives the frequency distribution of test scores for a math class of 30 students.
The upper boundary of the third class is:
The following table gives the frequency distribution of test scores for a math class of 30 students.
The upper boundary of the third class is:
سؤال
Use the following to answer questions :
The following table gives the frequency distribution of test scores for a math class of 30 students.
The width of each class in this frequency table is:
The following table gives the frequency distribution of test scores for a math class of 30 students.
The width of each class in this frequency table is:
سؤال
Use the following to answer questions :
The following table gives the frequency distribution of rents paid per month by 500 families selected from a city.
The upper boundary of the fourth class is:
The following table gives the frequency distribution of rents paid per month by 500 families selected from a city.
The upper boundary of the fourth class is:
سؤال
سؤال
Use the following to answer questions :
The following table gives the frequency distribution of test scores for a math class of 30 students.
The sample size is:
The following table gives the frequency distribution of test scores for a math class of 30 students.
The sample size is:
سؤال
Use the following to answer questions :
The following table gives the frequency distribution of rents paid per month by 500 families selected from a city.
The upper limit of the second class is:
The following table gives the frequency distribution of rents paid per month by 500 families selected from a city.
The upper limit of the second class is:
سؤال
Use the following to answer questions :
The following table gives the frequency distribution of rents paid per month by 500 families selected from a city.
The lower limit of the third class is:
The following table gives the frequency distribution of rents paid per month by 500 families selected from a city.
The lower limit of the third class is:
سؤال
Use the following to answer questions :
The following table gives the frequency distribution of the number of rooms for a sample of 100 houses.

The number of houses that contain four or five rooms is:
The following table gives the frequency distribution of the number of rooms for a sample of 100 houses.
The number of houses that contain four or five rooms is:
سؤال
سؤال
Use the following to answer questions :
The following table gives the frequency distribution of the number of telephones owned by a sample of 50 households selected from a city.

The number of households which own more than one telephone is:
The following table gives the frequency distribution of the number of telephones owned by a sample of 50 households selected from a city.
The number of households which own more than one telephone is:
سؤال
Use the following to answer questions :
The following table gives the frequency distribution of the number of rooms for a sample of 100 houses.
The relative frequency of the fourth class,rounded to two decimal places,is:
The following table gives the frequency distribution of the number of rooms for a sample of 100 houses.
The relative frequency of the fourth class,rounded to two decimal places,is:
سؤال
Use the following to answer questions :
The following table gives the frequency distribution of the number of telephones owned by a sample of 50 households selected from a city.
The percentage of households which do not own a telephone is:
The following table gives the frequency distribution of the number of telephones owned by a sample of 50 households selected from a city.
The percentage of households which do not own a telephone is:
سؤال
سؤال
Use the following to answer questions :
The following table gives the frequency distribution of the number of rooms for a sample of 100 houses.
The relative frequency of the fifth class,rounded to two decimal places,is:
The following table gives the frequency distribution of the number of rooms for a sample of 100 houses.
The relative frequency of the fifth class,rounded to two decimal places,is:
سؤال
Use the following to answer questions :
The following table gives the frequency distribution of the number of rooms for a sample of 100 houses.
The number of classes for this frequency distribution table is:
The following table gives the frequency distribution of the number of rooms for a sample of 100 houses.
The number of classes for this frequency distribution table is:
سؤال
Use the following to answer questions :
The following table gives the frequency distribution of rents paid per month by 500 families selected from a city.
The sample size is:
The following table gives the frequency distribution of rents paid per month by 500 families selected from a city.
The sample size is:
سؤال
Use the following to answer questions :
The following table gives the frequency distribution of the number of telephones owned by a sample of 50 households selected from a city.
The percentage of households which own three or more telephones is:
The following table gives the frequency distribution of the number of telephones owned by a sample of 50 households selected from a city.
The percentage of households which own three or more telephones is:
سؤال
Use the following to answer questions :
The following table gives the frequency distribution of the number of telephones owned by a sample of 50 households selected from a city.
The number of classes for this frequency distribution table is::
The following table gives the frequency distribution of the number of telephones owned by a sample of 50 households selected from a city.
The number of classes for this frequency distribution table is::
سؤال
Use the following to answer questions :
The following table gives the frequency distribution of the number of rooms for a sample of 100 houses.
The percentage of houses that have three or fewer rooms is:
The following table gives the frequency distribution of the number of rooms for a sample of 100 houses.
The percentage of houses that have three or fewer rooms is:
سؤال
Use the following to answer questions :
The following table gives the frequency distribution of the number of telephones owned by a sample of 50 households selected from a city.
The number of households which own one or two telephones is:
The following table gives the frequency distribution of the number of telephones owned by a sample of 50 households selected from a city.
The number of households which own one or two telephones is:
سؤال
Use the following to answer questions :
The following table gives the frequency distribution of rents paid per month by 500 families selected from a city.
The percentage of families who paid a rent of $500 or less per month,rounded to one decimal place,is:
The following table gives the frequency distribution of rents paid per month by 500 families selected from a city.
The percentage of families who paid a rent of $500 or less per month,rounded to one decimal place,is:
سؤال
Use the following to answer questions :
The following table gives the frequency distribution of rents paid per month by 500 families selected from a city.
The relative frequency of the sixth class,rounded to three decimal places,is:
The following table gives the frequency distribution of rents paid per month by 500 families selected from a city.
The relative frequency of the sixth class,rounded to three decimal places,is:
سؤال
Use the following to answer questions :
The following table gives the cumulative frequency distribution of annual incomes (in thousands of dollars)for a sample of 200 families selected from a city.

The cumulative relative frequency of the fourth class,rounded to three decimal places,is:
The following table gives the cumulative frequency distribution of annual incomes (in thousands of dollars)for a sample of 200 families selected from a city.
The cumulative relative frequency of the fourth class,rounded to three decimal places,is:
سؤال
Use the following to answer questions :
The following table gives the frequency distribution of the number of telephones owned by a sample of 50 households selected from a city.
The relative frequency of the second class,rounded to two decimal places,is:
The following table gives the frequency distribution of the number of telephones owned by a sample of 50 households selected from a city.
The relative frequency of the second class,rounded to two decimal places,is:
سؤال
Use the following to answer questions :
The following table gives the frequency distribution of the number of rooms for a sample of 100 houses.
The percentage of houses that contain five or more rooms is:
The following table gives the frequency distribution of the number of rooms for a sample of 100 houses.
The percentage of houses that contain five or more rooms is:
سؤال
Use the following to answer questions :
The following table gives the cumulative frequency distribution of annual incomes (in thousands of dollars)for a sample of 200 families selected from a city.
The number of families with an income of $85,000 or more is:
The following table gives the cumulative frequency distribution of annual incomes (in thousands of dollars)for a sample of 200 families selected from a city.
The number of families with an income of $85,000 or more is:
سؤال
Use the following to answer questions :
The following table gives the cumulative frequency distribution of the commuting time (in minutes)from home to work for a sample of 400 persons selected from a city.

The percentage of persons who commute for less than 50 minutes,rounded to two decimal places,is:
The following table gives the cumulative frequency distribution of the commuting time (in minutes)from home to work for a sample of 400 persons selected from a city.
The percentage of persons who commute for less than 50 minutes,rounded to two decimal places,is:
سؤال
Use the following to answer questions :
The following table gives the cumulative frequency distribution of annual incomes (in thousands of dollars)for a sample of 200 families selected from a city.
The sample size is:
The following table gives the cumulative frequency distribution of annual incomes (in thousands of dollars)for a sample of 200 families selected from a city.
The sample size is:
سؤال
Use the following to answer questions :
The following table gives the cumulative frequency distribution of annual incomes (in thousands of dollars)for a sample of 200 families selected from a city.
The number of families with an income of $40,000 or less is:
The following table gives the cumulative frequency distribution of annual incomes (in thousands of dollars)for a sample of 200 families selected from a city.
The number of families with an income of $40,000 or less is:
سؤال
Use the following to answer questions :
The following table gives the cumulative frequency distribution of the commuting time (in minutes)from home to work for a sample of 400 persons selected from a city.
Fifteen programmers were asked what computer language was used in their first programming class.The raw data appears below:
 The percentage of people,rounded to two decimal places,who did not answer "Fortran" is:
The following table gives the cumulative frequency distribution of the commuting time (in minutes)from home to work for a sample of 400 persons selected from a city.
Fifteen programmers were asked what computer language was used in their first programming class.The raw data appears below:
The percentage of people,rounded to two decimal places,who did not answer "Fortran" is: سؤال
Use the following to answer questions :
The following table gives the cumulative frequency distribution of the commuting time (in minutes)from home to work for a sample of 400 persons selected from a city.
For the observation 4,the stem is:
The following table gives the cumulative frequency distribution of the commuting time (in minutes)from home to work for a sample of 400 persons selected from a city.
For the observation 4,the stem is:
سؤال
Use the following to answer questions :
A highway patrolman records the following speeds (in mph)for 25 cars that pass through his radar within a five-minute interval.Here is the histogram of that data: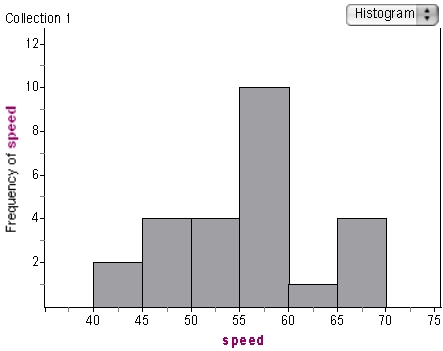
How many observations fall in the fourth interval?
A highway patrolman records the following speeds (in mph)for 25 cars that pass through his radar within a five-minute interval.Here is the histogram of that data:
How many observations fall in the fourth interval?
سؤال
Use the following to answer questions :
The following table gives the cumulative frequency distribution of annual incomes (in thousands of dollars)for a sample of 200 families selected from a city.
The percentage of families with an income of less than $55,000,rounded to one decimal place,is:
The following table gives the cumulative frequency distribution of annual incomes (in thousands of dollars)for a sample of 200 families selected from a city.
The percentage of families with an income of less than $55,000,rounded to one decimal place,is:
سؤال
Use the following to answer questions :
The following table gives the cumulative frequency distribution of the commuting time (in minutes)from home to work for a sample of 400 persons selected from a city.
For the observation 34,the leaf is:
The following table gives the cumulative frequency distribution of the commuting time (in minutes)from home to work for a sample of 400 persons selected from a city.
For the observation 34,the leaf is:
سؤال
Use the following to answer questions :
The following table gives the cumulative frequency distribution of annual incomes (in thousands of dollars)for a sample of 200 families selected from a city.
The cumulative percentage for the second class,rounded to one decimal place,is:
The following table gives the cumulative frequency distribution of annual incomes (in thousands of dollars)for a sample of 200 families selected from a city.
The cumulative percentage for the second class,rounded to one decimal place,is:
سؤال
Use the following to answer questions :
The following table gives the cumulative frequency distribution of annual incomes (in thousands of dollars)for a sample of 200 families selected from a city.
The percentage of families with an income of $70,000 or more,rounded to one decimal place,is:
The following table gives the cumulative frequency distribution of annual incomes (in thousands of dollars)for a sample of 200 families selected from a city.
The percentage of families with an income of $70,000 or more,rounded to one decimal place,is:
سؤال
Use the following to answer questions :
The following table gives the cumulative frequency distribution of the commuting time (in minutes)from home to work for a sample of 400 persons selected from a city.
You ask 27 people what kind of pet they own.Seven people have dogs,five have cats,three have birds,and the remainder have no pets.The relative frequency of dog owners,rounded to three decimal places,is:
سؤال
Use the following to answer questions :
The following table gives the cumulative frequency distribution of the commuting time (in minutes)from home to work for a sample of 400 persons selected from a city.
In a game of four-handed Hearts,all 52 cards of a standard deck are dealt,so that each player starts each round with 13 cards in a hand.Suppose player A's hand has three clubs,six diamonds,two hearts,and two spades.What is the relative frequency of spades,rounded to two decimal places,dealt to player A?
سؤال
Use the following to answer questions :
The following table gives the cumulative frequency distribution of the commuting time (in minutes)from home to work for a sample of 400 persons selected from a city.
The number of persons who commute for 20 or more minutes is:
The following table gives the cumulative frequency distribution of the commuting time (in minutes)from home to work for a sample of 400 persons selected from a city.
The number of persons who commute for 20 or more minutes is:
سؤال
Use the following to answer questions :
The following table gives the cumulative frequency distribution of the commuting time (in minutes)from home to work for a sample of 400 persons selected from a city.
The cumulative relative frequency of the fourth class,rounded to four decimal places,is:
The following table gives the cumulative frequency distribution of the commuting time (in minutes)from home to work for a sample of 400 persons selected from a city.
The cumulative relative frequency of the fourth class,rounded to four decimal places,is:
سؤال
Use the following to answer questions :
The following table gives the cumulative frequency distribution of the commuting time (in minutes)from home to work for a sample of 400 persons selected from a city.
The percentage of persons who commute for less than 30 minutes,rounded to two decimal places,is:
The following table gives the cumulative frequency distribution of the commuting time (in minutes)from home to work for a sample of 400 persons selected from a city.
The percentage of persons who commute for less than 30 minutes,rounded to two decimal places,is:
سؤال
Use the following to answer questions :
The following table gives the cumulative frequency distribution of the commuting time (in minutes)from home to work for a sample of 400 persons selected from a city.
The percentage of persons who commute for 40 or more minutes,rounded to two decimal places,is:
The following table gives the cumulative frequency distribution of the commuting time (in minutes)from home to work for a sample of 400 persons selected from a city.
The percentage of persons who commute for 40 or more minutes,rounded to two decimal places,is:
سؤال
Use the following to answer questions :
A highway patrolman records the following speeds (in mph)for 25 cars that pass through his radar within a five-minute interval.Here is the histogram of that data:
The relative frequency of drivers whose speed is less than 55 mph,rounded to two decimal places,is?
A highway patrolman records the following speeds (in mph)for 25 cars that pass through his radar within a five-minute interval.Here is the histogram of that data:
The relative frequency of drivers whose speed is less than 55 mph,rounded to two decimal places,is?
سؤال
Use the following to answer questions :
A highway patrolman records the following speeds (in mph)for 25 cars that pass through his radar within a five-minute interval.Here is the histogram of that data:
What is the width of each class?
A highway patrolman records the following speeds (in mph)for 25 cars that pass through his radar within a five-minute interval.Here is the histogram of that data:
What is the width of each class?
سؤال
Use the following to answer questions :
The following table gives the cumulative frequency distribution of the commuting time (in minutes)from home to work for a sample of 400 persons selected from a city.
The sample size is:
The following table gives the cumulative frequency distribution of the commuting time (in minutes)from home to work for a sample of 400 persons selected from a city.
The sample size is:

فتح الحزمة
قم بالتسجيل لفتح البطاقات في هذه المجموعة!
Unlock Deck
Unlock Deck
1/93
العب
ملء الشاشة (f)
Deck 2: Organizing and Graphing Data
1
Use the following to answer questions :
The following table gives the frequency distribution of the highest degrees held by 25 professionals.
The percentage of persons with a Bachelor's degree as the highest degree is:
The following table gives the frequency distribution of the highest degrees held by 25 professionals.
The percentage of persons with a Bachelor's degree as the highest degree is:
48%
2
In a frequency distribution,the classes should always:
A)be overlapping
B)have the same frequency
C)have a width of 10
D)be non-overlapping
A)be overlapping
B)have the same frequency
C)have a width of 10
D)be non-overlapping
be non-overlapping
3
The procedure for obtaining the relative frequency of a class is to:
A)divide the frequency of that class by the sum of all frequencies
B)multiply the frequency of that class by 100
C)divide the frequency of that class by 100
D)divide the sum of all frequencies by the frequency of that class
A)divide the frequency of that class by the sum of all frequencies
B)multiply the frequency of that class by 100
C)divide the frequency of that class by 100
D)divide the sum of all frequencies by the frequency of that class
divide the frequency of that class by the sum of all frequencies
4
Use the following to answer questions :
The following table gives the frequency distribution of opinions of 50 persons in regard to an issue.
The percentage of persons who are either against this issue or have no opinion is:
The following table gives the frequency distribution of opinions of 50 persons in regard to an issue.
The percentage of persons who are either against this issue or have no opinion is:
فتح الحزمة
افتح القفل للوصول البطاقات البالغ عددها 93 في هذه المجموعة.
فتح الحزمة
k this deck
5
When preparing a frequency distribution,the lower limit of the first class should always be:
A)a number that is greater than the smallest value in the data set
B)equal to 10
C)a number that is less than or equal to the smallest value in the data set
D)equal to zero
A)a number that is greater than the smallest value in the data set
B)equal to 10
C)a number that is less than or equal to the smallest value in the data set
D)equal to zero
فتح الحزمة
افتح القفل للوصول البطاقات البالغ عددها 93 في هذه المجموعة.
فتح الحزمة
k this deck
6
A symmetric distribution curve:
A)has a longer tail on the right side
B)has a longer tail on the left side
C)is identical on both sides of the mean
D)is triangular in shape
A)has a longer tail on the right side
B)has a longer tail on the left side
C)is identical on both sides of the mean
D)is triangular in shape
فتح الحزمة
افتح القفل للوصول البطاقات البالغ عددها 93 في هذه المجموعة.
فتح الحزمة
k this deck
7
The number of classes in a frequency distribution depends on the size of the data set.In general,the:
A)larger the data set,the larger the number of classes
B)larger the data set,the smaller the number of classes
C)number of classes should be equal to the number of values in the data set divided by 5
D)smaller the data set,the larger the number of classes
A)larger the data set,the larger the number of classes
B)larger the data set,the smaller the number of classes
C)number of classes should be equal to the number of values in the data set divided by 5
D)smaller the data set,the larger the number of classes
فتح الحزمة
افتح القفل للوصول البطاقات البالغ عددها 93 في هذه المجموعة.
فتح الحزمة
k this deck
8
Use the following to answer questions :
The following table gives the frequency distribution of the highest degrees held by 25 professionals.
The percentage of persons who do not hold a Doctorate is:
The following table gives the frequency distribution of the highest degrees held by 25 professionals.
The percentage of persons who do not hold a Doctorate is:
فتح الحزمة
افتح القفل للوصول البطاقات البالغ عددها 93 في هذه المجموعة.
فتح الحزمة
k this deck
9
Use the following to answer questions :
The following table gives the frequency distribution of the highest degrees held by 25 professionals.
The percentage of persons who hold a Doctorate is:
The following table gives the frequency distribution of the highest degrees held by 25 professionals.
The percentage of persons who hold a Doctorate is:
فتح الحزمة
افتح القفل للوصول البطاقات البالغ عددها 93 في هذه المجموعة.
فتح الحزمة
k this deck
10
We obtain the percentage of a category by:
A)multiplying the frequency of that category by 100
B)multiplying the relative frequency of that category by 100
C)dividing the frequency of that category by 100
D)dividing the sum of all frequencies by the frequency of that category
A)multiplying the frequency of that category by 100
B)multiplying the relative frequency of that category by 100
C)dividing the frequency of that category by 100
D)dividing the sum of all frequencies by the frequency of that category
فتح الحزمة
افتح القفل للوصول البطاقات البالغ عددها 93 في هذه المجموعة.
فتح الحزمة
k this deck
11
A distribution curve that is right-skewed has:
A)both tails of the same length
B)a longer tail on the left side
C)a shorter tail on the right side
D)a longer tail on the right side
A)both tails of the same length
B)a longer tail on the left side
C)a shorter tail on the right side
D)a longer tail on the right side
فتح الحزمة
افتح القفل للوصول البطاقات البالغ عددها 93 في هذه المجموعة.
فتح الحزمة
k this deck
12
Raw data are the data that:
A)are presented in the form of a frequency table
B)give information on each individual sample member separately
C)are arranged in increasing order
D)are arranged in a random order
A)are presented in the form of a frequency table
B)give information on each individual sample member separately
C)are arranged in increasing order
D)are arranged in a random order
فتح الحزمة
افتح القفل للوصول البطاقات البالغ عددها 93 في هذه المجموعة.
فتح الحزمة
k this deck
13
Use the following to answer questions :
The following table gives the frequency distribution of the highest degrees held by 25 professionals.
The number of persons with a Master's degree as their highest degree is:
The following table gives the frequency distribution of the highest degrees held by 25 professionals.
The number of persons with a Master's degree as their highest degree is:
فتح الحزمة
افتح القفل للوصول البطاقات البالغ عددها 93 في هذه المجموعة.
فتح الحزمة
k this deck
14
Use the following to answer questions :
The following table gives the frequency distribution of opinions of 50 persons in regard to an issue.
The percentage of persons who are either in favor of this issue or have no opinion is:
The following table gives the frequency distribution of opinions of 50 persons in regard to an issue.
The percentage of persons who are either in favor of this issue or have no opinion is:
فتح الحزمة
افتح القفل للوصول البطاقات البالغ عددها 93 في هذه المجموعة.
فتح الحزمة
k this deck
15
The procedure for obtaining the midpoint of a class is to:
A)add the lower limit to the upper limit of the previous class
B)subtract the lower limit from the upper limit
C)multiply the sum of the two class limits by 2
D)divide the sum of the two class limits by 2
A)add the lower limit to the upper limit of the previous class
B)subtract the lower limit from the upper limit
C)multiply the sum of the two class limits by 2
D)divide the sum of the two class limits by 2
فتح الحزمة
افتح القفل للوصول البطاقات البالغ عددها 93 في هذه المجموعة.
فتح الحزمة
k this deck
16
Use the following to answer questions :
The following table gives the frequency distribution of opinions of 50 persons in regard to an issue.
The sample size is:
The following table gives the frequency distribution of opinions of 50 persons in regard to an issue.
The sample size is:
فتح الحزمة
افتح القفل للوصول البطاقات البالغ عددها 93 في هذه المجموعة.
فتح الحزمة
k this deck
17
We obtain the relative frequency of a category by:
A)dividing the frequency of that category by the sum of all frequencies
B)multiplying the frequency of that category by 100
C)dividing the frequency of that category by 100
D)dividing the sum of all frequencies by the frequency of that category
A)dividing the frequency of that category by the sum of all frequencies
B)multiplying the frequency of that category by 100
C)dividing the frequency of that category by 100
D)dividing the sum of all frequencies by the frequency of that category
فتح الحزمة
افتح القفل للوصول البطاقات البالغ عددها 93 في هذه المجموعة.
فتح الحزمة
k this deck
18
Use the following to answer questions :
The following table gives the frequency distribution of opinions of 50 persons in regard to an issue.
The percentage of persons who have no opinion is:
The following table gives the frequency distribution of opinions of 50 persons in regard to an issue.
The percentage of persons who have no opinion is:
فتح الحزمة
افتح القفل للوصول البطاقات البالغ عددها 93 في هذه المجموعة.
فتح الحزمة
k this deck
19
Use the following to answer questions :
The following table gives the frequency distribution of opinions of 50 persons in regard to an issue.
The relative frequency,expressed to two decimal places,of the "Against" category is:
The following table gives the frequency distribution of opinions of 50 persons in regard to an issue.
The relative frequency,expressed to two decimal places,of the "Against" category is:
فتح الحزمة
افتح القفل للوصول البطاقات البالغ عددها 93 في هذه المجموعة.
فتح الحزمة
k this deck
20
Use the following to answer questions :
The following table gives the frequency distribution of the highest degrees held by 25 professionals.
The number of persons who possess a Doctorate is:
The following table gives the frequency distribution of the highest degrees held by 25 professionals.
The number of persons who possess a Doctorate is:
فتح الحزمة
افتح القفل للوصول البطاقات البالغ عددها 93 في هذه المجموعة.
فتح الحزمة
k this deck
21
The procedure for obtaining the percentage for a class is to:
A)multiply the frequency of that class by 100
B)multiply the relative frequency of that class by 100
C)divide the relative frequency of that class by 100
D)divide the sum of all frequencies by 100
A)multiply the frequency of that class by 100
B)multiply the relative frequency of that class by 100
C)divide the relative frequency of that class by 100
D)divide the sum of all frequencies by 100
فتح الحزمة
افتح القفل للوصول البطاقات البالغ عددها 93 في هذه المجموعة.
فتح الحزمة
k this deck
22
Use the following to answer questions :
The following table gives the frequency distribution of test scores for a math class of 30 students.
The number of classes in this frequency table is:
The following table gives the frequency distribution of test scores for a math class of 30 students.
The number of classes in this frequency table is:
فتح الحزمة
افتح القفل للوصول البطاقات البالغ عددها 93 في هذه المجموعة.
فتح الحزمة
k this deck
23
Use the following to answer questions :
The following table gives the frequency distribution of test scores for a math class of 30 students.
The upper limit of the fourth class is:
The following table gives the frequency distribution of test scores for a math class of 30 students.
The upper limit of the fourth class is:
فتح الحزمة
افتح القفل للوصول البطاقات البالغ عددها 93 في هذه المجموعة.
فتح الحزمة
k this deck
24
Use the following to answer questions :
The following table gives the frequency distribution of test scores for a math class of 30 students.
The lower boundary of the first class is:
The following table gives the frequency distribution of test scores for a math class of 30 students.
The lower boundary of the first class is:
فتح الحزمة
افتح القفل للوصول البطاقات البالغ عددها 93 في هذه المجموعة.
فتح الحزمة
k this deck
25
A rectangular histogram has:
A)a longer tail on the right side
B)a longer tail on the left side
C)shorter tails on both sides
D)the same frequency for each class
A)a longer tail on the right side
B)a longer tail on the left side
C)shorter tails on both sides
D)the same frequency for each class
فتح الحزمة
افتح القفل للوصول البطاقات البالغ عددها 93 في هذه المجموعة.
فتح الحزمة
k this deck
26
In a frequency histogram,the frequency of a class is the:
A)height of the corresponding bar
B)width of the corresponding bar
C)height multiplied by the width of the corresponding bar
D)height divided by the width of the corresponding bar
A)height of the corresponding bar
B)width of the corresponding bar
C)height multiplied by the width of the corresponding bar
D)height divided by the width of the corresponding bar
فتح الحزمة
افتح القفل للوصول البطاقات البالغ عددها 93 في هذه المجموعة.
فتح الحزمة
k this deck
27
Use the following to answer questions :
The following table gives the frequency distribution of test scores for a math class of 30 students.
The percentage of students who scored 80 or less on the test,rounded to two decimal places,is:
The following table gives the frequency distribution of test scores for a math class of 30 students.
The percentage of students who scored 80 or less on the test,rounded to two decimal places,is:
فتح الحزمة
افتح القفل للوصول البطاقات البالغ عددها 93 في هذه المجموعة.
فتح الحزمة
k this deck
28
Use the following to answer questions :
The following table gives the frequency distribution of rents paid per month by 500 families selected from a city.
The width of each class in this frequency table is:
The following table gives the frequency distribution of rents paid per month by 500 families selected from a city.
The width of each class in this frequency table is:
فتح الحزمة
افتح القفل للوصول البطاقات البالغ عددها 93 في هذه المجموعة.
فتح الحزمة
k this deck
29
Use the following to answer questions :
The following table gives the frequency distribution of test scores for a math class of 30 students.
The midpoint of the fourth class is:
The following table gives the frequency distribution of test scores for a math class of 30 students.
The midpoint of the fourth class is:
فتح الحزمة
افتح القفل للوصول البطاقات البالغ عددها 93 في هذه المجموعة.
فتح الحزمة
k this deck
30
In a frequency distribution,the correct notation for the sum of the frequencies is:
A)
B)
C)
D)
A)
B)
C)
D)
فتح الحزمة
افتح القفل للوصول البطاقات البالغ عددها 93 في هذه المجموعة.
فتح الحزمة
k this deck
31
Use the following to answer questions :
The following table gives the frequency distribution of test scores for a math class of 30 students.
The relative frequency of the second class,rounded to three decimal places,is:
The following table gives the frequency distribution of test scores for a math class of 30 students.
The relative frequency of the second class,rounded to three decimal places,is:
فتح الحزمة
افتح القفل للوصول البطاقات البالغ عددها 93 في هذه المجموعة.
فتح الحزمة
k this deck
32
Use the following to answer questions :
The following table gives the frequency distribution of test scores for a math class of 30 students.
The lower limit of the fourth class is:
The following table gives the frequency distribution of test scores for a math class of 30 students.
The lower limit of the fourth class is:
فتح الحزمة
افتح القفل للوصول البطاقات البالغ عددها 93 في هذه المجموعة.
فتح الحزمة
k this deck
33
Use the following to answer questions :
The following table gives the frequency distribution of rents paid per month by 500 families selected from a city.
The number of classes in this frequency table is:
The following table gives the frequency distribution of rents paid per month by 500 families selected from a city.
The number of classes in this frequency table is:
فتح الحزمة
افتح القفل للوصول البطاقات البالغ عددها 93 في هذه المجموعة.
فتح الحزمة
k this deck
34
Use the following to answer questions :
The following table gives the frequency distribution of rents paid per month by 500 families selected from a city.
The midpoint of the second class is:
The following table gives the frequency distribution of rents paid per month by 500 families selected from a city.
The midpoint of the second class is:
فتح الحزمة
افتح القفل للوصول البطاقات البالغ عددها 93 في هذه المجموعة.
فتح الحزمة
k this deck
35
Use the following to answer questions :
The following table gives the frequency distribution of rents paid per month by 500 families selected from a city.
The lower boundary of the fifth class is:
The following table gives the frequency distribution of rents paid per month by 500 families selected from a city.
The lower boundary of the fifth class is:
فتح الحزمة
افتح القفل للوصول البطاقات البالغ عددها 93 في هذه المجموعة.
فتح الحزمة
k this deck
36
Use the following to answer questions :
The following table gives the frequency distribution of test scores for a math class of 30 students.
The upper boundary of the third class is:
The following table gives the frequency distribution of test scores for a math class of 30 students.
The upper boundary of the third class is:
فتح الحزمة
افتح القفل للوصول البطاقات البالغ عددها 93 في هذه المجموعة.
فتح الحزمة
k this deck
37
Use the following to answer questions :
The following table gives the frequency distribution of test scores for a math class of 30 students.
The width of each class in this frequency table is:
The following table gives the frequency distribution of test scores for a math class of 30 students.
The width of each class in this frequency table is:
فتح الحزمة
افتح القفل للوصول البطاقات البالغ عددها 93 في هذه المجموعة.
فتح الحزمة
k this deck
38
Use the following to answer questions :
The following table gives the frequency distribution of rents paid per month by 500 families selected from a city.
The upper boundary of the fourth class is:
The following table gives the frequency distribution of rents paid per month by 500 families selected from a city.
The upper boundary of the fourth class is:
فتح الحزمة
افتح القفل للوصول البطاقات البالغ عددها 93 في هذه المجموعة.
فتح الحزمة
k this deck
39
We can construct a frequency histogram for:
A)qualitative data only
B)any kind of data
C)qualitative and quantitative data
D)continuous data
A)qualitative data only
B)any kind of data
C)qualitative and quantitative data
D)continuous data
فتح الحزمة
افتح القفل للوصول البطاقات البالغ عددها 93 في هذه المجموعة.
فتح الحزمة
k this deck
40
Use the following to answer questions :
The following table gives the frequency distribution of test scores for a math class of 30 students.
The sample size is:
The following table gives the frequency distribution of test scores for a math class of 30 students.
The sample size is:
فتح الحزمة
افتح القفل للوصول البطاقات البالغ عددها 93 في هذه المجموعة.
فتح الحزمة
k this deck
41
Use the following to answer questions :
The following table gives the frequency distribution of rents paid per month by 500 families selected from a city.
The upper limit of the second class is:
The following table gives the frequency distribution of rents paid per month by 500 families selected from a city.
The upper limit of the second class is:
فتح الحزمة
افتح القفل للوصول البطاقات البالغ عددها 93 في هذه المجموعة.
فتح الحزمة
k this deck
42
Use the following to answer questions :
The following table gives the frequency distribution of rents paid per month by 500 families selected from a city.
The lower limit of the third class is:
The following table gives the frequency distribution of rents paid per month by 500 families selected from a city.
The lower limit of the third class is:
فتح الحزمة
افتح القفل للوصول البطاقات البالغ عددها 93 في هذه المجموعة.
فتح الحزمة
k this deck
43
Use the following to answer questions :
The following table gives the frequency distribution of the number of rooms for a sample of 100 houses.
The number of houses that contain four or five rooms is:
The following table gives the frequency distribution of the number of rooms for a sample of 100 houses.
The number of houses that contain four or five rooms is:
فتح الحزمة
افتح القفل للوصول البطاقات البالغ عددها 93 في هذه المجموعة.
فتح الحزمة
k this deck
44
We construct an ogive to graph a:
A)frequency distribution
B)cumulative frequency distribution
C)relative frequency distribution
D)stem-and-leaf display
A)frequency distribution
B)cumulative frequency distribution
C)relative frequency distribution
D)stem-and-leaf display
فتح الحزمة
افتح القفل للوصول البطاقات البالغ عددها 93 في هذه المجموعة.
فتح الحزمة
k this deck
45
Use the following to answer questions :
The following table gives the frequency distribution of the number of telephones owned by a sample of 50 households selected from a city.
The number of households which own more than one telephone is:
The following table gives the frequency distribution of the number of telephones owned by a sample of 50 households selected from a city.
The number of households which own more than one telephone is:
فتح الحزمة
افتح القفل للوصول البطاقات البالغ عددها 93 في هذه المجموعة.
فتح الحزمة
k this deck
46
Use the following to answer questions :
The following table gives the frequency distribution of the number of rooms for a sample of 100 houses.
The relative frequency of the fourth class,rounded to two decimal places,is:
The following table gives the frequency distribution of the number of rooms for a sample of 100 houses.
The relative frequency of the fourth class,rounded to two decimal places,is:
فتح الحزمة
افتح القفل للوصول البطاقات البالغ عددها 93 في هذه المجموعة.
فتح الحزمة
k this deck
47
Use the following to answer questions :
The following table gives the frequency distribution of the number of telephones owned by a sample of 50 households selected from a city.
The percentage of households which do not own a telephone is:
The following table gives the frequency distribution of the number of telephones owned by a sample of 50 households selected from a city.
The percentage of households which do not own a telephone is:
فتح الحزمة
افتح القفل للوصول البطاقات البالغ عددها 93 في هذه المجموعة.
فتح الحزمة
k this deck
48
The graph of a cumulative frequency distribution is a(n):
A)frequency histogram
B)stem-and-leaf display
C)line graph
D)ogive
A)frequency histogram
B)stem-and-leaf display
C)line graph
D)ogive
فتح الحزمة
افتح القفل للوصول البطاقات البالغ عددها 93 في هذه المجموعة.
فتح الحزمة
k this deck
49
Use the following to answer questions :
The following table gives the frequency distribution of the number of rooms for a sample of 100 houses.
The relative frequency of the fifth class,rounded to two decimal places,is:
The following table gives the frequency distribution of the number of rooms for a sample of 100 houses.
The relative frequency of the fifth class,rounded to two decimal places,is:
فتح الحزمة
افتح القفل للوصول البطاقات البالغ عددها 93 في هذه المجموعة.
فتح الحزمة
k this deck
50
Use the following to answer questions :
The following table gives the frequency distribution of the number of rooms for a sample of 100 houses.
The number of classes for this frequency distribution table is:
The following table gives the frequency distribution of the number of rooms for a sample of 100 houses.
The number of classes for this frequency distribution table is:
فتح الحزمة
افتح القفل للوصول البطاقات البالغ عددها 93 في هذه المجموعة.
فتح الحزمة
k this deck
51
Use the following to answer questions :
The following table gives the frequency distribution of rents paid per month by 500 families selected from a city.
The sample size is:
The following table gives the frequency distribution of rents paid per month by 500 families selected from a city.
The sample size is:
فتح الحزمة
افتح القفل للوصول البطاقات البالغ عددها 93 في هذه المجموعة.
فتح الحزمة
k this deck
52
Use the following to answer questions :
The following table gives the frequency distribution of the number of telephones owned by a sample of 50 households selected from a city.
The percentage of households which own three or more telephones is:
The following table gives the frequency distribution of the number of telephones owned by a sample of 50 households selected from a city.
The percentage of households which own three or more telephones is:
فتح الحزمة
افتح القفل للوصول البطاقات البالغ عددها 93 في هذه المجموعة.
فتح الحزمة
k this deck
53
Use the following to answer questions :
The following table gives the frequency distribution of the number of telephones owned by a sample of 50 households selected from a city.
The number of classes for this frequency distribution table is::
The following table gives the frequency distribution of the number of telephones owned by a sample of 50 households selected from a city.
The number of classes for this frequency distribution table is::
فتح الحزمة
افتح القفل للوصول البطاقات البالغ عددها 93 في هذه المجموعة.
فتح الحزمة
k this deck
54
Use the following to answer questions :
The following table gives the frequency distribution of the number of rooms for a sample of 100 houses.
The percentage of houses that have three or fewer rooms is:
The following table gives the frequency distribution of the number of rooms for a sample of 100 houses.
The percentage of houses that have three or fewer rooms is:
فتح الحزمة
افتح القفل للوصول البطاقات البالغ عددها 93 في هذه المجموعة.
فتح الحزمة
k this deck
55
Use the following to answer questions :
The following table gives the frequency distribution of the number of telephones owned by a sample of 50 households selected from a city.
The number of households which own one or two telephones is:
The following table gives the frequency distribution of the number of telephones owned by a sample of 50 households selected from a city.
The number of households which own one or two telephones is:
فتح الحزمة
افتح القفل للوصول البطاقات البالغ عددها 93 في هذه المجموعة.
فتح الحزمة
k this deck
56
Use the following to answer questions :
The following table gives the frequency distribution of rents paid per month by 500 families selected from a city.
The percentage of families who paid a rent of $500 or less per month,rounded to one decimal place,is:
The following table gives the frequency distribution of rents paid per month by 500 families selected from a city.
The percentage of families who paid a rent of $500 or less per month,rounded to one decimal place,is:
فتح الحزمة
افتح القفل للوصول البطاقات البالغ عددها 93 في هذه المجموعة.
فتح الحزمة
k this deck
57
Use the following to answer questions :
The following table gives the frequency distribution of rents paid per month by 500 families selected from a city.
The relative frequency of the sixth class,rounded to three decimal places,is:
The following table gives the frequency distribution of rents paid per month by 500 families selected from a city.
The relative frequency of the sixth class,rounded to three decimal places,is:
فتح الحزمة
افتح القفل للوصول البطاقات البالغ عددها 93 في هذه المجموعة.
فتح الحزمة
k this deck
58
Use the following to answer questions :
The following table gives the cumulative frequency distribution of annual incomes (in thousands of dollars)for a sample of 200 families selected from a city.
The cumulative relative frequency of the fourth class,rounded to three decimal places,is:
The following table gives the cumulative frequency distribution of annual incomes (in thousands of dollars)for a sample of 200 families selected from a city.
The cumulative relative frequency of the fourth class,rounded to three decimal places,is:
فتح الحزمة
افتح القفل للوصول البطاقات البالغ عددها 93 في هذه المجموعة.
فتح الحزمة
k this deck
59
Use the following to answer questions :
The following table gives the frequency distribution of the number of telephones owned by a sample of 50 households selected from a city.
The relative frequency of the second class,rounded to two decimal places,is:
The following table gives the frequency distribution of the number of telephones owned by a sample of 50 households selected from a city.
The relative frequency of the second class,rounded to two decimal places,is:
فتح الحزمة
افتح القفل للوصول البطاقات البالغ عددها 93 في هذه المجموعة.
فتح الحزمة
k this deck
60
Use the following to answer questions :
The following table gives the frequency distribution of the number of rooms for a sample of 100 houses.
The percentage of houses that contain five or more rooms is:
The following table gives the frequency distribution of the number of rooms for a sample of 100 houses.
The percentage of houses that contain five or more rooms is:
فتح الحزمة
افتح القفل للوصول البطاقات البالغ عددها 93 في هذه المجموعة.
فتح الحزمة
k this deck
61
Use the following to answer questions :
The following table gives the cumulative frequency distribution of annual incomes (in thousands of dollars)for a sample of 200 families selected from a city.
The number of families with an income of $85,000 or more is:
The following table gives the cumulative frequency distribution of annual incomes (in thousands of dollars)for a sample of 200 families selected from a city.
The number of families with an income of $85,000 or more is:
فتح الحزمة
افتح القفل للوصول البطاقات البالغ عددها 93 في هذه المجموعة.
فتح الحزمة
k this deck
62
Use the following to answer questions :
The following table gives the cumulative frequency distribution of the commuting time (in minutes)from home to work for a sample of 400 persons selected from a city.
The percentage of persons who commute for less than 50 minutes,rounded to two decimal places,is:
The following table gives the cumulative frequency distribution of the commuting time (in minutes)from home to work for a sample of 400 persons selected from a city.
The percentage of persons who commute for less than 50 minutes,rounded to two decimal places,is:
فتح الحزمة
افتح القفل للوصول البطاقات البالغ عددها 93 في هذه المجموعة.
فتح الحزمة
k this deck
63
Use the following to answer questions :
The following table gives the cumulative frequency distribution of annual incomes (in thousands of dollars)for a sample of 200 families selected from a city.
The sample size is:
The following table gives the cumulative frequency distribution of annual incomes (in thousands of dollars)for a sample of 200 families selected from a city.
The sample size is:
فتح الحزمة
افتح القفل للوصول البطاقات البالغ عددها 93 في هذه المجموعة.
فتح الحزمة
k this deck
64
Use the following to answer questions :
The following table gives the cumulative frequency distribution of annual incomes (in thousands of dollars)for a sample of 200 families selected from a city.
The number of families with an income of $40,000 or less is:
The following table gives the cumulative frequency distribution of annual incomes (in thousands of dollars)for a sample of 200 families selected from a city.
The number of families with an income of $40,000 or less is:
فتح الحزمة
افتح القفل للوصول البطاقات البالغ عددها 93 في هذه المجموعة.
فتح الحزمة
k this deck
65
Use the following to answer questions :
The following table gives the cumulative frequency distribution of the commuting time (in minutes)from home to work for a sample of 400 persons selected from a city.
Fifteen programmers were asked what computer language was used in their first programming class.The raw data appears below:
The percentage of people,rounded to two decimal places,who did not answer "Fortran" is:
The following table gives the cumulative frequency distribution of the commuting time (in minutes)from home to work for a sample of 400 persons selected from a city.
Fifteen programmers were asked what computer language was used in their first programming class.The raw data appears below:
The percentage of people,rounded to two decimal places,who did not answer "Fortran" is: فتح الحزمة
افتح القفل للوصول البطاقات البالغ عددها 93 في هذه المجموعة.
فتح الحزمة
k this deck
66
Use the following to answer questions :
The following table gives the cumulative frequency distribution of the commuting time (in minutes)from home to work for a sample of 400 persons selected from a city.
For the observation 4,the stem is:
The following table gives the cumulative frequency distribution of the commuting time (in minutes)from home to work for a sample of 400 persons selected from a city.
For the observation 4,the stem is:
فتح الحزمة
افتح القفل للوصول البطاقات البالغ عددها 93 في هذه المجموعة.
فتح الحزمة
k this deck
67
Use the following to answer questions :
A highway patrolman records the following speeds (in mph)for 25 cars that pass through his radar within a five-minute interval.Here is the histogram of that data:
How many observations fall in the fourth interval?
A highway patrolman records the following speeds (in mph)for 25 cars that pass through his radar within a five-minute interval.Here is the histogram of that data:
How many observations fall in the fourth interval?
فتح الحزمة
افتح القفل للوصول البطاقات البالغ عددها 93 في هذه المجموعة.
فتح الحزمة
k this deck
68
Use the following to answer questions :
The following table gives the cumulative frequency distribution of annual incomes (in thousands of dollars)for a sample of 200 families selected from a city.
The percentage of families with an income of less than $55,000,rounded to one decimal place,is:
The following table gives the cumulative frequency distribution of annual incomes (in thousands of dollars)for a sample of 200 families selected from a city.
The percentage of families with an income of less than $55,000,rounded to one decimal place,is:
فتح الحزمة
افتح القفل للوصول البطاقات البالغ عددها 93 في هذه المجموعة.
فتح الحزمة
k this deck
69
Use the following to answer questions :
The following table gives the cumulative frequency distribution of the commuting time (in minutes)from home to work for a sample of 400 persons selected from a city.
For the observation 34,the leaf is:
The following table gives the cumulative frequency distribution of the commuting time (in minutes)from home to work for a sample of 400 persons selected from a city.
For the observation 34,the leaf is:
فتح الحزمة
افتح القفل للوصول البطاقات البالغ عددها 93 في هذه المجموعة.
فتح الحزمة
k this deck
70
Use the following to answer questions :
The following table gives the cumulative frequency distribution of annual incomes (in thousands of dollars)for a sample of 200 families selected from a city.
The cumulative percentage for the second class,rounded to one decimal place,is:
The following table gives the cumulative frequency distribution of annual incomes (in thousands of dollars)for a sample of 200 families selected from a city.
The cumulative percentage for the second class,rounded to one decimal place,is:
فتح الحزمة
افتح القفل للوصول البطاقات البالغ عددها 93 في هذه المجموعة.
فتح الحزمة
k this deck
71
Use the following to answer questions :
The following table gives the cumulative frequency distribution of annual incomes (in thousands of dollars)for a sample of 200 families selected from a city.
The percentage of families with an income of $70,000 or more,rounded to one decimal place,is:
The following table gives the cumulative frequency distribution of annual incomes (in thousands of dollars)for a sample of 200 families selected from a city.
The percentage of families with an income of $70,000 or more,rounded to one decimal place,is:
فتح الحزمة
افتح القفل للوصول البطاقات البالغ عددها 93 في هذه المجموعة.
فتح الحزمة
k this deck
72
Use the following to answer questions :
The following table gives the cumulative frequency distribution of the commuting time (in minutes)from home to work for a sample of 400 persons selected from a city.
You ask 27 people what kind of pet they own.Seven people have dogs,five have cats,three have birds,and the remainder have no pets.The relative frequency of dog owners,rounded to three decimal places,is:
فتح الحزمة
افتح القفل للوصول البطاقات البالغ عددها 93 في هذه المجموعة.
فتح الحزمة
k this deck
73
Use the following to answer questions :
The following table gives the cumulative frequency distribution of the commuting time (in minutes)from home to work for a sample of 400 persons selected from a city.
In a game of four-handed Hearts,all 52 cards of a standard deck are dealt,so that each player starts each round with 13 cards in a hand.Suppose player A's hand has three clubs,six diamonds,two hearts,and two spades.What is the relative frequency of spades,rounded to two decimal places,dealt to player A?
فتح الحزمة
افتح القفل للوصول البطاقات البالغ عددها 93 في هذه المجموعة.
فتح الحزمة
k this deck
74
Use the following to answer questions :
The following table gives the cumulative frequency distribution of the commuting time (in minutes)from home to work for a sample of 400 persons selected from a city.
The number of persons who commute for 20 or more minutes is:
The following table gives the cumulative frequency distribution of the commuting time (in minutes)from home to work for a sample of 400 persons selected from a city.
The number of persons who commute for 20 or more minutes is:
فتح الحزمة
افتح القفل للوصول البطاقات البالغ عددها 93 في هذه المجموعة.
فتح الحزمة
k this deck
75
Use the following to answer questions :
The following table gives the cumulative frequency distribution of the commuting time (in minutes)from home to work for a sample of 400 persons selected from a city.
The cumulative relative frequency of the fourth class,rounded to four decimal places,is:
The following table gives the cumulative frequency distribution of the commuting time (in minutes)from home to work for a sample of 400 persons selected from a city.
The cumulative relative frequency of the fourth class,rounded to four decimal places,is:
فتح الحزمة
افتح القفل للوصول البطاقات البالغ عددها 93 في هذه المجموعة.
فتح الحزمة
k this deck
76
Use the following to answer questions :
The following table gives the cumulative frequency distribution of the commuting time (in minutes)from home to work for a sample of 400 persons selected from a city.
The percentage of persons who commute for less than 30 minutes,rounded to two decimal places,is:
The following table gives the cumulative frequency distribution of the commuting time (in minutes)from home to work for a sample of 400 persons selected from a city.
The percentage of persons who commute for less than 30 minutes,rounded to two decimal places,is:
فتح الحزمة
افتح القفل للوصول البطاقات البالغ عددها 93 في هذه المجموعة.
فتح الحزمة
k this deck
77
Use the following to answer questions :
The following table gives the cumulative frequency distribution of the commuting time (in minutes)from home to work for a sample of 400 persons selected from a city.
The percentage of persons who commute for 40 or more minutes,rounded to two decimal places,is:
The following table gives the cumulative frequency distribution of the commuting time (in minutes)from home to work for a sample of 400 persons selected from a city.
The percentage of persons who commute for 40 or more minutes,rounded to two decimal places,is:
فتح الحزمة
افتح القفل للوصول البطاقات البالغ عددها 93 في هذه المجموعة.
فتح الحزمة
k this deck
78
Use the following to answer questions :
A highway patrolman records the following speeds (in mph)for 25 cars that pass through his radar within a five-minute interval.Here is the histogram of that data:
The relative frequency of drivers whose speed is less than 55 mph,rounded to two decimal places,is?
A highway patrolman records the following speeds (in mph)for 25 cars that pass through his radar within a five-minute interval.Here is the histogram of that data:
The relative frequency of drivers whose speed is less than 55 mph,rounded to two decimal places,is?
فتح الحزمة
افتح القفل للوصول البطاقات البالغ عددها 93 في هذه المجموعة.
فتح الحزمة
k this deck
79
Use the following to answer questions :
A highway patrolman records the following speeds (in mph)for 25 cars that pass through his radar within a five-minute interval.Here is the histogram of that data:
What is the width of each class?
A highway patrolman records the following speeds (in mph)for 25 cars that pass through his radar within a five-minute interval.Here is the histogram of that data:
What is the width of each class?
فتح الحزمة
افتح القفل للوصول البطاقات البالغ عددها 93 في هذه المجموعة.
فتح الحزمة
k this deck
80
Use the following to answer questions :
The following table gives the cumulative frequency distribution of the commuting time (in minutes)from home to work for a sample of 400 persons selected from a city.
The sample size is:
The following table gives the cumulative frequency distribution of the commuting time (in minutes)from home to work for a sample of 400 persons selected from a city.
The sample size is:
فتح الحزمة
افتح القفل للوصول البطاقات البالغ عددها 93 في هذه المجموعة.
فتح الحزمة
k this deck
فتح الحزمة
افتح القفل للوصول البطاقات البالغ عددها 93 في هذه المجموعة.


