Deck 16: Simple Linear Regression and Correlation
ملء الشاشة (f)
سؤال
سؤال
The variance of the error variable  is required to be constant.When this requirement is satisfied, the condition is called homoscedasticity.
is required to be constant.When this requirement is satisfied, the condition is called homoscedasticity. سؤال
سؤال
سؤال
سؤال
سؤال
سؤال
سؤال
سؤال
When the variance  of the error variable
  is a constant no matter what the value of x is, this condition is called:
A) heterocausality.
B) homoscedasticity.
C) homocausality.
D) heteroscedasticity.
of the error variable is a constant no matter what the value of x is, this condition is called:A) heterocausality.
B) homoscedasticity.
C) homocausality.
D) heteroscedasticity.
سؤال
سؤال
The variance of the error variable  is required to be constant.When this requirement is violated, the condition is called heteroscedasticity.
is required to be constant.When this requirement is violated, the condition is called heteroscedasticity. سؤال
سؤال
The least squares method requires that the variance  of the error variable is a constant no matter what the value of x is.When this requirement is violated, the condition is called:
A) heteroscedasticity.
B) homoscedasticity.
C) influential observation.
D) non-independence of https://d2lvgg3v3hfg70.cloudfront.net/TB7453/ .
.
of the error variable is a constant no matter what the value of x is.When this requirement is violated, the condition is called:A) heteroscedasticity.
B) homoscedasticity.
C) influential observation.
D) non-independence of https://d2lvgg3v3hfg70.cloudfront.net/TB7453/
. سؤال
سؤال
سؤال
سؤال
سؤال
سؤال
سؤال
Telemarketing Sales and Experience
The general manager of a telemarketing company believes that experience is the most important factor in determining the level of success of a telemarketer.To examine this belief she records last month's sales (in $1,000s) and the years of experience of 10 randomly selected telemarketers.These data are listed below.

{Telemarketer Sales and Experience Narrative} Plot the residuals against the predicted values of y.What does the graph tell you?
The general manager of a telemarketing company believes that experience is the most important factor in determining the level of success of a telemarketer.To examine this belief she records last month's sales (in $1,000s) and the years of experience of 10 randomly selected telemarketers.These data are listed below.
{Telemarketer Sales and Experience Narrative} Plot the residuals against the predicted values of y.What does the graph tell you?
سؤال
Marc Anthony Concert
At a recent Marc Anthony concert, a survey was conducted that asked a random sample of 20 people their age and how many concerts they have attended since the first of the year.The following data were collected:
 An Excel output follows:
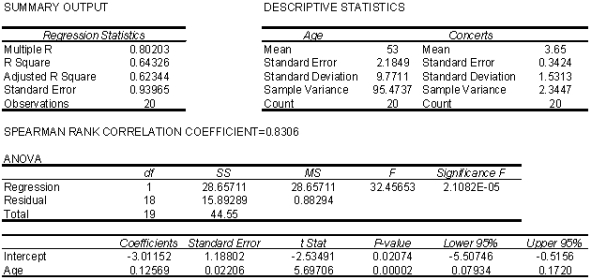
{Marc Anthony Concert Narrative} Use the regression equation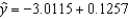 to determine the predicted values of y.
At a recent Marc Anthony concert, a survey was conducted that asked a random sample of 20 people their age and how many concerts they have attended since the first of the year.The following data were collected:
An Excel output follows: {Marc Anthony Concert Narrative} Use the regression equation
to determine the predicted values of y. سؤال
Marc Anthony Concert
At a recent Marc Anthony concert, a survey was conducted that asked a random sample of 20 people their age and how many concerts they have attended since the first of the year.The following data were collected:
An Excel output follows:
{Marc Anthony Concert Narrative} Use the predicted values and the actual values of y to calculate the residuals.
At a recent Marc Anthony concert, a survey was conducted that asked a random sample of 20 people their age and how many concerts they have attended since the first of the year.The following data were collected:
An Excel output follows: {Marc Anthony Concert Narrative} Use the predicted values and the actual values of y to calculate the residuals.
سؤال
Game Winnings & Education
An ardent fan of television game shows has observed that, in general, the more educated the contestant, the less money he or she wins.To test her belief she gathers data about the last eight winners of her favorite game show.She records their winnings in dollars and the number of years of education.The results are as follows.

{Game Winnings & Education Narrative} Identify possible outliers.
An ardent fan of television game shows has observed that, in general, the more educated the contestant, the less money he or she wins.To test her belief she gathers data about the last eight winners of her favorite game show.She records their winnings in dollars and the number of years of education.The results are as follows.
{Game Winnings & Education Narrative} Identify possible outliers.
سؤال
Game Winnings & Education
An ardent fan of television game shows has observed that, in general, the more educated the contestant, the less money he or she wins.To test her belief she gathers data about the last eight winners of her favorite game show.She records their winnings in dollars and the number of years of education.The results are as follows.
-{Game Winnings & Education Narrative} Use the predicted and actual values of y to calculate the residuals.
سؤال
Marc Anthony Concert
At a recent Marc Anthony concert, a survey was conducted that asked a random sample of 20 people their age and how many concerts they have attended since the first of the year.The following data were collected:
An Excel output follows:
{Marc Anthony Concert Narrative} Plot the residuals against the predicted values .
.
At a recent Marc Anthony concert, a survey was conducted that asked a random sample of 20 people their age and how many concerts they have attended since the first of the year.The following data were collected:
An Excel output follows: {Marc Anthony Concert Narrative} Plot the residuals against the predicted values
. سؤال
Comedy Shows Revenues
A financier whose specialty is investing in comedy shows has observed that, in general, shows with "big-name" stars seem to generate more revenue than those shows whose stars are less well known.To examine his belief he records the gross revenue and the payment (in $ millions) given to the two highest-paid comedians in the show for ten recently staged shows.

-{Comedy Shows Revenues Narrative} Use the predicted and actual values of y to calculate the residuals.
A financier whose specialty is investing in comedy shows has observed that, in general, shows with "big-name" stars seem to generate more revenue than those shows whose stars are less well known.To examine his belief he records the gross revenue and the payment (in $ millions) given to the two highest-paid comedians in the show for ten recently staged shows.
-{Comedy Shows Revenues Narrative} Use the predicted and actual values of y to calculate the residuals.
سؤال
Game Winnings & Education
An ardent fan of television game shows has observed that, in general, the more educated the contestant, the less money he or she wins.To test her belief she gathers data about the last eight winners of her favorite game show.She records their winnings in dollars and the number of years of education.The results are as follows.
{Game Winnings & Education Narrative} Plot the residuals against the predicted values .What does the graph tell you?
An ardent fan of television game shows has observed that, in general, the more educated the contestant, the less money he or she wins.To test her belief she gathers data about the last eight winners of her favorite game show.She records their winnings in dollars and the number of years of education.The results are as follows.
{Game Winnings & Education Narrative} Plot the residuals against the predicted values
.What does the graph tell you? سؤال
سؤال
Comedy Shows Revenues
A financier whose specialty is investing in comedy shows has observed that, in general, shows with "big-name" stars seem to generate more revenue than those shows whose stars are less well known.To examine his belief he records the gross revenue and the payment (in $ millions) given to the two highest-paid comedians in the show for ten recently staged shows.
{Comedy Shows Revenues Narrative} Use the regression equation to determine the predicted values of y.
A financier whose specialty is investing in comedy shows has observed that, in general, shows with "big-name" stars seem to generate more revenue than those shows whose stars are less well known.To examine his belief he records the gross revenue and the payment (in $ millions) given to the two highest-paid comedians in the show for ten recently staged shows.
{Comedy Shows Revenues Narrative} Use the regression equation
to determine the predicted values of y. سؤال
Comedy Shows Revenues
A financier whose specialty is investing in comedy shows has observed that, in general, shows with "big-name" stars seem to generate more revenue than those shows whose stars are less well known.To examine his belief he records the gross revenue and the payment (in $ millions) given to the two highest-paid comedians in the show for ten recently staged shows.
{Comedy Shows Revenues Narrative} Plot the residuals against the predicted values of y.What does the graph tell you?
سؤال
Telemarketing Sales and Experience
The general manager of a telemarketing company believes that experience is the most important factor in determining the level of success of a telemarketer.To examine this belief she records last month's sales (in $1,000s) and the years of experience of 10 randomly selected telemarketers.These data are listed below.
{Telemarketer Sales and Experience Narrative} Identify possible outliers.
سؤال
Game Winnings & Education
An ardent fan of television game shows has observed that, in general, the more educated the contestant, the less money he or she wins.To test her belief she gathers data about the last eight winners of her favorite game show.She records their winnings in dollars and the number of years of education.The results are as follows.
-{Game Winnings & Education Narrative} Compute the standardized residuals.
سؤال
Telemarketing Sales and Experience
The general manager of a telemarketing company believes that experience is the most important factor in determining the level of success of a telemarketer.To examine this belief she records last month's sales (in $1,000s) and the years of experience of 10 randomly selected telemarketers.These data are listed below.
{Telemarketer Sales and Experience Narrative} Use the regression equation to determine the predicted values of y.
The general manager of a telemarketing company believes that experience is the most important factor in determining the level of success of a telemarketer.To examine this belief she records last month's sales (in $1,000s) and the years of experience of 10 randomly selected telemarketers.These data are listed below.
{Telemarketer Sales and Experience Narrative} Use the regression equation
to determine the predicted values of y. سؤال
Marc Anthony Concert
At a recent Marc Anthony concert, a survey was conducted that asked a random sample of 20 people their age and how many concerts they have attended since the first of the year.The following data were collected:
An Excel output follows:
{Marc Anthony Concert Narrative} Does it appear that heteroscedasticity is a problem? Explain.
At a recent Marc Anthony concert, a survey was conducted that asked a random sample of 20 people their age and how many concerts they have attended since the first of the year.The following data were collected:
An Excel output follows: {Marc Anthony Concert Narrative} Does it appear that heteroscedasticity is a problem? Explain.
سؤال
سؤال
سؤال
Telemarketing Sales and Experience
The general manager of a telemarketing company believes that experience is the most important factor in determining the level of success of a telemarketer.To examine this belief she records last month's sales (in $1,000s) and the years of experience of 10 randomly selected telemarketers.These data are listed below.
-{Telemarketer Sales and Experience Narrative} Use the predicted and actual values of y to calculate the residuals.
سؤال
Telemarketing Sales and Experience
The general manager of a telemarketing company believes that experience is the most important factor in determining the level of success of a telemarketer.To examine this belief she records last month's sales (in $1,000s) and the years of experience of 10 randomly selected telemarketers.These data are listed below.
-{Telemarketer Sales and Experience Narrative} Compute the standardized residuals.
سؤال
Game Winnings & Education
An ardent fan of television game shows has observed that, in general, the more educated the contestant, the less money he or she wins.To test her belief she gathers data about the last eight winners of her favorite game show.She records their winnings in dollars and the number of years of education.The results are as follows.
{Game Winnings & Education Narrative} Use the regression equation to determine the predicted values of y.
An ardent fan of television game shows has observed that, in general, the more educated the contestant, the less money he or she wins.To test her belief she gathers data about the last eight winners of her favorite game show.She records their winnings in dollars and the number of years of education.The results are as follows.
{Game Winnings & Education Narrative} Use the regression equation
to determine the predicted values of y. سؤال
Oil Quality and Price
Quality of oil is measured in API gravity degrees--the higher the degrees API, the higher the quality.The table shown below is produced by an expert in the field who believes that there is a relationship between quality and price per barrel.
 A partial Minitab output follows:


{Oil Quality and Price Narrative} Use the regression equation to determine the predicted values of y.
Quality of oil is measured in API gravity degrees--the higher the degrees API, the higher the quality.The table shown below is produced by an expert in the field who believes that there is a relationship between quality and price per barrel.
A partial Minitab output follows: {Oil Quality and Price Narrative} Use the regression equation
to determine the predicted values of y. سؤال
A regression analysis between weight (y in pounds) and height (x in inches) resulted in the following least squares line:  .This implies that if the height is increased by 1 inch, the weight is expected to increase by an average of 6 pounds.
.This implies that if the height is increased by 1 inch, the weight is expected to increase by an average of 6 pounds. سؤال
Marc Anthony Concert
At a recent Marc Anthony concert, a survey was conducted that asked a random sample of 20 people their age and how many concerts they have attended since the first of the year.The following data were collected:
An Excel output follows:
{Marc Anthony Concert Narrative} Draw a histogram of the residuals.
At a recent Marc Anthony concert, a survey was conducted that asked a random sample of 20 people their age and how many concerts they have attended since the first of the year.The following data were collected:
An Excel output follows: {Marc Anthony Concert Narrative} Draw a histogram of the residuals.
سؤال
A simple linear regression equation is given by  .The point estimate of y when x = 4 is 20.45.
.The point estimate of y when x = 4 is 20.45. سؤال
سؤال
Oil Quality and Price
Quality of oil is measured in API gravity degrees--the higher the degrees API, the higher the quality.The table shown below is produced by an expert in the field who believes that there is a relationship between quality and price per barrel.
A partial Minitab output follows:
{Oil Quality and Price Narrative} Does it appear that the errors are normally distributed? Explain.
Quality of oil is measured in API gravity degrees--the higher the degrees API, the higher the quality.The table shown below is produced by an expert in the field who believes that there is a relationship between quality and price per barrel.
A partial Minitab output follows: {Oil Quality and Price Narrative} Does it appear that the errors are normally distributed? Explain.
سؤال
Oil Quality and Price
Quality of oil is measured in API gravity degrees--the higher the degrees API, the higher the quality.The table shown below is produced by an expert in the field who believes that there is a relationship between quality and price per barrel.
A partial Minitab output follows:
-{Oil Quality and Price Narrative} Use the predicted values and the actual values of y to calculate the residuals.
Quality of oil is measured in API gravity degrees--the higher the degrees API, the higher the quality.The table shown below is produced by an expert in the field who believes that there is a relationship between quality and price per barrel.
A partial Minitab output follows: -{Oil Quality and Price Narrative} Use the predicted values and the actual values of y to calculate the residuals.
سؤال
A regression analysis between sales (in $) and advertising (in $) resulted in the following least squares line:  .This implies that an increase of $1 in advertising is associated with an increase of $60 in sales.
.This implies that an increase of $1 in advertising is associated with an increase of $60 in sales. سؤال
Oil Quality and Price
Quality of oil is measured in API gravity degrees--the higher the degrees API, the higher the quality.The table shown below is produced by an expert in the field who believes that there is a relationship between quality and price per barrel.
A partial Minitab output follows:
{Oil Quality and Price Narrative} Identify possible outliers.
Quality of oil is measured in API gravity degrees--the higher the degrees API, the higher the quality.The table shown below is produced by an expert in the field who believes that there is a relationship between quality and price per barrel.
A partial Minitab output follows: {Oil Quality and Price Narrative} Identify possible outliers.
سؤال
سؤال
Oil Quality and Price
Quality of oil is measured in API gravity degrees--the higher the degrees API, the higher the quality.The table shown below is produced by an expert in the field who believes that there is a relationship between quality and price per barrel.
A partial Minitab output follows:
{Oil Quality and Price Narrative} Plot the residuals against the predicted values .
.
Quality of oil is measured in API gravity degrees--the higher the degrees API, the higher the quality.The table shown below is produced by an expert in the field who believes that there is a relationship between quality and price per barrel.
A partial Minitab output follows: {Oil Quality and Price Narrative} Plot the residuals against the predicted values
. سؤال
Marc Anthony Concert
At a recent Marc Anthony concert, a survey was conducted that asked a random sample of 20 people their age and how many concerts they have attended since the first of the year.The following data were collected:
An Excel output follows:
{Marc Anthony Concert Narrative} Does it appear that the errors are normally distributed? Explain.
At a recent Marc Anthony concert, a survey was conducted that asked a random sample of 20 people their age and how many concerts they have attended since the first of the year.The following data were collected:
An Excel output follows: {Marc Anthony Concert Narrative} Does it appear that the errors are normally distributed? Explain.
سؤال
سؤال
Marc Anthony Concert
At a recent Marc Anthony concert, a survey was conducted that asked a random sample of 20 people their age and how many concerts they have attended since the first of the year.The following data were collected:
An Excel output follows:
{Marc Anthony Concert Narrative} Identify possible outliers.
At a recent Marc Anthony concert, a survey was conducted that asked a random sample of 20 people their age and how many concerts they have attended since the first of the year.The following data were collected:
An Excel output follows: {Marc Anthony Concert Narrative} Identify possible outliers.
سؤال
Marc Anthony Concert
At a recent Marc Anthony concert, a survey was conducted that asked a random sample of 20 people their age and how many concerts they have attended since the first of the year.The following data were collected:
An Excel output follows:
-{Marc Anthony Concert Narrative} Use the residuals to compute the standardized residuals.
At a recent Marc Anthony concert, a survey was conducted that asked a random sample of 20 people their age and how many concerts they have attended since the first of the year.The following data were collected:
An Excel output follows: -{Marc Anthony Concert Narrative} Use the residuals to compute the standardized residuals.
سؤال
Oil Quality and Price
Quality of oil is measured in API gravity degrees--the higher the degrees API, the higher the quality.The table shown below is produced by an expert in the field who believes that there is a relationship between quality and price per barrel.
A partial Minitab output follows:
{Oil Quality and Price Narrative} Draw a histogram of the residuals.
Quality of oil is measured in API gravity degrees--the higher the degrees API, the higher the quality.The table shown below is produced by an expert in the field who believes that there is a relationship between quality and price per barrel.
A partial Minitab output follows: {Oil Quality and Price Narrative} Draw a histogram of the residuals.
سؤال
Oil Quality and Price
Quality of oil is measured in API gravity degrees--the higher the degrees API, the higher the quality.The table shown below is produced by an expert in the field who believes that there is a relationship between quality and price per barrel.
A partial Minitab output follows:
{Oil Quality and Price Narrative} Does it appear that heteroscedasticity is a problem? Explain.
Quality of oil is measured in API gravity degrees--the higher the degrees API, the higher the quality.The table shown below is produced by an expert in the field who believes that there is a relationship between quality and price per barrel.
A partial Minitab output follows: {Oil Quality and Price Narrative} Does it appear that heteroscedasticity is a problem? Explain.
سؤال
Oil Quality and Price
Quality of oil is measured in API gravity degrees--the higher the degrees API, the higher the quality.The table shown below is produced by an expert in the field who believes that there is a relationship between quality and price per barrel.
A partial Minitab output follows:
-{Oil Quality and Price Narrative} Use the residuals to compute the standardized residuals.
Quality of oil is measured in API gravity degrees--the higher the degrees API, the higher the quality.The table shown below is produced by an expert in the field who believes that there is a relationship between quality and price per barrel.
A partial Minitab output follows: -{Oil Quality and Price Narrative} Use the residuals to compute the standardized residuals.
سؤال
سؤال
سؤال
سؤال
سؤال
The regression line  has been fitted to the data points (4, 8), (2, 5), and (1, 2).The sum of the squared residuals will be:
A) 7
B) 15
C) 8
D) 22
has been fitted to the data points (4, 8), (2, 5), and (1, 2).The sum of the squared residuals will be:A) 7
B) 15
C) 8
D) 22
سؤال
A regression analysis between sales (in $1,000) and advertising (in $1,000) resulted in the following least squares line:  .This implies that:
A) as advertising increases by $1,000, sales increases by $5,000.
B) as advertising increases by $1,000, sales increases by $80,000.
C) as advertising increases by $5, sales increases by $80.
D) None of these choices.
.This implies that:A) as advertising increases by $1,000, sales increases by $5,000.
B) as advertising increases by $1,000, sales increases by $80,000.
C) as advertising increases by $5, sales increases by $80.
D) None of these choices.
سؤال
A regression analysis between sales (in $1000) and advertising (in $100) resulted in the following least squares line:  .This implies that if advertising is $800, then the predicted amount of sales (in dollars) is:
A) $4875
B) $123,000
C) $487,500
D) $12,300
.This implies that if advertising is $800, then the predicted amount of sales (in dollars) is:A) $4875
B) $123,000
C) $487,500
D) $12,300
سؤال
The residuals are observations of the error variable https://d2lvgg3v3hfg70.cloudfront.net/TB7453/ .Consequently, the minimized sum of squared deviations is called the sum of squares for error, denoted SSE.
.Consequently, the minimized sum of squared deviations is called the sum of squares for error, denoted SSE. سؤال
سؤال
سؤال
سؤال
The residual ri is defined as the difference between the actual value yi and the estimated value  .
.
. سؤال
سؤال
Given the least squares regression line  :
:
A) the relationship between x and y is positive.
B) the relationship between x and y is negative.
C) as x decreases, so does y.
D) None of these choices.
:A) the relationship between x and y is positive.
B) the relationship between x and y is negative.
C) as x decreases, so does y.
D) None of these choices.
سؤال
A regression analysis between weight (y in pounds) and height (x in inches) resulted in the following least squares line:  .This implies that if the height is increased by 1 inch, the weight, on average, is expected to:
A) increase by 1 pound.
B) decrease by 1 pound.
C) increase by 5 pounds.
D) increase by 24 pounds.
.This implies that if the height is increased by 1 inch, the weight, on average, is expected to:A) increase by 1 pound.
B) decrease by 1 pound.
C) increase by 5 pounds.
D) increase by 24 pounds.
سؤال
The regression line  has been fitted to the data points (4, 11), (2, 7), and (1, 5).The sum of squares for error will be 10.0.
has been fitted to the data points (4, 11), (2, 7), and (1, 5).The sum of squares for error will be 10.0. سؤال
سؤال
If cov(x, y) = 7.5075 and  , then the sample slope coefficient is 2.145.
, then the sample slope coefficient is 2.145. سؤال
سؤال
A regression analysis between sales (in $1000) and advertising (in $100) resulted in the following least squares line:  .This implies that if advertising is $600, then the predicted amount of sales (in dollars) is $125,000.
.This implies that if advertising is $600, then the predicted amount of sales (in dollars) is $125,000. سؤال
سؤال

فتح الحزمة
قم بالتسجيل لفتح البطاقات في هذه المجموعة!
Unlock Deck
Unlock Deck
1/298
العب
ملء الشاشة (f)
Deck 16: Simple Linear Regression and Correlation
1
We check for normality by drawing a(n) ____________________ of the residuals.
histogram
2
The variance of the error variable is required to be constant.When this requirement is satisfied, the condition is called homoscedasticity.
is required to be constant.When this requirement is satisfied, the condition is called homoscedasticity.True
3
When the error variable does not have constant variance, this condition is called ____________________.
heteroscedasticity
4
One method of diagnosing heteroscedasticity is to plot the residuals against the predicted values of y, then look for a change in the spread of the plotted values.
فتح الحزمة
افتح القفل للوصول البطاقات البالغ عددها 298 في هذه المجموعة.
فتح الحزمة
k this deck
5
Error terms that are autocorrelated ____________________ (are/are not) independent.
فتح الحزمة
افتح القفل للوصول البطاقات البالغ عددها 298 في هذه المجموعة.
فتح الحزمة
k this deck
6
If you take the residuals, subtract their mean and divide by their standard deviation, the result is called the ____________________ residuals.
فتح الحزمة
افتح القفل للوصول البطاقات البالغ عددها 298 في هذه المجموعة.
فتح الحزمة
k this deck
7
If the plot of the residuals vs.the predicted values resembles a straight line with non-zero slope, then the regression line fits well.
فتح الحزمة
افتح القفل للوصول البطاقات البالغ عددها 298 في هذه المجموعة.
فتح الحزمة
k this deck
8
If the plot of the residuals is fan shaped, which assumption of regression analysis (if any) is violated?
A) No assumptions are violated.
B) Independence of errors
C) Homoscedasticity
D) Normality
A) No assumptions are violated.
B) Independence of errors
C) Homoscedasticity
D) Normality
فتح الحزمة
افتح القفل للوصول البطاقات البالغ عددها 298 في هذه المجموعة.
فتح الحزمة
k this deck
9
The plot of residuals vs.predicted values should show no patterns if the conditions of a regression analysis are met.
فتح الحزمة
افتح القفل للوصول البطاقات البالغ عددها 298 في هذه المجموعة.
فتح الحزمة
k this deck
10
When the variance of the error variable is a constant no matter what the value of x is, this condition is called:
A) heterocausality.
B) homoscedasticity.
C) homocausality.
D) heteroscedasticity.
of the error variable is a constant no matter what the value of x is, this condition is called:A) heterocausality.
B) homoscedasticity.
C) homocausality.
D) heteroscedasticity.
فتح الحزمة
افتح القفل للوصول البطاقات البالغ عددها 298 في هذه المجموعة.
فتح الحزمة
k this deck
11
We check for normality by drawing a pie chart of the residuals.
فتح الحزمة
افتح القفل للوصول البطاقات البالغ عددها 298 في هذه المجموعة.
فتح الحزمة
k this deck
12
The variance of the error variable is required to be constant.When this requirement is violated, the condition is called heteroscedasticity.
is required to be constant.When this requirement is violated, the condition is called heteroscedasticity. فتح الحزمة
افتح القفل للوصول البطاقات البالغ عددها 298 في هذه المجموعة.
فتح الحزمة
k this deck
13
An outlier is an observation that is unusually small or unusually large.
فتح الحزمة
افتح القفل للوصول البطاقات البالغ عددها 298 في هذه المجموعة.
فتح الحزمة
k this deck
14
The least squares method requires that the variance of the error variable is a constant no matter what the value of x is.When this requirement is violated, the condition is called:
A) heteroscedasticity.
B) homoscedasticity.
C) influential observation.
D) non-independence of https://d2lvgg3v3hfg70.cloudfront.net/TB7453/.
of the error variable is a constant no matter what the value of x is.When this requirement is violated, the condition is called:A) heteroscedasticity.
B) homoscedasticity.
C) influential observation.
D) non-independence of https://d2lvgg3v3hfg70.cloudfront.net/TB7453/
. فتح الحزمة
افتح القفل للوصول البطاقات البالغ عددها 298 في هذه المجموعة.
فتح الحزمة
k this deck
15
We standardize residuals by subtracting their mean and dividing by their variance.
فتح الحزمة
افتح القفل للوصول البطاقات البالغ عددها 298 في هذه المجموعة.
فتح الحزمة
k this deck
16
Data that exhibit an autocorrelation effect violate the regression assumption of independence.
فتح الحزمة
افتح القفل للوصول البطاقات البالغ عددها 298 في هذه المجموعة.
فتح الحزمة
k this deck
17
If the variance of the errors is constant for each predicted y value, the condition is called ____________________.
فتح الحزمة
افتح القفل للوصول البطاقات البالغ عددها 298 في هذه المجموعة.
فتح الحزمة
k this deck
18
The spread in the residuals should increase as the predicted value of y increases.
فتح الحزمة
افتح القفل للوصول البطاقات البالغ عددها 298 في هذه المجموعة.
فتح الحزمة
k this deck
19
The standardized residual is defined as:
A) residual multiplied by the square root of the standard error of estimate.
B) residual multiplied by the standard error of estimate.
C) residual divided by the square of the standard error of estimate.
D) residual divided by the standard error of estimate.
A) residual multiplied by the square root of the standard error of estimate.
B) residual multiplied by the standard error of estimate.
C) residual divided by the square of the standard error of estimate.
D) residual divided by the standard error of estimate.
فتح الحزمة
افتح القفل للوصول البطاقات البالغ عددها 298 في هذه المجموعة.
فتح الحزمة
k this deck
20
Error terms that are correlated over time are said to be ____________________.
فتح الحزمة
افتح القفل للوصول البطاقات البالغ عددها 298 في هذه المجموعة.
فتح الحزمة
k this deck
21
Telemarketing Sales and Experience
The general manager of a telemarketing company believes that experience is the most important factor in determining the level of success of a telemarketer.To examine this belief she records last month's sales (in $1,000s) and the years of experience of 10 randomly selected telemarketers.These data are listed below.
{Telemarketer Sales and Experience Narrative} Plot the residuals against the predicted values of y.What does the graph tell you?
فتح الحزمة
افتح القفل للوصول البطاقات البالغ عددها 298 في هذه المجموعة.
فتح الحزمة
k this deck
22
Marc Anthony Concert
At a recent Marc Anthony concert, a survey was conducted that asked a random sample of 20 people their age and how many concerts they have attended since the first of the year.The following data were collected:
An Excel output follows:
{Marc Anthony Concert Narrative} Use the regression equation to determine the predicted values of y.
At a recent Marc Anthony concert, a survey was conducted that asked a random sample of 20 people their age and how many concerts they have attended since the first of the year.The following data were collected:
An Excel output follows: {Marc Anthony Concert Narrative} Use the regression equation
to determine the predicted values of y. فتح الحزمة
افتح القفل للوصول البطاقات البالغ عددها 298 في هذه المجموعة.
فتح الحزمة
k this deck
23
Marc Anthony Concert
At a recent Marc Anthony concert, a survey was conducted that asked a random sample of 20 people their age and how many concerts they have attended since the first of the year.The following data were collected:
An Excel output follows:
{Marc Anthony Concert Narrative} Use the predicted values and the actual values of y to calculate the residuals.
At a recent Marc Anthony concert, a survey was conducted that asked a random sample of 20 people their age and how many concerts they have attended since the first of the year.The following data were collected:
An Excel output follows: {Marc Anthony Concert Narrative} Use the predicted values and the actual values of y to calculate the residuals.
فتح الحزمة
افتح القفل للوصول البطاقات البالغ عددها 298 في هذه المجموعة.
فتح الحزمة
k this deck
24
Game Winnings & Education
An ardent fan of television game shows has observed that, in general, the more educated the contestant, the less money he or she wins.To test her belief she gathers data about the last eight winners of her favorite game show.She records their winnings in dollars and the number of years of education.The results are as follows.
{Game Winnings & Education Narrative} Identify possible outliers.
فتح الحزمة
افتح القفل للوصول البطاقات البالغ عددها 298 في هذه المجموعة.
فتح الحزمة
k this deck
25
Game Winnings & Education
An ardent fan of television game shows has observed that, in general, the more educated the contestant, the less money he or she wins.To test her belief she gathers data about the last eight winners of her favorite game show.She records their winnings in dollars and the number of years of education.The results are as follows.
-{Game Winnings & Education Narrative} Use the predicted and actual values of y to calculate the residuals.
فتح الحزمة
افتح القفل للوصول البطاقات البالغ عددها 298 في هذه المجموعة.
فتح الحزمة
k this deck
26
Marc Anthony Concert
At a recent Marc Anthony concert, a survey was conducted that asked a random sample of 20 people their age and how many concerts they have attended since the first of the year.The following data were collected:
An Excel output follows:
{Marc Anthony Concert Narrative} Plot the residuals against the predicted values .
At a recent Marc Anthony concert, a survey was conducted that asked a random sample of 20 people their age and how many concerts they have attended since the first of the year.The following data were collected:
An Excel output follows: {Marc Anthony Concert Narrative} Plot the residuals against the predicted values
. فتح الحزمة
افتح القفل للوصول البطاقات البالغ عددها 298 في هذه المجموعة.
فتح الحزمة
k this deck
27
Comedy Shows Revenues
A financier whose specialty is investing in comedy shows has observed that, in general, shows with "big-name" stars seem to generate more revenue than those shows whose stars are less well known.To examine his belief he records the gross revenue and the payment (in $ millions) given to the two highest-paid comedians in the show for ten recently staged shows.
-{Comedy Shows Revenues Narrative} Use the predicted and actual values of y to calculate the residuals.
فتح الحزمة
افتح القفل للوصول البطاقات البالغ عددها 298 في هذه المجموعة.
فتح الحزمة
k this deck
28
Game Winnings & Education
An ardent fan of television game shows has observed that, in general, the more educated the contestant, the less money he or she wins.To test her belief she gathers data about the last eight winners of her favorite game show.She records their winnings in dollars and the number of years of education.The results are as follows.
{Game Winnings & Education Narrative} Plot the residuals against the predicted values .What does the graph tell you?
An ardent fan of television game shows has observed that, in general, the more educated the contestant, the less money he or she wins.To test her belief she gathers data about the last eight winners of her favorite game show.She records their winnings in dollars and the number of years of education.The results are as follows.
{Game Winnings & Education Narrative} Plot the residuals against the predicted values
.What does the graph tell you? فتح الحزمة
افتح القفل للوصول البطاقات البالغ عددها 298 في هذه المجموعة.
فتح الحزمة
k this deck
29
A(n) ____________________ is an observation that is unusually small or large.
فتح الحزمة
افتح القفل للوصول البطاقات البالغ عددها 298 في هذه المجموعة.
فتح الحزمة
k this deck
30
Comedy Shows Revenues
A financier whose specialty is investing in comedy shows has observed that, in general, shows with "big-name" stars seem to generate more revenue than those shows whose stars are less well known.To examine his belief he records the gross revenue and the payment (in $ millions) given to the two highest-paid comedians in the show for ten recently staged shows.
{Comedy Shows Revenues Narrative} Use the regression equation to determine the predicted values of y.
A financier whose specialty is investing in comedy shows has observed that, in general, shows with "big-name" stars seem to generate more revenue than those shows whose stars are less well known.To examine his belief he records the gross revenue and the payment (in $ millions) given to the two highest-paid comedians in the show for ten recently staged shows.
{Comedy Shows Revenues Narrative} Use the regression equation
to determine the predicted values of y. فتح الحزمة
افتح القفل للوصول البطاقات البالغ عددها 298 في هذه المجموعة.
فتح الحزمة
k this deck
31
Comedy Shows Revenues
A financier whose specialty is investing in comedy shows has observed that, in general, shows with "big-name" stars seem to generate more revenue than those shows whose stars are less well known.To examine his belief he records the gross revenue and the payment (in $ millions) given to the two highest-paid comedians in the show for ten recently staged shows.
{Comedy Shows Revenues Narrative} Plot the residuals against the predicted values of y.What does the graph tell you?
فتح الحزمة
افتح القفل للوصول البطاقات البالغ عددها 298 في هذه المجموعة.
فتح الحزمة
k this deck
32
Telemarketing Sales and Experience
The general manager of a telemarketing company believes that experience is the most important factor in determining the level of success of a telemarketer.To examine this belief she records last month's sales (in $1,000s) and the years of experience of 10 randomly selected telemarketers.These data are listed below.
{Telemarketer Sales and Experience Narrative} Identify possible outliers.
فتح الحزمة
افتح القفل للوصول البطاقات البالغ عددها 298 في هذه المجموعة.
فتح الحزمة
k this deck
33
Game Winnings & Education
An ardent fan of television game shows has observed that, in general, the more educated the contestant, the less money he or she wins.To test her belief she gathers data about the last eight winners of her favorite game show.She records their winnings in dollars and the number of years of education.The results are as follows.
-{Game Winnings & Education Narrative} Compute the standardized residuals.
فتح الحزمة
افتح القفل للوصول البطاقات البالغ عددها 298 في هذه المجموعة.
فتح الحزمة
k this deck
34
Telemarketing Sales and Experience
The general manager of a telemarketing company believes that experience is the most important factor in determining the level of success of a telemarketer.To examine this belief she records last month's sales (in $1,000s) and the years of experience of 10 randomly selected telemarketers.These data are listed below.
{Telemarketer Sales and Experience Narrative} Use the regression equation to determine the predicted values of y.
The general manager of a telemarketing company believes that experience is the most important factor in determining the level of success of a telemarketer.To examine this belief she records last month's sales (in $1,000s) and the years of experience of 10 randomly selected telemarketers.These data are listed below.
{Telemarketer Sales and Experience Narrative} Use the regression equation
to determine the predicted values of y. فتح الحزمة
افتح القفل للوصول البطاقات البالغ عددها 298 في هذه المجموعة.
فتح الحزمة
k this deck
35
Marc Anthony Concert
At a recent Marc Anthony concert, a survey was conducted that asked a random sample of 20 people their age and how many concerts they have attended since the first of the year.The following data were collected:
An Excel output follows:
{Marc Anthony Concert Narrative} Does it appear that heteroscedasticity is a problem? Explain.
At a recent Marc Anthony concert, a survey was conducted that asked a random sample of 20 people their age and how many concerts they have attended since the first of the year.The following data were collected:
An Excel output follows: {Marc Anthony Concert Narrative} Does it appear that heteroscedasticity is a problem? Explain.
فتح الحزمة
افتح القفل للوصول البطاقات البالغ عددها 298 في هذه المجموعة.
فتح الحزمة
k this deck
36
We can often detect autocorrelation by graphing the residuals against ____________________.
فتح الحزمة
افتح القفل للوصول البطاقات البالغ عددها 298 في هذه المجموعة.
فتح الحزمة
k this deck
37
If a single point has a large impact on the equation of the regression line, it is called a(n) ____________________ point.
فتح الحزمة
افتح القفل للوصول البطاقات البالغ عددها 298 في هذه المجموعة.
فتح الحزمة
k this deck
38
Telemarketing Sales and Experience
The general manager of a telemarketing company believes that experience is the most important factor in determining the level of success of a telemarketer.To examine this belief she records last month's sales (in $1,000s) and the years of experience of 10 randomly selected telemarketers.These data are listed below.
-{Telemarketer Sales and Experience Narrative} Use the predicted and actual values of y to calculate the residuals.
فتح الحزمة
افتح القفل للوصول البطاقات البالغ عددها 298 في هذه المجموعة.
فتح الحزمة
k this deck
39
Telemarketing Sales and Experience
The general manager of a telemarketing company believes that experience is the most important factor in determining the level of success of a telemarketer.To examine this belief she records last month's sales (in $1,000s) and the years of experience of 10 randomly selected telemarketers.These data are listed below.
-{Telemarketer Sales and Experience Narrative} Compute the standardized residuals.
فتح الحزمة
افتح القفل للوصول البطاقات البالغ عددها 298 في هذه المجموعة.
فتح الحزمة
k this deck
40
Game Winnings & Education
An ardent fan of television game shows has observed that, in general, the more educated the contestant, the less money he or she wins.To test her belief she gathers data about the last eight winners of her favorite game show.She records their winnings in dollars and the number of years of education.The results are as follows.
{Game Winnings & Education Narrative} Use the regression equation to determine the predicted values of y.
An ardent fan of television game shows has observed that, in general, the more educated the contestant, the less money he or she wins.To test her belief she gathers data about the last eight winners of her favorite game show.She records their winnings in dollars and the number of years of education.The results are as follows.
{Game Winnings & Education Narrative} Use the regression equation
to determine the predicted values of y. فتح الحزمة
افتح القفل للوصول البطاقات البالغ عددها 298 في هذه المجموعة.
فتح الحزمة
k this deck
41
Oil Quality and Price
Quality of oil is measured in API gravity degrees--the higher the degrees API, the higher the quality.The table shown below is produced by an expert in the field who believes that there is a relationship between quality and price per barrel.
A partial Minitab output follows:
{Oil Quality and Price Narrative} Use the regression equation to determine the predicted values of y.
Quality of oil is measured in API gravity degrees--the higher the degrees API, the higher the quality.The table shown below is produced by an expert in the field who believes that there is a relationship between quality and price per barrel.
A partial Minitab output follows: {Oil Quality and Price Narrative} Use the regression equation
to determine the predicted values of y. فتح الحزمة
افتح القفل للوصول البطاقات البالغ عددها 298 في هذه المجموعة.
فتح الحزمة
k this deck
42
A regression analysis between weight (y in pounds) and height (x in inches) resulted in the following least squares line: .This implies that if the height is increased by 1 inch, the weight is expected to increase by an average of 6 pounds.
.This implies that if the height is increased by 1 inch, the weight is expected to increase by an average of 6 pounds. فتح الحزمة
افتح القفل للوصول البطاقات البالغ عددها 298 في هذه المجموعة.
فتح الحزمة
k this deck
43
Marc Anthony Concert
At a recent Marc Anthony concert, a survey was conducted that asked a random sample of 20 people their age and how many concerts they have attended since the first of the year.The following data were collected:
An Excel output follows:
{Marc Anthony Concert Narrative} Draw a histogram of the residuals.
At a recent Marc Anthony concert, a survey was conducted that asked a random sample of 20 people their age and how many concerts they have attended since the first of the year.The following data were collected:
An Excel output follows: {Marc Anthony Concert Narrative} Draw a histogram of the residuals.
فتح الحزمة
افتح القفل للوصول البطاقات البالغ عددها 298 في هذه المجموعة.
فتح الحزمة
k this deck
44
A simple linear regression equation is given by .The point estimate of y when x = 4 is 20.45.
.The point estimate of y when x = 4 is 20.45. فتح الحزمة
افتح القفل للوصول البطاقات البالغ عددها 298 في هذه المجموعة.
فتح الحزمة
k this deck
45
A direct relationship between an independent variable x and a dependent variably y means that the variables x and y increase or decrease together.
فتح الحزمة
افتح القفل للوصول البطاقات البالغ عددها 298 في هذه المجموعة.
فتح الحزمة
k this deck
46
Oil Quality and Price
Quality of oil is measured in API gravity degrees--the higher the degrees API, the higher the quality.The table shown below is produced by an expert in the field who believes that there is a relationship between quality and price per barrel.
A partial Minitab output follows:
{Oil Quality and Price Narrative} Does it appear that the errors are normally distributed? Explain.
Quality of oil is measured in API gravity degrees--the higher the degrees API, the higher the quality.The table shown below is produced by an expert in the field who believes that there is a relationship between quality and price per barrel.
A partial Minitab output follows: {Oil Quality and Price Narrative} Does it appear that the errors are normally distributed? Explain.
فتح الحزمة
افتح القفل للوصول البطاقات البالغ عددها 298 في هذه المجموعة.
فتح الحزمة
k this deck
47
Oil Quality and Price
Quality of oil is measured in API gravity degrees--the higher the degrees API, the higher the quality.The table shown below is produced by an expert in the field who believes that there is a relationship between quality and price per barrel.
A partial Minitab output follows:
-{Oil Quality and Price Narrative} Use the predicted values and the actual values of y to calculate the residuals.
Quality of oil is measured in API gravity degrees--the higher the degrees API, the higher the quality.The table shown below is produced by an expert in the field who believes that there is a relationship between quality and price per barrel.
A partial Minitab output follows: -{Oil Quality and Price Narrative} Use the predicted values and the actual values of y to calculate the residuals.
فتح الحزمة
افتح القفل للوصول البطاقات البالغ عددها 298 في هذه المجموعة.
فتح الحزمة
k this deck
48
A regression analysis between sales (in $) and advertising (in $) resulted in the following least squares line: .This implies that an increase of $1 in advertising is associated with an increase of $60 in sales.
.This implies that an increase of $1 in advertising is associated with an increase of $60 in sales. فتح الحزمة
افتح القفل للوصول البطاقات البالغ عددها 298 في هذه المجموعة.
فتح الحزمة
k this deck
49
Oil Quality and Price
Quality of oil is measured in API gravity degrees--the higher the degrees API, the higher the quality.The table shown below is produced by an expert in the field who believes that there is a relationship between quality and price per barrel.
A partial Minitab output follows:
{Oil Quality and Price Narrative} Identify possible outliers.
Quality of oil is measured in API gravity degrees--the higher the degrees API, the higher the quality.The table shown below is produced by an expert in the field who believes that there is a relationship between quality and price per barrel.
A partial Minitab output follows: {Oil Quality and Price Narrative} Identify possible outliers.
فتح الحزمة
افتح القفل للوصول البطاقات البالغ عددها 298 في هذه المجموعة.
فتح الحزمة
k this deck
50
The method of least squares requires that the sum of the squared deviations between actual y values in the scatter diagram and y values predicted by the regression line be minimized.
فتح الحزمة
افتح القفل للوصول البطاقات البالغ عددها 298 في هذه المجموعة.
فتح الحزمة
k this deck
51
Oil Quality and Price
Quality of oil is measured in API gravity degrees--the higher the degrees API, the higher the quality.The table shown below is produced by an expert in the field who believes that there is a relationship between quality and price per barrel.
A partial Minitab output follows:
{Oil Quality and Price Narrative} Plot the residuals against the predicted values .
Quality of oil is measured in API gravity degrees--the higher the degrees API, the higher the quality.The table shown below is produced by an expert in the field who believes that there is a relationship between quality and price per barrel.
A partial Minitab output follows: {Oil Quality and Price Narrative} Plot the residuals against the predicted values
. فتح الحزمة
افتح القفل للوصول البطاقات البالغ عددها 298 في هذه المجموعة.
فتح الحزمة
k this deck
52
Marc Anthony Concert
At a recent Marc Anthony concert, a survey was conducted that asked a random sample of 20 people their age and how many concerts they have attended since the first of the year.The following data were collected:
An Excel output follows:
{Marc Anthony Concert Narrative} Does it appear that the errors are normally distributed? Explain.
At a recent Marc Anthony concert, a survey was conducted that asked a random sample of 20 people their age and how many concerts they have attended since the first of the year.The following data were collected:
An Excel output follows: {Marc Anthony Concert Narrative} Does it appear that the errors are normally distributed? Explain.
فتح الحزمة
افتح القفل للوصول البطاقات البالغ عددها 298 في هذه المجموعة.
فتح الحزمة
k this deck
53
The vertical spread of the data points about the regression line is measured by the y-intercept.
فتح الحزمة
افتح القفل للوصول البطاقات البالغ عددها 298 في هذه المجموعة.
فتح الحزمة
k this deck
54
Marc Anthony Concert
At a recent Marc Anthony concert, a survey was conducted that asked a random sample of 20 people their age and how many concerts they have attended since the first of the year.The following data were collected:
An Excel output follows:
{Marc Anthony Concert Narrative} Identify possible outliers.
At a recent Marc Anthony concert, a survey was conducted that asked a random sample of 20 people their age and how many concerts they have attended since the first of the year.The following data were collected:
An Excel output follows: {Marc Anthony Concert Narrative} Identify possible outliers.
فتح الحزمة
افتح القفل للوصول البطاقات البالغ عددها 298 في هذه المجموعة.
فتح الحزمة
k this deck
55
Marc Anthony Concert
At a recent Marc Anthony concert, a survey was conducted that asked a random sample of 20 people their age and how many concerts they have attended since the first of the year.The following data were collected:
An Excel output follows:
-{Marc Anthony Concert Narrative} Use the residuals to compute the standardized residuals.
At a recent Marc Anthony concert, a survey was conducted that asked a random sample of 20 people their age and how many concerts they have attended since the first of the year.The following data were collected:
An Excel output follows: -{Marc Anthony Concert Narrative} Use the residuals to compute the standardized residuals.
فتح الحزمة
افتح القفل للوصول البطاقات البالغ عددها 298 في هذه المجموعة.
فتح الحزمة
k this deck
56
Oil Quality and Price
Quality of oil is measured in API gravity degrees--the higher the degrees API, the higher the quality.The table shown below is produced by an expert in the field who believes that there is a relationship between quality and price per barrel.
A partial Minitab output follows:
{Oil Quality and Price Narrative} Draw a histogram of the residuals.
Quality of oil is measured in API gravity degrees--the higher the degrees API, the higher the quality.The table shown below is produced by an expert in the field who believes that there is a relationship between quality and price per barrel.
A partial Minitab output follows: {Oil Quality and Price Narrative} Draw a histogram of the residuals.
فتح الحزمة
افتح القفل للوصول البطاقات البالغ عددها 298 في هذه المجموعة.
فتح الحزمة
k this deck
57
Oil Quality and Price
Quality of oil is measured in API gravity degrees--the higher the degrees API, the higher the quality.The table shown below is produced by an expert in the field who believes that there is a relationship between quality and price per barrel.
A partial Minitab output follows:
{Oil Quality and Price Narrative} Does it appear that heteroscedasticity is a problem? Explain.
Quality of oil is measured in API gravity degrees--the higher the degrees API, the higher the quality.The table shown below is produced by an expert in the field who believes that there is a relationship between quality and price per barrel.
A partial Minitab output follows: {Oil Quality and Price Narrative} Does it appear that heteroscedasticity is a problem? Explain.
فتح الحزمة
افتح القفل للوصول البطاقات البالغ عددها 298 في هذه المجموعة.
فتح الحزمة
k this deck
58
Oil Quality and Price
Quality of oil is measured in API gravity degrees--the higher the degrees API, the higher the quality.The table shown below is produced by an expert in the field who believes that there is a relationship between quality and price per barrel.
A partial Minitab output follows:
-{Oil Quality and Price Narrative} Use the residuals to compute the standardized residuals.
Quality of oil is measured in API gravity degrees--the higher the degrees API, the higher the quality.The table shown below is produced by an expert in the field who believes that there is a relationship between quality and price per barrel.
A partial Minitab output follows: -{Oil Quality and Price Narrative} Use the residuals to compute the standardized residuals.
فتح الحزمة
افتح القفل للوصول البطاقات البالغ عددها 298 في هذه المجموعة.
فتح الحزمة
k this deck
59
Another name for the residual term in a regression equation is random error.
فتح الحزمة
افتح القفل للوصول البطاقات البالغ عددها 298 في هذه المجموعة.
فتح الحزمة
k this deck
60
An inverse relationship between an independent variable x and a dependent variably y means that as x increases, y decreases, and vice versa.
فتح الحزمة
افتح القفل للوصول البطاقات البالغ عددها 298 في هذه المجموعة.
فتح الحزمة
k this deck
61
If an estimated regression line has a y-intercept of 10 and a slope of 4, then when x = 2 the actual value of y is:
A) 18
B) 15
C) 14
D) unknown.
A) 18
B) 15
C) 14
D) unknown.
فتح الحزمة
افتح القفل للوصول البطاقات البالغ عددها 298 في هذه المجموعة.
فتح الحزمة
k this deck
62
In the simple linear regression model, the slope represents the:
A) value of y when x = 0.
B) average change in y per unit change in x.
C) value of x when y = 0.
D) average change in x per unit change in y.
A) value of y when x = 0.
B) average change in y per unit change in x.
C) value of x when y = 0.
D) average change in x per unit change in y.
فتح الحزمة
افتح القفل للوصول البطاقات البالغ عددها 298 في هذه المجموعة.
فتح الحزمة
k this deck
63
The regression line has been fitted to the data points (4, 8), (2, 5), and (1, 2).The sum of the squared residuals will be:
A) 7
B) 15
C) 8
D) 22
has been fitted to the data points (4, 8), (2, 5), and (1, 2).The sum of the squared residuals will be:A) 7
B) 15
C) 8
D) 22
فتح الحزمة
افتح القفل للوصول البطاقات البالغ عددها 298 في هذه المجموعة.
فتح الحزمة
k this deck
64
A regression analysis between sales (in $1,000) and advertising (in $1,000) resulted in the following least squares line: .This implies that:
A) as advertising increases by $1,000, sales increases by $5,000.
B) as advertising increases by $1,000, sales increases by $80,000.
C) as advertising increases by $5, sales increases by $80.
D) None of these choices.
.This implies that:A) as advertising increases by $1,000, sales increases by $5,000.
B) as advertising increases by $1,000, sales increases by $80,000.
C) as advertising increases by $5, sales increases by $80.
D) None of these choices.
فتح الحزمة
افتح القفل للوصول البطاقات البالغ عددها 298 في هذه المجموعة.
فتح الحزمة
k this deck
65
A regression analysis between sales (in $1000) and advertising (in $100) resulted in the following least squares line: .This implies that if advertising is $800, then the predicted amount of sales (in dollars) is:
A) $4875
B) $123,000
C) $487,500
D) $12,300
.This implies that if advertising is $800, then the predicted amount of sales (in dollars) is:A) $4875
B) $123,000
C) $487,500
D) $12,300
فتح الحزمة
افتح القفل للوصول البطاقات البالغ عددها 298 في هذه المجموعة.
فتح الحزمة
k this deck
66
The residuals are observations of the error variable https://d2lvgg3v3hfg70.cloudfront.net/TB7453/.Consequently, the minimized sum of squared deviations is called the sum of squares for error, denoted SSE.
.Consequently, the minimized sum of squared deviations is called the sum of squares for error, denoted SSE. فتح الحزمة
افتح القفل للوصول البطاقات البالغ عددها 298 في هذه المجموعة.
فتح الحزمة
k this deck
67
The first-order linear model is sometimes called the simple linear regression model.
فتح الحزمة
افتح القفل للوصول البطاقات البالغ عددها 298 في هذه المجموعة.
فتح الحزمة
k this deck
68
In regression analysis, the residuals represent the:
A) difference between the actual y values and their predicted values.
B) difference between the actual x values and their predicted values.
C) square root of the slope of the regression line.
D) change in y per unit change in x.
A) difference between the actual y values and their predicted values.
B) difference between the actual x values and their predicted values.
C) square root of the slope of the regression line.
D) change in y per unit change in x.
فتح الحزمة
افتح القفل للوصول البطاقات البالغ عددها 298 في هذه المجموعة.
فتح الحزمة
k this deck
69
In the first order linear regression model, the population parameters of the y-intercept and the slope are estimated, respectively, by:
A) b0 and b1
B) b0 and 1
C) 0 and b1
D) 0 and 1
A) b0 and b1
B) b0 and 1
C) 0 and b1
D) 0 and 1
فتح الحزمة
افتح القفل للوصول البطاقات البالغ عددها 298 في هذه المجموعة.
فتح الحزمة
k this deck
70
The residual ri is defined as the difference between the actual value yi and the estimated value .
. فتح الحزمة
افتح القفل للوصول البطاقات البالغ عددها 298 في هذه المجموعة.
فتح الحزمة
k this deck
71
To create a deterministic model, we start with a probabilistic model that approximates the relationship we want to model.
فتح الحزمة
افتح القفل للوصول البطاقات البالغ عددها 298 في هذه المجموعة.
فتح الحزمة
k this deck
72
Given the least squares regression line :
A) the relationship between x and y is positive.
B) the relationship between x and y is negative.
C) as x decreases, so does y.
D) None of these choices.
:A) the relationship between x and y is positive.
B) the relationship between x and y is negative.
C) as x decreases, so does y.
D) None of these choices.
فتح الحزمة
افتح القفل للوصول البطاقات البالغ عددها 298 في هذه المجموعة.
فتح الحزمة
k this deck
73
A regression analysis between weight (y in pounds) and height (x in inches) resulted in the following least squares line: .This implies that if the height is increased by 1 inch, the weight, on average, is expected to:
A) increase by 1 pound.
B) decrease by 1 pound.
C) increase by 5 pounds.
D) increase by 24 pounds.
.This implies that if the height is increased by 1 inch, the weight, on average, is expected to:A) increase by 1 pound.
B) decrease by 1 pound.
C) increase by 5 pounds.
D) increase by 24 pounds.
فتح الحزمة
افتح القفل للوصول البطاقات البالغ عددها 298 في هذه المجموعة.
فتح الحزمة
k this deck
74
The regression line has been fitted to the data points (4, 11), (2, 7), and (1, 5).The sum of squares for error will be 10.0.
has been fitted to the data points (4, 11), (2, 7), and (1, 5).The sum of squares for error will be 10.0. فتح الحزمة
افتح القفل للوصول البطاقات البالغ عددها 298 في هذه المجموعة.
فتح الحزمة
k this deck
75
Which of the following techniques is used to predict the value of one variable on the basis of other variables?
A) Correlation analysis
B) Coefficient of correlation
C) Covariance
D) Regression analysis
A) Correlation analysis
B) Coefficient of correlation
C) Covariance
D) Regression analysis
فتح الحزمة
افتح القفل للوصول البطاقات البالغ عددها 298 في هذه المجموعة.
فتح الحزمة
k this deck
76
If cov(x, y) = 7.5075 and , then the sample slope coefficient is 2.145.
, then the sample slope coefficient is 2.145. فتح الحزمة
افتح القفل للوصول البطاقات البالغ عددها 298 في هذه المجموعة.
فتح الحزمة
k this deck
77
In the simple linear regression model, the y-intercept represents the:
A) change in y per unit change in x.
B) change in x per unit change in y.
C) value of y when x = 0.
D) value of x when y = 0.
A) change in y per unit change in x.
B) change in x per unit change in y.
C) value of y when x = 0.
D) value of x when y = 0.
فتح الحزمة
افتح القفل للوصول البطاقات البالغ عددها 298 في هذه المجموعة.
فتح الحزمة
k this deck
78
A regression analysis between sales (in $1000) and advertising (in $100) resulted in the following least squares line: .This implies that if advertising is $600, then the predicted amount of sales (in dollars) is $125,000.
.This implies that if advertising is $600, then the predicted amount of sales (in dollars) is $125,000. فتح الحزمة
افتح القفل للوصول البطاقات البالغ عددها 298 في هذه المجموعة.
فتح الحزمة
k this deck
79
Statisticians have shown that sample y-intercept b0 and sample slope coefficient b1 are unbiased estimators of the population regression parameters 0 and 1, respectively.
فتح الحزمة
افتح القفل للوصول البطاقات البالغ عددها 298 في هذه المجموعة.
فتح الحزمة
k this deck
80
The residual is defined as the difference between:
A) the actual value of y and the estimated value of y
B) the actual value of x and the estimated value of x
C) the actual value of y and the estimated value of x
D) the actual value of x and the estimated value of y
A) the actual value of y and the estimated value of y
B) the actual value of x and the estimated value of x
C) the actual value of y and the estimated value of x
D) the actual value of x and the estimated value of y
فتح الحزمة
افتح القفل للوصول البطاقات البالغ عددها 298 في هذه المجموعة.
فتح الحزمة
k this deck
فتح الحزمة
افتح القفل للوصول البطاقات البالغ عددها 298 في هذه المجموعة.


