Deck 3: Modeling and Solving Lp Problems in a Spreadsheet
ملء الشاشة (f)
سؤال
سؤال
سؤال
سؤال
سؤال
سؤال
سؤال
سؤال
سؤال
سؤال
سؤال
سؤال
سؤال
سؤال
سؤال
سؤال
سؤال
سؤال
سؤال
سؤال
سؤال
سؤال
Exhibit 3.1
The following questions are based on this problem and accompanying Excel windows.
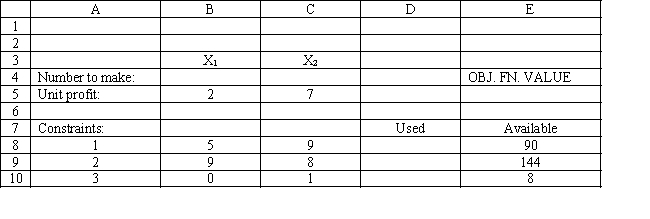
Jones Furniture Company produces beds and desks for college students. The production process requires carpentry and varnishing. Each bed requires 6 hours of carpentry and 4 hour of varnishing. Each desk requires 4 hours of carpentry and 8 hours of varnishing. There are 36 hours of carpentry time and 40 hours of varnishing time available. Beds generate $30 of profit and desks generate $40 of profit. Demand for desks is limited, so at most 8 will be produced.
Let
The LP model for the problem is
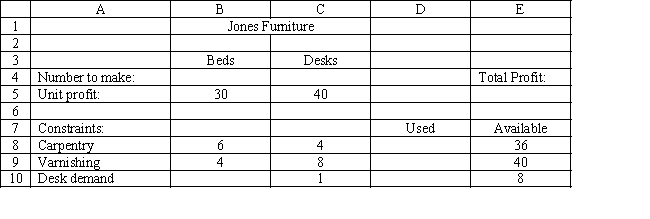
-Refer to Exhibit 3.1. What formula should be entered in cell E5 in the accompanying Excel spreadsheet to compute total profit?
A) =B4*B5+C4*C5
B) =SUMPRODUCT(B8:C8,$B$4:$C$4)
C) =SUM(B5:C5)
D) =SUM(E8:E10)
The following questions are based on this problem and accompanying Excel windows.
Jones Furniture Company produces beds and desks for college students. The production process requires carpentry and varnishing. Each bed requires 6 hours of carpentry and 4 hour of varnishing. Each desk requires 4 hours of carpentry and 8 hours of varnishing. There are 36 hours of carpentry time and 40 hours of varnishing time available. Beds generate $30 of profit and desks generate $40 of profit. Demand for desks is limited, so at most 8 will be produced.
Let
The LP model for the problem is
-Refer to Exhibit 3.1. What formula should be entered in cell E5 in the accompanying Excel spreadsheet to compute total profit?
A) =B4*B5+C4*C5
B) =SUMPRODUCT(B8:C8,$B$4:$C$4)
C) =SUM(B5:C5)
D) =SUM(E8:E10)
سؤال
Exhibit 3.1
The following questions are based on this problem and accompanying Excel windows.
Jones Furniture Company produces beds and desks for college students. The production process requires carpentry and varnishing. Each bed requires 6 hours of carpentry and 4 hour of varnishing. Each desk requires 4 hours of carpentry and 8 hours of varnishing. There are 36 hours of carpentry time and 40 hours of varnishing time available. Beds generate $30 of profit and desks generate $40 of profit. Demand for desks is limited, so at most 8 will be produced.
Let
The LP model for the problem is
-Refer to Exhibit 3.1. Which of the following statements represent the carpentry, varnishing and limited demand for desks constraints?
A) B4:C4 B5:C5
B) E5 0
C) D8:D10 E8:E10
D) E8:E10 D8:D10
سؤال
Exhibit 3.1
The following questions are based on this problem and accompanying Excel windows.
Jones Furniture Company produces beds and desks for college students. The production process requires carpentry and varnishing. Each bed requires 6 hours of carpentry and 4 hour of varnishing. Each desk requires 4 hours of carpentry and 8 hours of varnishing. There are 36 hours of carpentry time and 40 hours of varnishing time available. Beds generate $30 of profit and desks generate $40 of profit. Demand for desks is limited, so at most 8 will be produced.
Let
The LP model for the problem is
-Refer to Exhibit 3.1. Which cells should be changing cells in this problem?
A) B4:C4
B) E5
C) D8:D10
D) E8:E10
سؤال
Exhibit 3.3
The following questions are based on this problem and accompanying Excel windows.
Jack's distillery blends scotches for local bars and saloons. One of his customers has requested a special blend of scotch targeted as a bar scotch. The customer wants the blend to involve two scotch products, call them A and B. Product A is a higher quality scotch while product B is a cheaper brand. The customer wants to make the claim the blend is closer to high quality than the alternative. The customer wants 50 1500 ml bottles of the blend. Each bottle must contain at least 48% of Product A and at least 500 ml of B. The customer also specified that the blend have an alcohol content of at least 85%. Product A contains 95% alcohol while product B contains 78%. The blend is sold for $12.50 per bottle. Product A costs $7 per liter and product B costs $3 per liter. The company wants to determine the blend that will meet the customer's requirements and maximize profit.
Let Number of liters of product in total blend delivered
Number of liters of product in total blend delivered
MIN:
Subject to: (Total liters of mix)
minimum)
minimum)
(85\% alcohol minimum)
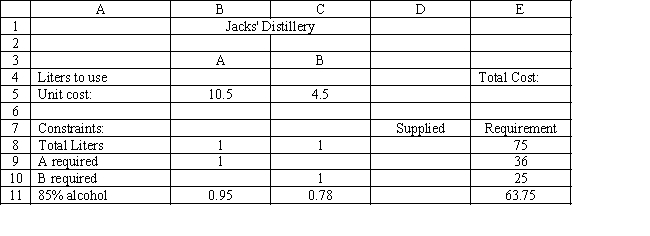
-Refer to Exhibit 3.3. What formula should be entered in cell E5 in the accompanying Excel spreadsheet to compute total cost?
A) =B4*C4+B5*C5
B) =SUMPRODUCT(B4:C4,B5:C5)
C) =SUM(B5:C5)
D) =SUM(E8:E10)
The following questions are based on this problem and accompanying Excel windows.
Jack's distillery blends scotches for local bars and saloons. One of his customers has requested a special blend of scotch targeted as a bar scotch. The customer wants the blend to involve two scotch products, call them A and B. Product A is a higher quality scotch while product B is a cheaper brand. The customer wants to make the claim the blend is closer to high quality than the alternative. The customer wants 50 1500 ml bottles of the blend. Each bottle must contain at least 48% of Product A and at least 500 ml of B. The customer also specified that the blend have an alcohol content of at least 85%. Product A contains 95% alcohol while product B contains 78%. The blend is sold for $12.50 per bottle. Product A costs $7 per liter and product B costs $3 per liter. The company wants to determine the blend that will meet the customer's requirements and maximize profit.
Let Number of liters of product in total blend delivered
Number of liters of product in total blend delivered
MIN:
Subject to: (Total liters of mix)
minimum)
minimum)
(85\% alcohol minimum)
-Refer to Exhibit 3.3. What formula should be entered in cell E5 in the accompanying Excel spreadsheet to compute total cost?
A) =B4*C4+B5*C5
B) =SUMPRODUCT(B4:C4,B5:C5)
C) =SUM(B5:C5)
D) =SUM(E8:E10)
سؤال
سؤال
سؤال
سؤال
سؤال
Exhibit 3.1
The following questions are based on this problem and accompanying Excel windows.
Jones Furniture Company produces beds and desks for college students. The production process requires carpentry and varnishing. Each bed requires 6 hours of carpentry and 4 hour of varnishing. Each desk requires 4 hours of carpentry and 8 hours of varnishing. There are 36 hours of carpentry time and 40 hours of varnishing time available. Beds generate $30 of profit and desks generate $40 of profit. Demand for desks is limited, so at most 8 will be produced.
Let
The LP model for the problem is
-Refer to Exhibit 3.1. What formula should be entered in cell D8 in the accompanying Excel spreadsheet to compute the amount of carpentry used?
A) =B4*B5+C4*C5
B) =SUMPRODUCT(B8:C8,$B$4:$C$4)
C) =SUM(B5:C5)
D) =SUM(E8:E10)
سؤال
سؤال
سؤال
سؤال
Exhibit 3.1
The following questions are based on this problem and accompanying Excel windows.
Jones Furniture Company produces beds and desks for college students. The production process requires carpentry and varnishing. Each bed requires 6 hours of carpentry and 4 hour of varnishing. Each desk requires 4 hours of carpentry and 8 hours of varnishing. There are 36 hours of carpentry time and 40 hours of varnishing time available. Beds generate $30 of profit and desks generate $40 of profit. Demand for desks is limited, so at most 8 will be produced.
Let
The LP model for the problem is
-Refer to Exhibit 3.1. Which cells should be the constraint cells in this problem?
A) B4:C4
B) E5
C) D8:D10
D) E8:E10
سؤال
سؤال
سؤال
سؤال
سؤال
سؤال
سؤال
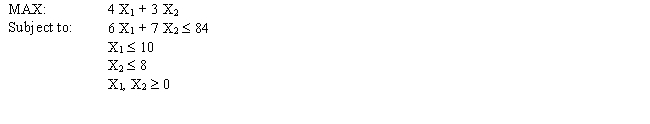
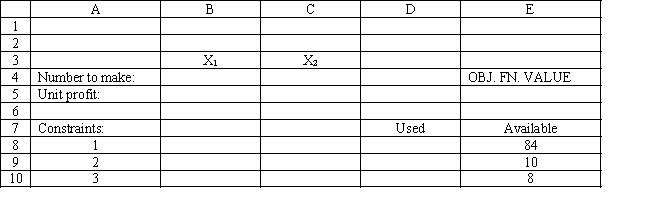
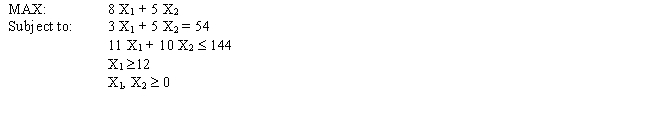
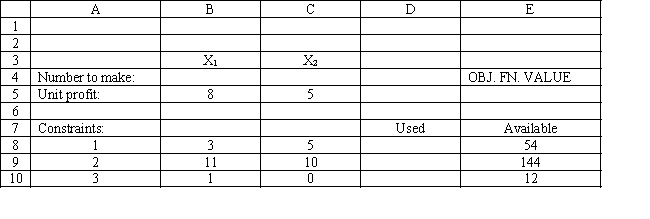
You have been given the following linear programming model and Excel spreadsheet to solve this problem. What numbers should be entered into cells B5:C5 and B8:C10 to implement this model?
سؤال
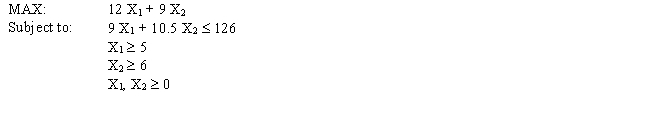
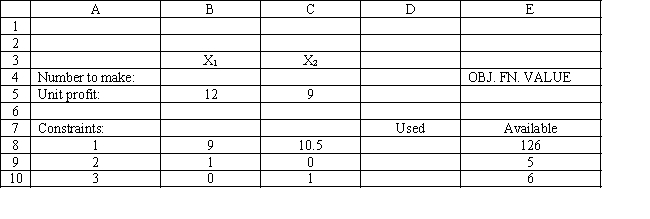
You have been given the following linear programming model and Excel spreadsheet to solve this problem. What formulas should be entered into cells E5 and D8:D10 to implement this model?

سؤال
Exhibit 3.4
The following questions are based on this problem and accompanying Excel windows.
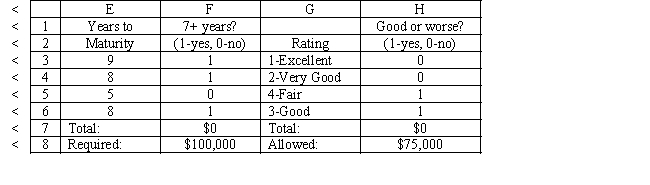
A financial planner wants to design a portfolio of investments for a client. The client has $300,000 to invest and the planner has identified four investment options for the money. The following requirements have been placed on the planner. No more than 25% of the money in any one investment, at least one third should be invested in long-term bonds which mature in seven or more years, and no more than 25% of the total money should be invested in C or D since they are riskier investments. The planner has developed the following LP model based on the data in this table and the requirements of the client. The objective is to maximize the total return of the portfolio.
Let
MAX:
Subject to:
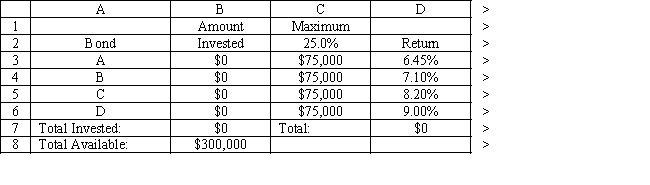
-Refer to Exhibit 3.4. What formula should be entered in cell B7 in the accompanying Excel spreadsheet to compute total dollars invested?
A) =ADD(B3:B6)
B) =SUM(B3:B6)
C) =TOTAL(B3:B6)
D) =TALLY(B3:B6)
The following questions are based on this problem and accompanying Excel windows.
A financial planner wants to design a portfolio of investments for a client. The client has $300,000 to invest and the planner has identified four investment options for the money. The following requirements have been placed on the planner. No more than 25% of the money in any one investment, at least one third should be invested in long-term bonds which mature in seven or more years, and no more than 25% of the total money should be invested in C or D since they are riskier investments. The planner has developed the following LP model based on the data in this table and the requirements of the client. The objective is to maximize the total return of the portfolio.
Let
MAX:
Subject to:
-Refer to Exhibit 3.4. What formula should be entered in cell B7 in the accompanying Excel spreadsheet to compute total dollars invested?
A) =ADD(B3:B6)
B) =SUM(B3:B6)
C) =TOTAL(B3:B6)
D) =TALLY(B3:B6)
سؤال
سؤال
سؤال
سؤال
You have been given the following linear programming model and Excel spreadsheet to solve this problem. What formulas should be entered into cells E5 and D8:D10 to implement this model?


سؤال
You have been given the following linear programming model and Excel spreadsheet to solve this problem. What cell references would you enter in the Risk Solver Platform (RSP) task pane for the following?
Objective Cell:
Variables Cells:
Constraints Cells:

Objective Cell:
Variables Cells:
Constraints Cells:
سؤال
Exhibit 3.4
The following questions are based on this problem and accompanying Excel windows.
A financial planner wants to design a portfolio of investments for a client. The client has $300,000 to invest and the planner has identified four investment options for the money. The following requirements have been placed on the planner. No more than 25% of the money in any one investment, at least one third should be invested in long-term bonds which mature in seven or more years, and no more than 25% of the total money should be invested in C or D since they are riskier investments. The planner has developed the following LP model based on the data in this table and the requirements of the client. The objective is to maximize the total return of the portfolio.
Let
MAX:
Subject to:
-Refer to Exhibit 3.4. What formula should be entered in cell D7 in the accompanying Excel spreadsheet to compute the total return?
A) =B7*SUM(D3:D6)
B) =SUMPRODUCT(B3:B6,D3:D6)
C) =SUM(B3:B6)
D) =SUMPRODUCT(B3:E3,B6:E6)
سؤال
Exhibit 3.3
The following questions are based on this problem and accompanying Excel windows.
Jack's distillery blends scotches for local bars and saloons. One of his customers has requested a special blend of scotch targeted as a bar scotch. The customer wants the blend to involve two scotch products, call them A and B. Product A is a higher quality scotch while product B is a cheaper brand. The customer wants to make the claim the blend is closer to high quality than the alternative. The customer wants 50 1500 ml bottles of the blend. Each bottle must contain at least 48% of Product A and at least 500 ml of B. The customer also specified that the blend have an alcohol content of at least 85%. Product A contains 95% alcohol while product B contains 78%. The blend is sold for $12.50 per bottle. Product A costs $7 per liter and product B costs $3 per liter. The company wants to determine the blend that will meet the customer's requirements and maximize profit.
Let Number of liters of product in total blend delivered
Number of liters of product in total blend delivered
MIN:
Subject to: (Total liters of mix)
minimum)
minimum)
(85\% alcohol minimum)
-Refer to Exhibit 3.3. Which cells should be the constraint cells in this problem?
A) B4:C4
B) E5
C) D8:D11
D) E8:E10
سؤال
You have been given the following linear programming model and Excel spreadsheet to solve this problem. What cell references would you enter in the Risk Solver Platform (RSP) task pane for the following?
Objective Cell:
Variables Cells:
Constraints Cells:
Objective Cell:
Variables Cells:
Constraints Cells:
سؤال
You have been given the following linear programming model and Excel spreadsheet to solve this problem. What formulas should be entered into cells E5 and D8:D10 to implement this model?


سؤال
You have been given the following linear programming model and Excel spreadsheet to solve this problem. What numbers should be entered into cells B5:C5 and B8:C10 to implement this model?


سؤال
You have been given the following linear programming model and Excel spreadsheet to solve this problem. What numbers should be entered into cells B5:C5 and B8:C10 to implement this model?

سؤال
Exhibit 3.4
The following questions are based on this problem and accompanying Excel windows.
A financial planner wants to design a portfolio of investments for a client. The client has $300,000 to invest and the planner has identified four investment options for the money. The following requirements have been placed on the planner. No more than 25% of the money in any one investment, at least one third should be invested in long-term bonds which mature in seven or more years, and no more than 25% of the total money should be invested in C or D since they are riskier investments. The planner has developed the following LP model based on the data in this table and the requirements of the client. The objective is to maximize the total return of the portfolio.
Let
MAX:
Subject to:
-Refer to Exhibit 3.4. Which cells are changing cells in the accompanying Excel spreadsheet?
A) B3:B6
B) B7:I7
C) C7
D) E7
سؤال
Exhibit 3.3
The following questions are based on this problem and accompanying Excel windows.
Jack's distillery blends scotches for local bars and saloons. One of his customers has requested a special blend of scotch targeted as a bar scotch. The customer wants the blend to involve two scotch products, call them A and B. Product A is a higher quality scotch while product B is a cheaper brand. The customer wants to make the claim the blend is closer to high quality than the alternative. The customer wants 50 1500 ml bottles of the blend. Each bottle must contain at least 48% of Product A and at least 500 ml of B. The customer also specified that the blend have an alcohol content of at least 85%. Product A contains 95% alcohol while product B contains 78%. The blend is sold for $12.50 per bottle. Product A costs $7 per liter and product B costs $3 per liter. The company wants to determine the blend that will meet the customer's requirements and maximize profit.
Let Number of liters of product in total blend delivered
Number of liters of product in total blend delivered
MIN:
Subject to: (Total liters of mix)
minimum)
minimum)
(85\% alcohol minimum)
-Refer to Exhibit 3.3. What formula should be entered in cell D11 in the accompanying Excel spreadsheet to compute the total liters of alcohol supplied?
A) =B4*B5+C4*C5
B) =SUMPRODUCT(B11:C11,$B$4:$C$4)
C) =SUM(B5:C5)
D) =SUM(E8:E10)
سؤال
Exhibit 3.3
The following questions are based on this problem and accompanying Excel windows.
Jack's distillery blends scotches for local bars and saloons. One of his customers has requested a special blend of scotch targeted as a bar scotch. The customer wants the blend to involve two scotch products, call them A and B. Product A is a higher quality scotch while product B is a cheaper brand. The customer wants to make the claim the blend is closer to high quality than the alternative. The customer wants 50 1500 ml bottles of the blend. Each bottle must contain at least 48% of Product A and at least 500 ml of B. The customer also specified that the blend have an alcohol content of at least 85%. Product A contains 95% alcohol while product B contains 78%. The blend is sold for $12.50 per bottle. Product A costs $7 per liter and product B costs $3 per liter. The company wants to determine the blend that will meet the customer's requirements and maximize profit.
Let Number of liters of product in total blend delivered
Number of liters of product in total blend delivered
MIN:
Subject to: (Total liters of mix)
minimum)
minimum)
(85\% alcohol minimum)
-Refer to Exhibit 3.3. Which of the following statements could represent a constraint in this problem?
A) B4:C4 B5:C5
B) E5 0
C) D8 = E8
D) E8:E11 D8:D11
سؤال
Exhibit 3.3
The following questions are based on this problem and accompanying Excel windows.
Jack's distillery blends scotches for local bars and saloons. One of his customers has requested a special blend of scotch targeted as a bar scotch. The customer wants the blend to involve two scotch products, call them A and B. Product A is a higher quality scotch while product B is a cheaper brand. The customer wants to make the claim the blend is closer to high quality than the alternative. The customer wants 50 1500 ml bottles of the blend. Each bottle must contain at least 48% of Product A and at least 500 ml of B. The customer also specified that the blend have an alcohol content of at least 85%. Product A contains 95% alcohol while product B contains 78%. The blend is sold for $12.50 per bottle. Product A costs $7 per liter and product B costs $3 per liter. The company wants to determine the blend that will meet the customer's requirements and maximize profit.
Let Number of liters of product in total blend delivered
Number of liters of product in total blend delivered
MIN:
Subject to: (Total liters of mix)
minimum)
minimum)
(85\% alcohol minimum)
-Refer to Exhibit 3.3. Which cells should be changing cells in this problem?
A) B4:C4
B) E5
C) D8:D10
D) E8:E10
سؤال
سؤال
A company needs to purchase several new machines to meet its future production needs. It can purchase three different types of machines A, B, and C. Each machine A costs $80,000 and requires 2,000 square feet of floor space. Each machine B costs $50,000 and requires 3,000 square feet of floor space. Each machine C costs $40,000 and requires 5,000 square feet of floor space. The machines can produce 200, 250 and 350 units per day respectively. The plant can only afford $500,000 for all the machines and has at most 20,000 square feet of room for the machines. The company wants to buy as many machines as possible to maximize daily production.
What values would you enter in the Risk Solver Platform (RSP) task pane for the following cells for this Excel spreadsheet implementation of the formulation for this problem?
Objective Cell:
Variables Cells:
Constraints Cells:


What values would you enter in the Risk Solver Platform (RSP) task pane for the following cells for this Excel spreadsheet implementation of the formulation for this problem?
Objective Cell:
Variables Cells:
Constraints Cells:
سؤال
A financial planner wants to design a portfolio of investments for a client. The client has $400,000 to invest and the planner has identified four investment options for the money. The following requirements have been placed on the planner. No more than 30% of the money in any one investment, at least one half should be invested in long-term bonds which mature in six or more years, and no more than 40% of the total money should be invested in B or C since they are riskier investments. The planner has developed the following LP model based on the data in this table and the requirements of the client. The objective is to maximize the total return of the portfolio.


 What values would you enter in the Risk Solver Platform (RSP) task pane for the following cells for this Excel spreadsheet implementation of this problem?
Objective Cell:
Variables Cells:
Constraints Cells:
What values would you enter in the Risk Solver Platform (RSP) task pane for the following cells for this Excel spreadsheet implementation of this problem?Objective Cell:
Variables Cells:
Constraints Cells:
سؤال
A company needs to purchase several new machines to meet its future production needs. It can purchase three different types of machines A, B, and C. Each machine A costs $80,000 and requires 2,000 square feet of floor space. Each machine B costs $50,000 and requires 3,000 square feet of floor space. Each machine C costs $40,000 and requires 5,000 square feet of floor space. The machines can produce 200, 250 and 350 units per day respectively. The plant can only afford $500,000 for all the machines and has at most 20,000 square feet of room for the machines. The company wants to buy as many machines as possible to maximize daily production.
What are the key formulas for this Excel spreadsheet implementation of the following formulation?


What are the key formulas for this Excel spreadsheet implementation of the following formulation?
سؤال
A financial planner wants to design a portfolio of investments for a client. The client has $400,000 to invest and the planner has identified four investment options for the money. The following requirements have been placed on the planner. No more than 30% of the money in any one investment, at least one half should be invested in long-term bonds which mature in six or more years, and no more than 40% of the total money should be invested in B or C since they are riskier investments. The planner has developed the following LP model based on the data in this table and the requirements of the client. The objective is to maximize the total return of the portfolio.
 Formulate the LP for this problem.
Formulate the LP for this problem. سؤال
A financial planner wants to design a portfolio of investments for a client. The client has $400,000 to invest and the planner has identified four investment options for the money. The following requirements have been placed on the planner. No more than 30% of the money in any one investment, at least one half should be invested in long-term bonds which mature in six or more years, and no more than 40% of the total money should be invested in B or C since they are riskier investments. The planner has developed the following LP model based on the data in this table and the requirements of the client. The objective is to maximize the total return of the portfolio.


 What formulas are required for the following cells in the Excel spreadsheet implementation of the formulation?
B7
D7
F7
H7
What formulas are required for the following cells in the Excel spreadsheet implementation of the formulation?B7
D7
F7
H7
سؤال
A hospital needs to determine how many nurses to hire to cover a 24 hour period. The nurses must work 8 consecutive hours but can start work at the start of 6 different shifts. They are paid different wages depending on when they start their shifts. The number of nurses required per 4-hour time period and their wages are shown in the following table.
 Enter the numbers in the appropriate cells of ranges B6:G11 and B13:G13 in the Excel spreadsheet to solve this problem based on the following formulation.


Enter the numbers in the appropriate cells of ranges B6:G11 and B13:G13 in the Excel spreadsheet to solve this problem based on the following formulation. سؤال
سؤال
A company needs to purchase several new machines to meet its future production needs. It can purchase three different types of machines A, B, and C. Each machine A costs $80,000 and requires 2,000 square feet of floor space. Each machine B costs $50,000 and requires 3,000 square feet of floor space. Each machine C costs $40,000 and requires 5,000 square feet of floor space. The machines can produce 200, 250 and 350 units per day respectively. The plant can only afford $500,000 for all the machines and has at most 20,000 square feet of room for the machines. The company wants to buy as many machines as possible to maximize daily production.
Enter the numbers in the appropriate cells of range B5:F10 in the Excel spreadsheet to solve this problem based on the following formulation.


Enter the numbers in the appropriate cells of range B5:F10 in the Excel spreadsheet to solve this problem based on the following formulation.
سؤال
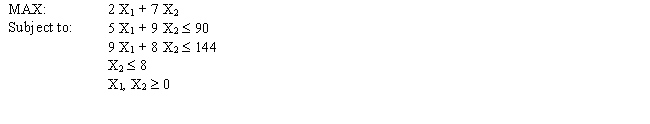
A farmer is planning his spring planting. He has 20 acres on which he can plant a combination of Corn, Pumpkins and Beans. He wants to maximize his profit but there is a limited demand for each crop. Each crop also requires fertilizer and irrigation water which are in short supply. The following table summarizes the data for the problem.
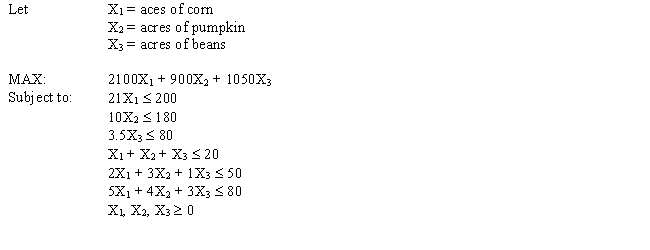
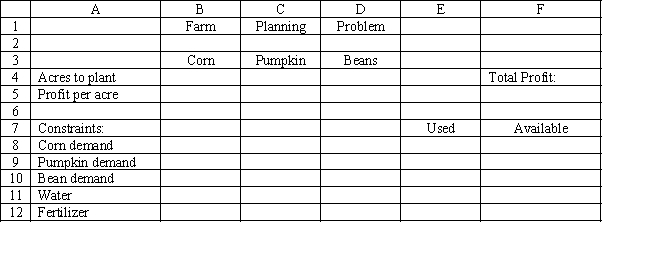
 What are the key formulas for this Excel spreadsheet implementation of the following formulation?


What are the key formulas for this Excel spreadsheet implementation of the following formulation? سؤال
A hospital needs to determine how many nurses to hire to cover a 24 hour period. The nurses must work 8 consecutive hours but can start work at the start of 6 different shifts. They are paid different wages depending on when they start their shifts. The number of nurses required per 4-hour time period and their wages are shown in the following table.
 What are the key formulas for this Excel spreadsheet implementation of the following formulation?


What are the key formulas for this Excel spreadsheet implementation of the following formulation? سؤال
Pete's Plastics manufactures plastic at plants in Miami, St. Louis and Cleveland. Pete needs to ship plastic to customers in Pittsburgh, Atlanta and Chicago. He wants to minimize the cost of shipping the plastic from his plants to his customers. The data for the problem is summarized in the following table.
 Formulate the LP for this problem.
Formulate the LP for this problem. سؤال
A farmer is planning his spring planting. He has 20 acres on which he can plant a combination of Corn, Pumpkins and Beans. He wants to maximize his profit but there is a limited demand for each crop. Each crop also requires fertilizer and irrigation water which are in short supply. There are only 50 acre ft of irrigation available and only 8,000 pounds/acre of fertilizer available. The following table summarizes the data for the problem.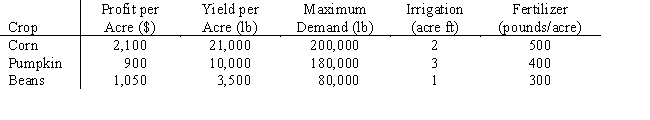
 Enter the numbers in the appropriate cells of ranges B12:D12 and E8:F12 in the Excel spreadsheet to solve this problem based on the following formulation.
Enter the numbers in the appropriate cells of ranges B12:D12 and E8:F12 in the Excel spreadsheet to solve this problem based on the following formulation. سؤال
Carlton construction is supplying building materials for a new mall construction project in Kansas. Their contract calls for a total of 250,000 tons of material to be delivered over a three-week period. Carlton's supply depot has access to three modes of transportation: a trucking fleet, railway delivery, and air cargo transport. Their contract calls for 120,000 tons delivered by the end of week one, 80% of the total delivered by the end of week two, and the entire amount delivered by the end of week three. Contracts in place with the transportation companies call for at least 45% of the total delivered be delivered by trucking, at least 40% of the total delivered be delivered by railway, and up to 15% of the total delivered be delivered by air cargo. Unfortunately, competing demands limit the availability of each mode of transportation each of the three weeks to the following levels (all in thousands of tons):
 Formulate an LP model for this logistics problem.
Formulate an LP model for this logistics problem. سؤال
سؤال
A hospital needs to determine how many nurses to hire to cover a 24 hour period. The nurses must work 8 consecutive hours but can start work at the start of 6 different shifts. They are paid different wages depending on when they start their shifts. The number of nurses required per 4-hour time period and their wages are shown in the following table.
 Formulate the LP for this problem.
Formulate the LP for this problem. سؤال
A company is planning production for the next 4 quarters. They want to minimize the cost of production. The production cost, demand and production capacity vary from quarter to quarter. The maximum amount of inventory which can be held is 100 units and management wants to keep at least 50 units on hand. Quarterly inventory holding cost is 4% of the cost of production. There are currently 50 units in inventory. The company wants to produce at no less than one half of its maximum capacity in any quarter.


 What formulas are required for cells D3, D6, D8, D15, D17 and D18 in the Excel spreadsheet implementation of the formulation?
What formulas are required for cells D3, D6, D8, D15, D17 and D18 in the Excel spreadsheet implementation of the formulation? سؤال
State Farm Supply has just received an order for 10,000 pounds of chicken feed. The farmer has specified certain that the feed meet minimum requirements for Protein, Carbohydrate, Fat and Vitamins. State Farm can blend four different feeds to produce the required mix. The farmer would like to pay the lowest possible price for the feed. The data for the problem is summarized in the following table.
 Formulate the LP for this problem.
Formulate the LP for this problem. سؤال
A grain store has six types of grain, each varying in cost, quality, and nutritional content. Periodically, excess inventory of these grains are consolidated into two local products, Feed-M-All and Supreme-Feed. Feed-M-All sells for $6.50 for a 10-pound bag while Supreme-Feed sells for $8.50 for a 10-pound bag. These feeds are advertised as having the following nutritional content:
 The component grains have the following content characteristics:
 Targets for Feed-M-All are a cost of $ 4.35 per 10-pound bag, a quality rating of 2.25, along with the minimum percentages of protein and fat, and the maximum percentage of carbohydrates. Similar targets are set for Supreme-Feed with cost set at $ 4.60 and quality at 2.45. There must be at least a 70%-30% mix among these two local feeds.
Formulate an LP model for this product mix problem.
The component grains have the following content characteristics: Targets for Feed-M-All are a cost of $ 4.35 per 10-pound bag, a quality rating of 2.25, along with the minimum percentages of protein and fat, and the maximum percentage of carbohydrates. Similar targets are set for Supreme-Feed with cost set at $ 4.60 and quality at 2.45. There must be at least a 70%-30% mix among these two local feeds.Formulate an LP model for this product mix problem.
سؤال
A hospital needs to determine how many nurses to hire to cover a 24 hour period. The nurses must work 8 consecutive hours but can start work at the start of 6 different shifts. They are paid different wages depending on when they start their shifts. The number of nurses required per 4-hour time period and their wages are shown in the following table.
 What values would you enter in the Risk Solver Platform (RSP) task pane for the following cells for this Excel spreadsheet implementation of the formulation for this problem?
Objective Cell:
Variables Cells:
Constraints Cells:


What values would you enter in the Risk Solver Platform (RSP) task pane for the following cells for this Excel spreadsheet implementation of the formulation for this problem?Objective Cell:
Variables Cells:
Constraints Cells:

فتح الحزمة
قم بالتسجيل لفتح البطاقات في هذه المجموعة!
Unlock Deck
Unlock Deck
1/88
العب
ملء الشاشة (f)
Deck 3: Modeling and Solving Lp Problems in a Spreadsheet
1
What does the Excel =SUMPRODUCT(A1:A5,C6;C10) command do?
A) Sums each range and multiplies the sums.
B) Sum each pair of cells and multiples each sum.
C) Multiplies the contents of cells containing the =SUM() command.
D) Multiplies each pair of cells and sums each product.
A) Sums each range and multiplies the sums.
B) Sum each pair of cells and multiples each sum.
C) Multiplies the contents of cells containing the =SUM() command.
D) Multiplies each pair of cells and sums each product.
D
2
An LP problem with a feasible region will have
A) an optimal solution at some interior point.
B) an optimal solution at some extreme point.
C) an optimal solution only at the origin.
D) an optimal solution at two interior points.
A) an optimal solution at some interior point.
B) an optimal solution at some extreme point.
C) an optimal solution only at the origin.
D) an optimal solution at two interior points.
B
3
The "Objective Sense" option in the Risk Solver Platform (RSP) task pane may be used to
A) return a heuristic solution to the problem.
B) tell the Solver what value it should seek for your optimization objective.
C) determine the value of the objective based on specified decision variable cells.
D) always works correctly.
A) return a heuristic solution to the problem.
B) tell the Solver what value it should seek for your optimization objective.
C) determine the value of the objective based on specified decision variable cells.
D) always works correctly.
B
4
In the Risk Solver Platform (RSP) dialog box simple upper and lower bounds for decision variables are specified by
A) referring directly to the decision variable cells in the Constraints-Bound area.
B) requiring the addition of the bounds above and below the variable cells.
C) resolving the problem with the bounds added.
D) incorporating the bounds in the objective function.
A) referring directly to the decision variable cells in the Constraints-Bound area.
B) requiring the addition of the bounds above and below the variable cells.
C) resolving the problem with the bounds added.
D) incorporating the bounds in the objective function.
فتح الحزمة
افتح القفل للوصول البطاقات البالغ عددها 88 في هذه المجموعة.
فتح الحزمة
k this deck
5
What action is required to make Risk Solver Platform (RSP) solve a specified problem?
A) Type go in cell A1.
B) Click the "Optimize" button on the RSP Ribbon, or the green arrow "Solve" in the Task Pane.
C) Click the Close button in the RSP Parameters dialog box.
D) Click the Guess button in the RSP Parameters dialog box.
A) Type go in cell A1.
B) Click the "Optimize" button on the RSP Ribbon, or the green arrow "Solve" in the Task Pane.
C) Click the Close button in the RSP Parameters dialog box.
D) Click the Guess button in the RSP Parameters dialog box.
فتح الحزمة
افتح القفل للوصول البطاقات البالغ عددها 88 في هذه المجموعة.
فتح الحزمة
k this deck
6
The constraints X1 0 and X2 0 are referred to as
A) positivity constraints.
B) optimality conditions.
C) left hand sides.
D) nonnegativity conditions.
A) positivity constraints.
B) optimality conditions.
C) left hand sides.
D) nonnegativity conditions.
فتح الحزمة
افتح القفل للوصول البطاقات البالغ عددها 88 في هذه المجموعة.
فتح الحزمة
k this deck
7
What command is used to add the contents of cells A1, A2 and A3?
A) =A1+A2+A3
B) =ADD(A1:A3)
C) =TOTAL(A1:A3)
D) =PRODUCT(A1:A3)
A) =A1+A2+A3
B) =ADD(A1:A3)
C) =TOTAL(A1:A3)
D) =PRODUCT(A1:A3)
فتح الحزمة
افتح القفل للوصول البطاقات البالغ عددها 88 في هذه المجموعة.
فتح الحزمة
k this deck
8
Which type of spreadsheet cell represents the decision variables in an LP model?
A) Target or set cell
B) Variable cell
C) Constraint cell
D) Constant cell
A) Target or set cell
B) Variable cell
C) Constraint cell
D) Constant cell
فتح الحزمة
افتح القفل للوصول البطاقات البالغ عددها 88 في هذه المجموعة.
فتح الحزمة
k this deck
9
The built-in Solver in Excel is found under which tab on the ribbon?
A) Tools
B) Insert
C) Data
D) Window
A) Tools
B) Insert
C) Data
D) Window
فتح الحزمة
افتح القفل للوصول البطاقات البالغ عددها 88 في هذه المجموعة.
فتح الحزمة
k this deck
10
Microsof Excel, Quattro Pro and Lotus 1-2-3 contain built-in optimizers called
A) what-if engines.
B) calculators.
C) solvers.
D) risk analyzers.
A) what-if engines.
B) calculators.
C) solvers.
D) risk analyzers.
فتح الحزمة
افتح القفل للوصول البطاقات البالغ عددها 88 في هذه المجموعة.
فتح الحزمة
k this deck
11
Which type of spreadsheet cell represents the objective function in an LP model?
A) Objective cell
B) Changing variable cell
C) Constraint cell
D) Constant cell
A) Objective cell
B) Changing variable cell
C) Constraint cell
D) Constant cell
فتح الحزمة
افتح القفل للوصول البطاقات البالغ عددها 88 في هذه المجموعة.
فتح الحزمة
k this deck
12
The English-reading eye scans
A) Right to left
B) Bottom to top
C) Left to Bottom
D) Left to right
A) Right to left
B) Bottom to top
C) Left to Bottom
D) Left to right
فتح الحزمة
افتح القفل للوصول البطاقات البالغ عددها 88 في هذه المجموعة.
فتح الحزمة
k this deck
13
Which command is equivalent to =SUMPRODUCT(A1:A3,B1:B3)?
A) =SUM(PRODUCT((A1:A3,B1:B3))
B) =PRODUCT(SUM((A1:A3,B1:B3))
C) =PRODUCT(A1+B1,A2+B2,A3+B3))
D) =A1*B1+A2*B2+A3*B3
A) =SUM(PRODUCT((A1:A3,B1:B3))
B) =PRODUCT(SUM((A1:A3,B1:B3))
C) =PRODUCT(A1+B1,A2+B2,A3+B3))
D) =A1*B1+A2*B2+A3*B3
فتح الحزمة
افتح القفل للوصول البطاقات البالغ عددها 88 في هذه المجموعة.
فتح الحزمة
k this deck
14
Which type of spreadsheet cell represents the left hand sides (LHS) formulas in an LP model?
A) Target or set cell
B) Changing variable cell
C) Constraint cell
D) Constant cell
A) Target or set cell
B) Changing variable cell
C) Constraint cell
D) Constant cell
فتح الحزمة
افتح القفل للوصول البطاقات البالغ عددها 88 في هذه المجموعة.
فتح الحزمة
k this deck
15
Models which are setup in an intuitively appealing, logical layout tend to be the most
A) Reliable
B) Modifiable
C) Auditable
D) Organized
A) Reliable
B) Modifiable
C) Auditable
D) Organized
فتح الحزمة
افتح القفل للوصول البطاقات البالغ عددها 88 في هذه المجموعة.
فتح الحزمة
k this deck
16
Numeric constants should be
A) embedded in formulas.
B) placed in individual cells
C) placed in separate workbooks.
D) entered manually every time a model is solved.
A) embedded in formulas.
B) placed in individual cells
C) placed in separate workbooks.
D) entered manually every time a model is solved.
فتح الحزمة
افتح القفل للوصول البطاقات البالغ عددها 88 في هذه المجموعة.
فتح الحزمة
k this deck
17
Which tab in the Risk Solver Platform (RSP) task pane is used to define an optimization problem?
A) Guess
B) Model
C) Change
D) Delete
A) Guess
B) Model
C) Change
D) Delete
فتح الحزمة
افتح القفل للوصول البطاقات البالغ عددها 88 في هذه المجموعة.
فتح الحزمة
k this deck
18
The "Objective Value of" option in the Risk Solver Platform (RSP) task pane may be used to
A) find a solution at a maximum value.
B) find a solution at a minimum value.
C) find a solution for a specific objective function value.
D) returns the best feasible solution.
A) find a solution at a maximum value.
B) find a solution at a minimum value.
C) find a solution for a specific objective function value.
D) returns the best feasible solution.
فتح الحزمة
افتح القفل للوصول البطاقات البالغ عددها 88 في هذه المجموعة.
فتح الحزمة
k this deck
19
The "Analyze Without Solving" tool in Risk Solver Platform (RSP) is useful for
A) verifying the equations in a spreadsheet model.
B) toggling between absolute and relative cell referencing.
C) executing the Excel spreadsheet layout Wizard.
D) naming cells and cell ranges for easier modifiability.
A) verifying the equations in a spreadsheet model.
B) toggling between absolute and relative cell referencing.
C) executing the Excel spreadsheet layout Wizard.
D) naming cells and cell ranges for easier modifiability.
فتح الحزمة
افتح القفل للوصول البطاقات البالغ عددها 88 في هذه المجموعة.
فتح الحزمة
k this deck
20
Spreadsheet modeling is an acquired skill because
A) there is generally only one correct way to build a model.
B) the spreadsheet is free-form providing many modeling options.
C) using Risk Solver Platform (RSP) requires lots of experience.
D) spreadsheets are not very easy to use.
A) there is generally only one correct way to build a model.
B) the spreadsheet is free-form providing many modeling options.
C) using Risk Solver Platform (RSP) requires lots of experience.
D) spreadsheets are not very easy to use.
فتح الحزمة
افتح القفل للوصول البطاقات البالغ عددها 88 في هذه المجموعة.
فتح الحزمة
k this deck
21
Scaling problems
A) can cause Risk Solver Platform (RSP) to consider a linear problem as nonlinear.
B) can cause problems in accuracy of solutions returned.
C) are caused by small numbers and large numbers used in the same problem.
D) all of these.
A) can cause Risk Solver Platform (RSP) to consider a linear problem as nonlinear.
B) can cause problems in accuracy of solutions returned.
C) are caused by small numbers and large numbers used in the same problem.
D) all of these.
فتح الحزمة
افتح القفل للوصول البطاقات البالغ عددها 88 في هذه المجموعة.
فتح الحزمة
k this deck
22
Exhibit 3.1
The following questions are based on this problem and accompanying Excel windows.
Jones Furniture Company produces beds and desks for college students. The production process requires carpentry and varnishing. Each bed requires 6 hours of carpentry and 4 hour of varnishing. Each desk requires 4 hours of carpentry and 8 hours of varnishing. There are 36 hours of carpentry time and 40 hours of varnishing time available. Beds generate $30 of profit and desks generate $40 of profit. Demand for desks is limited, so at most 8 will be produced.
Let
The LP model for the problem is
-Refer to Exhibit 3.1. What formula should be entered in cell E5 in the accompanying Excel spreadsheet to compute total profit?
A) =B4*B5+C4*C5
B) =SUMPRODUCT(B8:C8,$B$4:$C$4)
C) =SUM(B5:C5)
D) =SUM(E8:E10)
فتح الحزمة
افتح القفل للوصول البطاقات البالغ عددها 88 في هذه المجموعة.
فتح الحزمة
k this deck
23
Exhibit 3.1
The following questions are based on this problem and accompanying Excel windows.
Jones Furniture Company produces beds and desks for college students. The production process requires carpentry and varnishing. Each bed requires 6 hours of carpentry and 4 hour of varnishing. Each desk requires 4 hours of carpentry and 8 hours of varnishing. There are 36 hours of carpentry time and 40 hours of varnishing time available. Beds generate $30 of profit and desks generate $40 of profit. Demand for desks is limited, so at most 8 will be produced.
Let
The LP model for the problem is
-Refer to Exhibit 3.1. Which of the following statements represent the carpentry, varnishing and limited demand for desks constraints?
A) B4:C4 B5:C5
B) E5 0
C) D8:D10 E8:E10
D) E8:E10 D8:D10
فتح الحزمة
افتح القفل للوصول البطاقات البالغ عددها 88 في هذه المجموعة.
فتح الحزمة
k this deck
24
Exhibit 3.1
The following questions are based on this problem and accompanying Excel windows.
Jones Furniture Company produces beds and desks for college students. The production process requires carpentry and varnishing. Each bed requires 6 hours of carpentry and 4 hour of varnishing. Each desk requires 4 hours of carpentry and 8 hours of varnishing. There are 36 hours of carpentry time and 40 hours of varnishing time available. Beds generate $30 of profit and desks generate $40 of profit. Demand for desks is limited, so at most 8 will be produced.
Let
The LP model for the problem is
-Refer to Exhibit 3.1. Which cells should be changing cells in this problem?
A) B4:C4
B) E5
C) D8:D10
D) E8:E10
فتح الحزمة
افتح القفل للوصول البطاقات البالغ عددها 88 في هذه المجموعة.
فتح الحزمة
k this deck
25
Exhibit 3.3
The following questions are based on this problem and accompanying Excel windows.
Jack's distillery blends scotches for local bars and saloons. One of his customers has requested a special blend of scotch targeted as a bar scotch. The customer wants the blend to involve two scotch products, call them A and B. Product A is a higher quality scotch while product B is a cheaper brand. The customer wants to make the claim the blend is closer to high quality than the alternative. The customer wants 50 1500 ml bottles of the blend. Each bottle must contain at least 48% of Product A and at least 500 ml of B. The customer also specified that the blend have an alcohol content of at least 85%. Product A contains 95% alcohol while product B contains 78%. The blend is sold for $12.50 per bottle. Product A costs $7 per liter and product B costs $3 per liter. The company wants to determine the blend that will meet the customer's requirements and maximize profit.
Let Number of liters of product in total blend delivered
Number of liters of product in total blend delivered
MIN:
Subject to: (Total liters of mix)
minimum)
minimum)
(85\% alcohol minimum)
-Refer to Exhibit 3.3. What formula should be entered in cell E5 in the accompanying Excel spreadsheet to compute total cost?
A) =B4*C4+B5*C5
B) =SUMPRODUCT(B4:C4,B5:C5)
C) =SUM(B5:C5)
D) =SUM(E8:E10)
فتح الحزمة
افتح القفل للوصول البطاقات البالغ عددها 88 في هذه المجموعة.
فتح الحزمة
k this deck
26
Problems which have only integer solutions are called
A) discrete programming problems
B) integer programming problems
C) discrete programming problems
D) infeasible programming problems
A) discrete programming problems
B) integer programming problems
C) discrete programming problems
D) infeasible programming problems
فتح الحزمة
افتح القفل للوصول البطاقات البالغ عددها 88 في هذه المجموعة.
فتح الحزمة
k this deck
27
How many decision variables are there in a transportation problem which has 5 supply points and 4 demand points?
A) 4
B) 5
C) 9
D) 20
A) 4
B) 5
C) 9
D) 20
فتح الحزمة
افتح القفل للوصول البطاقات البالغ عددها 88 في هذه المجموعة.
فتح الحزمة
k this deck
28
Using Data Envelopment Analysis (DEA) for an inefficient unit, a more efficient composite unit can be found by
A) Solving its DEA problem and retrieving the weights from the answer report.
B) Solving its DEA problem and examining those units whose final value is non-zero.
C) Solving its DEA problem and using the resulting shadow prices as composite weights.
D) Solving its DEA problem and using the positive resulting shadow prices as composite weights.
فتح الحزمة
افتح القفل للوصول البطاقات البالغ عددها 88 في هذه المجموعة.
فتح الحزمة
k this deck
29
Exhibit 3.2
The following questions are based on this problem and accompanying Excel windows.
The Byte computer company produces two models of computers, Plain and Fancy. It wants to plan how many computers to produce next month to maximize profits. Producing these computers requires wiring, assembly and inspection time. Each computer produces a certain level of profits but faces only a limited demand. There are also a limited number of wiring, assembly and inspection hours available in each month. The data for this problem is summarized in the following table.
Let Number of Plain computers to produce
Number of Fancy computers to produce
MAX:
Subject to: (wiring hours)
(assembly hours)
(inspection hours)
(Plin computers demand)
(Fancy computers demand)
-Refer to Exhibit 3.2. Which of the following statements will represent the constraint for just assembly hours?
A) B4:C4 B5:C5
B) D9 E9
C) D8:D10 E8:E10
D) E8:E10 D8:D10
فتح الحزمة
افتح القفل للوصول البطاقات البالغ عددها 88 في هذه المجموعة.
فتح الحزمة
k this deck
30
Exhibit 3.1
The following questions are based on this problem and accompanying Excel windows.
Jones Furniture Company produces beds and desks for college students. The production process requires carpentry and varnishing. Each bed requires 6 hours of carpentry and 4 hour of varnishing. Each desk requires 4 hours of carpentry and 8 hours of varnishing. There are 36 hours of carpentry time and 40 hours of varnishing time available. Beds generate $30 of profit and desks generate $40 of profit. Demand for desks is limited, so at most 8 will be produced.
Let
The LP model for the problem is
-Refer to Exhibit 3.1. What formula should be entered in cell D8 in the accompanying Excel spreadsheet to compute the amount of carpentry used?
A) =B4*B5+C4*C5
B) =SUMPRODUCT(B8:C8,$B$4:$C$4)
C) =SUM(B5:C5)
D) =SUM(E8:E10)
فتح الحزمة
افتح القفل للوصول البطاقات البالغ عددها 88 في هذه المجموعة.
فتح الحزمة
k this deck
31
What is the significance of an absolute cell reference in Excel?
A) The cell reference will not change if the formula containing the reference is copied to another location
B) The cell will always contain the absolute value of any number entered into it
C) The cell reference changes if the formula containing the reference is copied to another location
D) It is the only formula used to refer to a cell on another spreadsheet
فتح الحزمة
افتح القفل للوصول البطاقات البالغ عددها 88 في هذه المجموعة.
فتح الحزمة
k this deck
32
Exhibit 3.2
The following questions are based on this problem and accompanying Excel windows.
The Byte computer company produces two models of computers, Plain and Fancy. It wants to plan how many computers to produce next month to maximize profits. Producing these computers requires wiring, assembly and inspection time. Each computer produces a certain level of profits but faces only a limited demand. There are also a limited number of wiring, assembly and inspection hours available in each month. The data for this problem is summarized in the following table.
Let Number of Plain computers to produce
Number of Fancy computers to produce
MAX:
Subject to: (wiring hours)
(assembly hours)
(inspection hours)
(Plin computers demand)
(Fancy computers demand)
-Refer to Exhibit 3.2. Which cells should be the constraint cells in this problem?
A) B4:C4
B) E5
C) D8:D12
D) E8:E12
فتح الحزمة
افتح القفل للوصول البطاقات البالغ عددها 88 في هذه المجموعة.
فتح الحزمة
k this deck
33
Which of the following describes Data Envelopment Analysis (DEA).
A) DEA finds the most effective company among some set of companies.
B) DEA determines if a company is converting inputs to outputs as effectively as possible.
C) DEA determines how effective a company converts inputs to outputs compared to other companies.
D) DEA compares how effective a company converts inputs to outputs compared to a benchmark composite of all companies.
فتح الحزمة
افتح القفل للوصول البطاقات البالغ عددها 88 في هذه المجموعة.
فتح الحزمة
k this deck
34
Exhibit 3.1
The following questions are based on this problem and accompanying Excel windows.
Jones Furniture Company produces beds and desks for college students. The production process requires carpentry and varnishing. Each bed requires 6 hours of carpentry and 4 hour of varnishing. Each desk requires 4 hours of carpentry and 8 hours of varnishing. There are 36 hours of carpentry time and 40 hours of varnishing time available. Beds generate $30 of profit and desks generate $40 of profit. Demand for desks is limited, so at most 8 will be produced.
Let
The LP model for the problem is
-Refer to Exhibit 3.1. Which cells should be the constraint cells in this problem?
A) B4:C4
B) E5
C) D8:D10
D) E8:E10
فتح الحزمة
افتح القفل للوصول البطاقات البالغ عددها 88 في هذه المجموعة.
فتح الحزمة
k this deck
35
Data Envelopment Analysis (DEA) is an LP-based methodology in which weighted sums of inputs and outputs are calculated and
A) the constraints capture the maximum effectiveness of each unit.
B) the objective is to maximize every units output.
C) the constraints ensure the sum of the weighted outputs is one.
D) the objective for each unit is to maximize the weighted sum of its outputs.
A) the constraints capture the maximum effectiveness of each unit.
B) the objective is to maximize every units output.
C) the constraints ensure the sum of the weighted outputs is one.
D) the objective for each unit is to maximize the weighted sum of its outputs.
فتح الحزمة
افتح القفل للوصول البطاقات البالغ عددها 88 في هذه المجموعة.
فتح الحزمة
k this deck
36
Exhibit 3.2
The following questions are based on this problem and accompanying Excel windows.
The Byte computer company produces two models of computers, Plain and Fancy. It wants to plan how many computers to produce next month to maximize profits. Producing these computers requires wiring, assembly and inspection time. Each computer produces a certain level of profits but faces only a limited demand. There are also a limited number of wiring, assembly and inspection hours available in each month. The data for this problem is summarized in the following table.
Let Number of Plain computers to produce
Number of Fancy computers to produce
MAX:
Subject to: (wiring hours)
(assembly hours)
(inspection hours)
(Plin computers demand)
(Fancy computers demand)
-Refer to Exhibit 3.2. What formula should be entered in cell E5 in the accompanying Excel spreadsheet to compute total profit?
A) =B4*C4+B5*C5
B) =SUMPRODUCT(B4:C4,B5:C5)
C) =SUM(B5:C5)
D) =SUM(E8:E10)
فتح الحزمة
افتح القفل للوصول البطاقات البالغ عددها 88 في هذه المجموعة.
فتح الحزمة
k this deck
37
Exhibit 3.2
The following questions are based on this problem and accompanying Excel windows.
The Byte computer company produces two models of computers, Plain and Fancy. It wants to plan how many computers to produce next month to maximize profits. Producing these computers requires wiring, assembly and inspection time. Each computer produces a certain level of profits but faces only a limited demand. There are also a limited number of wiring, assembly and inspection hours available in each month. The data for this problem is summarized in the following table.
Let Number of Plain computers to produce
Number of Fancy computers to produce
MAX:
Subject to: (wiring hours)
(assembly hours)
(inspection hours)
(Plin computers demand)
(Fancy computers demand)
-Refer to Exhibit 3.2. What formula should be entered in cell D8 in the accompanying Excel spreadsheet to compute the amount of wiring used?
A) =B4*B5+C4*C5
B) =SUMPRODUCT(B8:C8,$B$4:$C$4)
C) =SUM(B5:C5)
D) =SUM(E8:E10)
فتح الحزمة
افتح القفل للوصول البطاقات البالغ عددها 88 في هذه المجموعة.
فتح الحزمة
k this deck
38
A heuristic solution is
A) used by Risk Solver Platform (RSP) when the Guess button is used.
B) guaranteed to produce an optimal solution.
C) used by Risk Solver Platform (RSP) if Standard GRG Nonlinear method is selected.
D) a rule-of-thumb for making decisions.
A) used by Risk Solver Platform (RSP) when the Guess button is used.
B) guaranteed to produce an optimal solution.
C) used by Risk Solver Platform (RSP) if Standard GRG Nonlinear method is selected.
D) a rule-of-thumb for making decisions.
فتح الحزمة
افتح القفل للوصول البطاقات البالغ عددها 88 في هذه المجموعة.
فتح الحزمة
k this deck
39
How many constraints are there in a transportation problem which has 5 supply points and 4 demand points? (ignore the non-negativity constraints)
A) 4
B) 5
C) 9
D) 20
A) 4
B) 5
C) 9
D) 20
فتح الحزمة
افتح القفل للوصول البطاقات البالغ عددها 88 في هذه المجموعة.
فتح الحزمة
k this deck
40
Exhibit 3.2
The following questions are based on this problem and accompanying Excel windows.
The Byte computer company produces two models of computers, Plain and Fancy. It wants to plan how many computers to produce next month to maximize profits. Producing these computers requires wiring, assembly and inspection time. Each computer produces a certain level of profits but faces only a limited demand. There are also a limited number of wiring, assembly and inspection hours available in each month. The data for this problem is summarized in the following table.
Let Number of Plain computers to produce
Number of Fancy computers to produce
MAX:
Subject to: (wiring hours)
(assembly hours)
(inspection hours)
(Plin computers demand)
(Fancy computers demand)
-Refer to Exhibit 3.2. Which cells should be changing cells in this problem?
A) B4:C4
B) E5
C) D8:D10
D) E8:E10
فتح الحزمة
افتح القفل للوصول البطاقات البالغ عددها 88 في هذه المجموعة.
فتح الحزمة
k this deck
41
You have been given the following linear programming model and Excel spreadsheet to solve this problem. What numbers should be entered into cells B5:C5 and B8:C10 to implement this model?
فتح الحزمة
افتح القفل للوصول البطاقات البالغ عددها 88 في هذه المجموعة.
فتح الحزمة
k this deck
42
You have been given the following linear programming model and Excel spreadsheet to solve this problem. What formulas should be entered into cells E5 and D8:D10 to implement this model?
فتح الحزمة
افتح القفل للوصول البطاقات البالغ عددها 88 في هذه المجموعة.
فتح الحزمة
k this deck
43
Exhibit 3.4
The following questions are based on this problem and accompanying Excel windows.
A financial planner wants to design a portfolio of investments for a client. The client has $300,000 to invest and the planner has identified four investment options for the money. The following requirements have been placed on the planner. No more than 25% of the money in any one investment, at least one third should be invested in long-term bonds which mature in seven or more years, and no more than 25% of the total money should be invested in C or D since they are riskier investments. The planner has developed the following LP model based on the data in this table and the requirements of the client. The objective is to maximize the total return of the portfolio.
Let
MAX:
Subject to:
-Refer to Exhibit 3.4. What formula should be entered in cell B7 in the accompanying Excel spreadsheet to compute total dollars invested?
A) =ADD(B3:B6)
B) =SUM(B3:B6)
C) =TOTAL(B3:B6)
D) =TALLY(B3:B6)
فتح الحزمة
افتح القفل للوصول البطاقات البالغ عددها 88 في هذه المجموعة.
فتح الحزمة
k this deck
44
Exhibit 3.5
The following questions are based on this problem and accompanying Excel windows.
A company is planning production for the next 4 quarters. They want to minimize the cost of production. The production cost is stable but demand and production capacity vary from quarter to quarter. The maximum amount of inventory which can be held is 12,000 units and management wants to keep at least 3,000 units on hand. Quarterly inventory holding cost is 3% of the cost of production. The company estimates the number of units carried in inventory each month by averaging the beginning and ending inventory for each month. There are currently 5,000 units in inventory. The company wants to produce at no less than one half of its maximum capacity in any quarter.
-Refer to Exhibit 3.5. Which cells are changing cells in the accompanying Excel spreadsheet?
A) C4:F4
B) C9:F9
C) F20
D) C12:F12
فتح الحزمة
افتح القفل للوصول البطاقات البالغ عددها 88 في هذه المجموعة.
فتح الحزمة
k this deck
45
Exhibit 3.5
The following questions are based on this problem and accompanying Excel windows.
A company is planning production for the next 4 quarters. They want to minimize the cost of production. The production cost is stable but demand and production capacity vary from quarter to quarter. The maximum amount of inventory which can be held is 12,000 units and management wants to keep at least 3,000 units on hand. Quarterly inventory holding cost is 3% of the cost of production. The company estimates the number of units carried in inventory each month by averaging the beginning and ending inventory for each month. There are currently 5,000 units in inventory. The company wants to produce at no less than one half of its maximum capacity in any quarter.
-Refer to Exhibit 3.5. What formula should be entered in cell C18 in the accompanying Excel spreadsheet to compute the quarterly carrying costs?
A) =C15*C3+C6
B) =C15*(C3+C6)
C) =C15*C3/2
D) =C15*(C3+C6)/2
فتح الحزمة
افتح القفل للوصول البطاقات البالغ عددها 88 في هذه المجموعة.
فتح الحزمة
k this deck
46
Exhibit 3.5
The following questions are based on this problem and accompanying Excel windows.
A company is planning production for the next 4 quarters. They want to minimize the cost of production. The production cost is stable but demand and production capacity vary from quarter to quarter. The maximum amount of inventory which can be held is 12,000 units and management wants to keep at least 3,000 units on hand. Quarterly inventory holding cost is 3% of the cost of production. The company estimates the number of units carried in inventory each month by averaging the beginning and ending inventory for each month. There are currently 5,000 units in inventory. The company wants to produce at no less than one half of its maximum capacity in any quarter.
-Refer to Exhibit 3.5. What formula should be entered in cell C6 in the accompanying Excel spreadsheet to compute ending inventory?
A) =C3-C4+C5
B) =C3+C4-C5
C) =C3-(C4-C5)
D) =C5-C4-C3
فتح الحزمة
افتح القفل للوصول البطاقات البالغ عددها 88 في هذه المجموعة.
فتح الحزمة
k this deck
47
You have been given the following linear programming model and Excel spreadsheet to solve this problem. What formulas should be entered into cells E5 and D8:D10 to implement this model?
فتح الحزمة
افتح القفل للوصول البطاقات البالغ عددها 88 في هذه المجموعة.
فتح الحزمة
k this deck
48
You have been given the following linear programming model and Excel spreadsheet to solve this problem. What cell references would you enter in the Risk Solver Platform (RSP) task pane for the following?
Objective Cell:
Variables Cells:
Constraints Cells:
Objective Cell:
Variables Cells:
Constraints Cells:
فتح الحزمة
افتح القفل للوصول البطاقات البالغ عددها 88 في هذه المجموعة.
فتح الحزمة
k this deck
49
Exhibit 3.4
The following questions are based on this problem and accompanying Excel windows.
A financial planner wants to design a portfolio of investments for a client. The client has $300,000 to invest and the planner has identified four investment options for the money. The following requirements have been placed on the planner. No more than 25% of the money in any one investment, at least one third should be invested in long-term bonds which mature in seven or more years, and no more than 25% of the total money should be invested in C or D since they are riskier investments. The planner has developed the following LP model based on the data in this table and the requirements of the client. The objective is to maximize the total return of the portfolio.
Let
MAX:
Subject to:
-Refer to Exhibit 3.4. What formula should be entered in cell D7 in the accompanying Excel spreadsheet to compute the total return?
A) =B7*SUM(D3:D6)
B) =SUMPRODUCT(B3:B6,D3:D6)
C) =SUM(B3:B6)
D) =SUMPRODUCT(B3:E3,B6:E6)
فتح الحزمة
افتح القفل للوصول البطاقات البالغ عددها 88 في هذه المجموعة.
فتح الحزمة
k this deck
50
Exhibit 3.3
The following questions are based on this problem and accompanying Excel windows.
Jack's distillery blends scotches for local bars and saloons. One of his customers has requested a special blend of scotch targeted as a bar scotch. The customer wants the blend to involve two scotch products, call them A and B. Product A is a higher quality scotch while product B is a cheaper brand. The customer wants to make the claim the blend is closer to high quality than the alternative. The customer wants 50 1500 ml bottles of the blend. Each bottle must contain at least 48% of Product A and at least 500 ml of B. The customer also specified that the blend have an alcohol content of at least 85%. Product A contains 95% alcohol while product B contains 78%. The blend is sold for $12.50 per bottle. Product A costs $7 per liter and product B costs $3 per liter. The company wants to determine the blend that will meet the customer's requirements and maximize profit.
Let Number of liters of product in total blend delivered
Number of liters of product in total blend delivered
MIN:
Subject to: (Total liters of mix)
minimum)
minimum)
(85\% alcohol minimum)
-Refer to Exhibit 3.3. Which cells should be the constraint cells in this problem?
A) B4:C4
B) E5
C) D8:D11
D) E8:E10
فتح الحزمة
افتح القفل للوصول البطاقات البالغ عددها 88 في هذه المجموعة.
فتح الحزمة
k this deck
51
You have been given the following linear programming model and Excel spreadsheet to solve this problem. What cell references would you enter in the Risk Solver Platform (RSP) task pane for the following?
Objective Cell:
Variables Cells:
Constraints Cells:
Objective Cell:
Variables Cells:
Constraints Cells:
فتح الحزمة
افتح القفل للوصول البطاقات البالغ عددها 88 في هذه المجموعة.
فتح الحزمة
k this deck
52
You have been given the following linear programming model and Excel spreadsheet to solve this problem. What cell references would you enter in the Risk Solver Platform (RSP) task pane for the following?
Objective Cell:
Variables Cells:
Constraints Cells:
Objective Cell:
Variables Cells:
Constraints Cells:
فتح الحزمة
افتح القفل للوصول البطاقات البالغ عددها 88 في هذه المجموعة.
فتح الحزمة
k this deck
53
You have been given the following linear programming model and Excel spreadsheet to solve this problem. What formulas should be entered into cells E5 and D8:D10 to implement this model?
فتح الحزمة
افتح القفل للوصول البطاقات البالغ عددها 88 في هذه المجموعة.
فتح الحزمة
k this deck
54
You have been given the following linear programming model and Excel spreadsheet to solve this problem. What numbers should be entered into cells B5:C5 and B8:C10 to implement this model?
فتح الحزمة
افتح القفل للوصول البطاقات البالغ عددها 88 في هذه المجموعة.
فتح الحزمة
k this deck
55
You have been given the following linear programming model and Excel spreadsheet to solve this problem. What numbers should be entered into cells B5:C5 and B8:C10 to implement this model?
فتح الحزمة
افتح القفل للوصول البطاقات البالغ عددها 88 في هذه المجموعة.
فتح الحزمة
k this deck
56
Exhibit 3.4
The following questions are based on this problem and accompanying Excel windows.
A financial planner wants to design a portfolio of investments for a client. The client has $300,000 to invest and the planner has identified four investment options for the money. The following requirements have been placed on the planner. No more than 25% of the money in any one investment, at least one third should be invested in long-term bonds which mature in seven or more years, and no more than 25% of the total money should be invested in C or D since they are riskier investments. The planner has developed the following LP model based on the data in this table and the requirements of the client. The objective is to maximize the total return of the portfolio.
Let
MAX:
Subject to:
-Refer to Exhibit 3.4. Which cells are changing cells in the accompanying Excel spreadsheet?
A) B3:B6
B) B7:I7
C) C7
D) E7
فتح الحزمة
افتح القفل للوصول البطاقات البالغ عددها 88 في هذه المجموعة.
فتح الحزمة
k this deck
57
Exhibit 3.3
The following questions are based on this problem and accompanying Excel windows.
Jack's distillery blends scotches for local bars and saloons. One of his customers has requested a special blend of scotch targeted as a bar scotch. The customer wants the blend to involve two scotch products, call them A and B. Product A is a higher quality scotch while product B is a cheaper brand. The customer wants to make the claim the blend is closer to high quality than the alternative. The customer wants 50 1500 ml bottles of the blend. Each bottle must contain at least 48% of Product A and at least 500 ml of B. The customer also specified that the blend have an alcohol content of at least 85%. Product A contains 95% alcohol while product B contains 78%. The blend is sold for $12.50 per bottle. Product A costs $7 per liter and product B costs $3 per liter. The company wants to determine the blend that will meet the customer's requirements and maximize profit.
Let Number of liters of product in total blend delivered
Number of liters of product in total blend delivered
MIN:
Subject to: (Total liters of mix)
minimum)
minimum)
(85\% alcohol minimum)
-Refer to Exhibit 3.3. What formula should be entered in cell D11 in the accompanying Excel spreadsheet to compute the total liters of alcohol supplied?
A) =B4*B5+C4*C5
B) =SUMPRODUCT(B11:C11,$B$4:$C$4)
C) =SUM(B5:C5)
D) =SUM(E8:E10)
فتح الحزمة
افتح القفل للوصول البطاقات البالغ عددها 88 في هذه المجموعة.
فتح الحزمة
k this deck
58
Exhibit 3.3
The following questions are based on this problem and accompanying Excel windows.
Jack's distillery blends scotches for local bars and saloons. One of his customers has requested a special blend of scotch targeted as a bar scotch. The customer wants the blend to involve two scotch products, call them A and B. Product A is a higher quality scotch while product B is a cheaper brand. The customer wants to make the claim the blend is closer to high quality than the alternative. The customer wants 50 1500 ml bottles of the blend. Each bottle must contain at least 48% of Product A and at least 500 ml of B. The customer also specified that the blend have an alcohol content of at least 85%. Product A contains 95% alcohol while product B contains 78%. The blend is sold for $12.50 per bottle. Product A costs $7 per liter and product B costs $3 per liter. The company wants to determine the blend that will meet the customer's requirements and maximize profit.
Let Number of liters of product in total blend delivered
Number of liters of product in total blend delivered
MIN:
Subject to: (Total liters of mix)
minimum)
minimum)
(85\% alcohol minimum)
-Refer to Exhibit 3.3. Which of the following statements could represent a constraint in this problem?
A) B4:C4 B5:C5
B) E5 0
C) D8 = E8
D) E8:E11 D8:D11
فتح الحزمة
افتح القفل للوصول البطاقات البالغ عددها 88 في هذه المجموعة.
فتح الحزمة
k this deck
59
Exhibit 3.3
The following questions are based on this problem and accompanying Excel windows.
Jack's distillery blends scotches for local bars and saloons. One of his customers has requested a special blend of scotch targeted as a bar scotch. The customer wants the blend to involve two scotch products, call them A and B. Product A is a higher quality scotch while product B is a cheaper brand. The customer wants to make the claim the blend is closer to high quality than the alternative. The customer wants 50 1500 ml bottles of the blend. Each bottle must contain at least 48% of Product A and at least 500 ml of B. The customer also specified that the blend have an alcohol content of at least 85%. Product A contains 95% alcohol while product B contains 78%. The blend is sold for $12.50 per bottle. Product A costs $7 per liter and product B costs $3 per liter. The company wants to determine the blend that will meet the customer's requirements and maximize profit.
Let Number of liters of product in total blend delivered
Number of liters of product in total blend delivered
MIN:
Subject to: (Total liters of mix)
minimum)
minimum)
(85\% alcohol minimum)
-Refer to Exhibit 3.3. Which cells should be changing cells in this problem?
A) B4:C4
B) E5
C) D8:D10
D) E8:E10
فتح الحزمة
افتح القفل للوصول البطاقات البالغ عددها 88 في هذه المجموعة.
فتح الحزمة
k this deck
60
Exhibit 3.5
The following questions are based on this problem and accompanying Excel windows.
A company is planning production for the next 4 quarters. They want to minimize the cost of production. The production cost is stable but demand and production capacity vary from quarter to quarter. The maximum amount of inventory which can be held is 12,000 units and management wants to keep at least 3,000 units on hand. Quarterly inventory holding cost is 3% of the cost of production. The company estimates the number of units carried in inventory each month by averaging the beginning and ending inventory for each month. There are currently 5,000 units in inventory. The company wants to produce at no less than one half of its maximum capacity in any quarter.
-Refer to Exhibit 3.5. What formula could be entered in cell F20 in the accompanying Excel spreadsheet to compute the Total Cost for all four quarters?
A) SUMPRODUCT($C$4:$F$4,C17:F17)
B) SUM(C17:F17) + SUM(C18:F18)
C) PRODUCT(SUM(C14:F15,C17:F18)
D) SUMPRODUCT(C4:F4,C14:F14) + SUMPRODUCT(C6:F6,C15:F15)
فتح الحزمة
افتح القفل للوصول البطاقات البالغ عددها 88 في هذه المجموعة.
فتح الحزمة
k this deck
61
A company needs to purchase several new machines to meet its future production needs. It can purchase three different types of machines A, B, and C. Each machine A costs $80,000 and requires 2,000 square feet of floor space. Each machine B costs $50,000 and requires 3,000 square feet of floor space. Each machine C costs $40,000 and requires 5,000 square feet of floor space. The machines can produce 200, 250 and 350 units per day respectively. The plant can only afford $500,000 for all the machines and has at most 20,000 square feet of room for the machines. The company wants to buy as many machines as possible to maximize daily production.
What values would you enter in the Risk Solver Platform (RSP) task pane for the following cells for this Excel spreadsheet implementation of the formulation for this problem?
Objective Cell:
Variables Cells:
Constraints Cells:
What values would you enter in the Risk Solver Platform (RSP) task pane for the following cells for this Excel spreadsheet implementation of the formulation for this problem?
Objective Cell:
Variables Cells:
Constraints Cells:
فتح الحزمة
افتح القفل للوصول البطاقات البالغ عددها 88 في هذه المجموعة.
فتح الحزمة
k this deck
62
A financial planner wants to design a portfolio of investments for a client. The client has $400,000 to invest and the planner has identified four investment options for the money. The following requirements have been placed on the planner. No more than 30% of the money in any one investment, at least one half should be invested in long-term bonds which mature in six or more years, and no more than 40% of the total money should be invested in B or C since they are riskier investments. The planner has developed the following LP model based on the data in this table and the requirements of the client. The objective is to maximize the total return of the portfolio.
What values would you enter in the Risk Solver Platform (RSP) task pane for the following cells for this Excel spreadsheet implementation of this problem?
Objective Cell:
Variables Cells:
Constraints Cells:
What values would you enter in the Risk Solver Platform (RSP) task pane for the following cells for this Excel spreadsheet implementation of this problem?Objective Cell:
Variables Cells:
Constraints Cells:
فتح الحزمة
افتح القفل للوصول البطاقات البالغ عددها 88 في هذه المجموعة.
فتح الحزمة
k this deck
63
A company needs to purchase several new machines to meet its future production needs. It can purchase three different types of machines A, B, and C. Each machine A costs $80,000 and requires 2,000 square feet of floor space. Each machine B costs $50,000 and requires 3,000 square feet of floor space. Each machine C costs $40,000 and requires 5,000 square feet of floor space. The machines can produce 200, 250 and 350 units per day respectively. The plant can only afford $500,000 for all the machines and has at most 20,000 square feet of room for the machines. The company wants to buy as many machines as possible to maximize daily production.
What are the key formulas for this Excel spreadsheet implementation of the following formulation?
What are the key formulas for this Excel spreadsheet implementation of the following formulation?
فتح الحزمة
افتح القفل للوصول البطاقات البالغ عددها 88 في هذه المجموعة.
فتح الحزمة
k this deck
64
A financial planner wants to design a portfolio of investments for a client. The client has $400,000 to invest and the planner has identified four investment options for the money. The following requirements have been placed on the planner. No more than 30% of the money in any one investment, at least one half should be invested in long-term bonds which mature in six or more years, and no more than 40% of the total money should be invested in B or C since they are riskier investments. The planner has developed the following LP model based on the data in this table and the requirements of the client. The objective is to maximize the total return of the portfolio.
Formulate the LP for this problem.
Formulate the LP for this problem. فتح الحزمة
افتح القفل للوصول البطاقات البالغ عددها 88 في هذه المجموعة.
فتح الحزمة
k this deck
65
A financial planner wants to design a portfolio of investments for a client. The client has $400,000 to invest and the planner has identified four investment options for the money. The following requirements have been placed on the planner. No more than 30% of the money in any one investment, at least one half should be invested in long-term bonds which mature in six or more years, and no more than 40% of the total money should be invested in B or C since they are riskier investments. The planner has developed the following LP model based on the data in this table and the requirements of the client. The objective is to maximize the total return of the portfolio.
What formulas are required for the following cells in the Excel spreadsheet implementation of the formulation?
B7
D7
F7
H7
What formulas are required for the following cells in the Excel spreadsheet implementation of the formulation?B7
D7
F7
H7
فتح الحزمة
افتح القفل للوصول البطاقات البالغ عددها 88 في هذه المجموعة.
فتح الحزمة
k this deck
66
A hospital needs to determine how many nurses to hire to cover a 24 hour period. The nurses must work 8 consecutive hours but can start work at the start of 6 different shifts. They are paid different wages depending on when they start their shifts. The number of nurses required per 4-hour time period and their wages are shown in the following table.
Enter the numbers in the appropriate cells of ranges B6:G11 and B13:G13 in the Excel spreadsheet to solve this problem based on the following formulation.
Enter the numbers in the appropriate cells of ranges B6:G11 and B13:G13 in the Excel spreadsheet to solve this problem based on the following formulation. فتح الحزمة
افتح القفل للوصول البطاقات البالغ عددها 88 في هذه المجموعة.
فتح الحزمة
k this deck
67
A paper mill has received an order for rolls of paper. The customer wants 400 12" wide rolls, 300 18" rolls and 200 24" rolls. The company has 40" wide rolls of paper which it can slit to the appropriate width. The company wants to minimize the number of rolls it must use to fill the order.
Formulate the LP for this problem.
Formulate the LP for this problem.
فتح الحزمة
افتح القفل للوصول البطاقات البالغ عددها 88 في هذه المجموعة.
فتح الحزمة
k this deck
68
A company needs to purchase several new machines to meet its future production needs. It can purchase three different types of machines A, B, and C. Each machine A costs $80,000 and requires 2,000 square feet of floor space. Each machine B costs $50,000 and requires 3,000 square feet of floor space. Each machine C costs $40,000 and requires 5,000 square feet of floor space. The machines can produce 200, 250 and 350 units per day respectively. The plant can only afford $500,000 for all the machines and has at most 20,000 square feet of room for the machines. The company wants to buy as many machines as possible to maximize daily production.
Enter the numbers in the appropriate cells of range B5:F10 in the Excel spreadsheet to solve this problem based on the following formulation.
Enter the numbers in the appropriate cells of range B5:F10 in the Excel spreadsheet to solve this problem based on the following formulation.
فتح الحزمة
افتح القفل للوصول البطاقات البالغ عددها 88 في هذه المجموعة.
فتح الحزمة
k this deck
69
A farmer is planning his spring planting. He has 20 acres on which he can plant a combination of Corn, Pumpkins and Beans. He wants to maximize his profit but there is a limited demand for each crop. Each crop also requires fertilizer and irrigation water which are in short supply. The following table summarizes the data for the problem.
What are the key formulas for this Excel spreadsheet implementation of the following formulation?
What are the key formulas for this Excel spreadsheet implementation of the following formulation? فتح الحزمة
افتح القفل للوصول البطاقات البالغ عددها 88 في هذه المجموعة.
فتح الحزمة
k this deck
70
A hospital needs to determine how many nurses to hire to cover a 24 hour period. The nurses must work 8 consecutive hours but can start work at the start of 6 different shifts. They are paid different wages depending on when they start their shifts. The number of nurses required per 4-hour time period and their wages are shown in the following table.
What are the key formulas for this Excel spreadsheet implementation of the following formulation?
What are the key formulas for this Excel spreadsheet implementation of the following formulation? فتح الحزمة
افتح القفل للوصول البطاقات البالغ عددها 88 في هذه المجموعة.
فتح الحزمة
k this deck
71
Pete's Plastics manufactures plastic at plants in Miami, St. Louis and Cleveland. Pete needs to ship plastic to customers in Pittsburgh, Atlanta and Chicago. He wants to minimize the cost of shipping the plastic from his plants to his customers. The data for the problem is summarized in the following table.
Formulate the LP for this problem.
Formulate the LP for this problem. فتح الحزمة
افتح القفل للوصول البطاقات البالغ عددها 88 في هذه المجموعة.
فتح الحزمة
k this deck
72
A farmer is planning his spring planting. He has 20 acres on which he can plant a combination of Corn, Pumpkins and Beans. He wants to maximize his profit but there is a limited demand for each crop. Each crop also requires fertilizer and irrigation water which are in short supply. There are only 50 acre ft of irrigation available and only 8,000 pounds/acre of fertilizer available. The following table summarizes the data for the problem.
Formulate the LP for this problem.
Formulate the LP for this problem. فتح الحزمة
افتح القفل للوصول البطاقات البالغ عددها 88 في هذه المجموعة.
فتح الحزمة
k this deck
73
A farmer is planning his spring planting. He has 20 acres on which he can plant a combination of Corn, Pumpkins and Beans. He wants to maximize his profit but there is a limited demand for each crop. Each crop also requires fertilizer and irrigation water which are in short supply. There are only 50 acre ft of irrigation available and only 8,000 pounds/acre of fertilizer available. The following table summarizes the data for the problem.
Enter the numbers in the appropriate cells of ranges B12:D12 and E8:F12 in the Excel spreadsheet to solve this problem based on the following formulation.
Enter the numbers in the appropriate cells of ranges B12:D12 and E8:F12 in the Excel spreadsheet to solve this problem based on the following formulation. فتح الحزمة
افتح القفل للوصول البطاقات البالغ عددها 88 في هذه المجموعة.
فتح الحزمة
k this deck
74
Carlton construction is supplying building materials for a new mall construction project in Kansas. Their contract calls for a total of 250,000 tons of material to be delivered over a three-week period. Carlton's supply depot has access to three modes of transportation: a trucking fleet, railway delivery, and air cargo transport. Their contract calls for 120,000 tons delivered by the end of week one, 80% of the total delivered by the end of week two, and the entire amount delivered by the end of week three. Contracts in place with the transportation companies call for at least 45% of the total delivered be delivered by trucking, at least 40% of the total delivered be delivered by railway, and up to 15% of the total delivered be delivered by air cargo. Unfortunately, competing demands limit the availability of each mode of transportation each of the three weeks to the following levels (all in thousands of tons):
Formulate an LP model for this logistics problem.
Formulate an LP model for this logistics problem. فتح الحزمة
افتح القفل للوصول البطاقات البالغ عددها 88 في هذه المجموعة.
فتح الحزمة
k this deck
75
A company needs to purchase several new machines to meet its future production needs. It can purchase three different types of machines A, B, and C. Each machine A costs $80,000 and requires 2,000 square feet of floor space. Each machine B costs $50,000 and requires 3,000 square feet of floor space. Each machine C costs $40,000 and requires 5,000 square feet of floor space. The machines can produce 200, 250 and 350 units per day respectively. The plant can only afford $500,000 for all the machines and has at most 20,000 square feet of room for the machines. The company wants to buy as many machines as possible to maximize daily production.
Formulate the LP for this problem.
Formulate the LP for this problem.
فتح الحزمة
افتح القفل للوصول البطاقات البالغ عددها 88 في هذه المجموعة.
فتح الحزمة
k this deck
76
A hospital needs to determine how many nurses to hire to cover a 24 hour period. The nurses must work 8 consecutive hours but can start work at the start of 6 different shifts. They are paid different wages depending on when they start their shifts. The number of nurses required per 4-hour time period and their wages are shown in the following table.
Formulate the LP for this problem.
Formulate the LP for this problem. فتح الحزمة
افتح القفل للوصول البطاقات البالغ عددها 88 في هذه المجموعة.
فتح الحزمة
k this deck
77
A company is planning production for the next 4 quarters. They want to minimize the cost of production. The production cost, demand and production capacity vary from quarter to quarter. The maximum amount of inventory which can be held is 100 units and management wants to keep at least 50 units on hand. Quarterly inventory holding cost is 4% of the cost of production. There are currently 50 units in inventory. The company wants to produce at no less than one half of its maximum capacity in any quarter.
What formulas are required for cells D3, D6, D8, D15, D17 and D18 in the Excel spreadsheet implementation of the formulation?
What formulas are required for cells D3, D6, D8, D15, D17 and D18 in the Excel spreadsheet implementation of the formulation? فتح الحزمة
افتح القفل للوصول البطاقات البالغ عددها 88 في هذه المجموعة.
فتح الحزمة
k this deck
78
State Farm Supply has just received an order for 10,000 pounds of chicken feed. The farmer has specified certain that the feed meet minimum requirements for Protein, Carbohydrate, Fat and Vitamins. State Farm can blend four different feeds to produce the required mix. The farmer would like to pay the lowest possible price for the feed. The data for the problem is summarized in the following table.
Formulate the LP for this problem.
Formulate the LP for this problem. فتح الحزمة
افتح القفل للوصول البطاقات البالغ عددها 88 في هذه المجموعة.
فتح الحزمة
k this deck
79
A grain store has six types of grain, each varying in cost, quality, and nutritional content. Periodically, excess inventory of these grains are consolidated into two local products, Feed-M-All and Supreme-Feed. Feed-M-All sells for $6.50 for a 10-pound bag while Supreme-Feed sells for $8.50 for a 10-pound bag. These feeds are advertised as having the following nutritional content:
The component grains have the following content characteristics:
Targets for Feed-M-All are a cost of $ 4.35 per 10-pound bag, a quality rating of 2.25, along with the minimum percentages of protein and fat, and the maximum percentage of carbohydrates. Similar targets are set for Supreme-Feed with cost set at $ 4.60 and quality at 2.45. There must be at least a 70%-30% mix among these two local feeds.
Formulate an LP model for this product mix problem.
The component grains have the following content characteristics: Targets for Feed-M-All are a cost of $ 4.35 per 10-pound bag, a quality rating of 2.25, along with the minimum percentages of protein and fat, and the maximum percentage of carbohydrates. Similar targets are set for Supreme-Feed with cost set at $ 4.60 and quality at 2.45. There must be at least a 70%-30% mix among these two local feeds.Formulate an LP model for this product mix problem.
فتح الحزمة
افتح القفل للوصول البطاقات البالغ عددها 88 في هذه المجموعة.
فتح الحزمة
k this deck
80
A hospital needs to determine how many nurses to hire to cover a 24 hour period. The nurses must work 8 consecutive hours but can start work at the start of 6 different shifts. They are paid different wages depending on when they start their shifts. The number of nurses required per 4-hour time period and their wages are shown in the following table.
What values would you enter in the Risk Solver Platform (RSP) task pane for the following cells for this Excel spreadsheet implementation of the formulation for this problem?
Objective Cell:
Variables Cells:
Constraints Cells:
What values would you enter in the Risk Solver Platform (RSP) task pane for the following cells for this Excel spreadsheet implementation of the formulation for this problem?Objective Cell:
Variables Cells:
Constraints Cells:
فتح الحزمة
افتح القفل للوصول البطاقات البالغ عددها 88 في هذه المجموعة.
فتح الحزمة
k this deck
فتح الحزمة
افتح القفل للوصول البطاقات البالغ عددها 88 في هذه المجموعة.


