Deck 3: Numerical Descriptive Measures
ملء الشاشة (f)
سؤال
سؤال
سؤال
سؤال
سؤال
سؤال
سؤال
سؤال
سؤال
سؤال
سؤال
سؤال
سؤال
سؤال
سؤال
سؤال
سؤال
سؤال
سؤال
سؤال
سؤال
سؤال
سؤال
سؤال
سؤال
سؤال
سؤال

In the 2002- 2003 academic year, many public universities in the United States raised tuition and fees due to a decrease in state subsidies. The change in the cost of tuition, a shared dormitory room, and the most popular meal plan from the
2001- 2002 academic year for a sample of 10 public universities were as follows: $1589, $593, $1223, $869, $423, $1720, $708,
$1425, $922 and $308.
Referring to Table 3-9, what is the standard deviation of the change in the cost?
سؤال
سؤال
سؤال
سؤال
سؤال
سؤال
سؤال
سؤال
سؤال
سؤال
سؤال
سؤال
سؤال
سؤال
 The data below represent the amount of grams of carbohydrates in a serving of breakfast cereal in a sample of 11 different servings.
Referring to Table 3-2, construct a boxplot for the carbohydrate amounts.
سؤال
سؤال
سؤال
سؤال
سؤال
TABLE 3-8
Given below is the frequency distribution of the number of defective tomatoes in 50 different shipments.
Referring to Table 3-8, what is the approximate mean number of defective tomatoes?
Given below is the frequency distribution of the number of defective tomatoes in 50 different shipments.
Referring to Table 3-8, what is the approximate mean number of defective tomatoes?
سؤال
سؤال
TABLE 3-1
Health care issues are receiving much attention in both academic and political arenas. A sociologist recently conducted a survey of citizens over 60 years of age whose net worth is too high to qualify for Medicaid and have no private health insurance. The ages of 25 uninsured senior citizens were as follows:

Referring to Table 3-1, identify the third quartile of the ages of the uninsured senior citizens.
Health care issues are receiving much attention in both academic and political arenas. A sociologist recently conducted a survey of citizens over 60 years of age whose net worth is too high to qualify for Medicaid and have no private health insurance. The ages of 25 uninsured senior citizens were as follows:
Referring to Table 3-1, identify the third quartile of the ages of the uninsured senior citizens.
سؤال
سؤال
سؤال
TABLE 3-10
The time period from 2000 to 2003 saw a great deal of volatility in the value of stocks. The data in the following table represent the total rate of return of the Dow Jones Industrial Index, the Standard & Poor's 500, the Russell 2000 Index, and the Wilshire 5000 Index from 2000 to 2003.
Referring to Table 3-10, calculate the geometric mean rate of return for the Standard & Poor's 500.
سؤال
سؤال

Health care issues are receiving much attention in both academic and political arenas. A sociologist recently conducted a survey of citizens over 60 years of age whose net worth is too high to qualify for Medicaid and have no private health insurance. The ages of 25 uninsured senior citizens were as follows:

Referring to Table 3-1, identify the interquartile range of the ages of the uninsured senior citizens.
سؤال
سؤال
 Given below is the frequency distribution of the number of defective tomatoes in 50 different shipments.
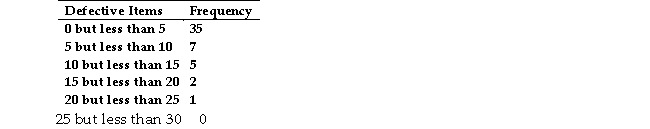
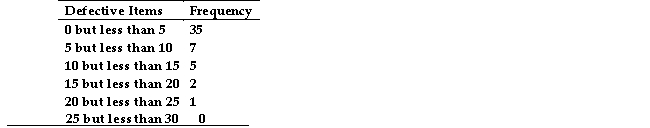
Referring to Table 3-8, what is the approximate variance?
سؤال
سؤال
سؤال
سؤال
سؤال
سؤال
سؤال
سؤال
سؤال
سؤال
سؤال
TABLE 3-1
Health care issues are receiving much attention in both academic and political arenas. A sociologist recently conducted a survey of citizens over 60 years of age whose net worth is too high to qualify for Medicaid and have no private health insurance. The ages of 25 uninsured senior citizens were as follows:

Referring to Table 3-1, calculate the standard deviation of the ages of the uninsured senior citizens correct to the nearest hundredth of a year.
Health care issues are receiving much attention in both academic and political arenas. A sociologist recently conducted a survey of citizens over 60 years of age whose net worth is too high to qualify for Medicaid and have no private health insurance. The ages of 25 uninsured senior citizens were as follows:
Referring to Table 3-1, calculate the standard deviation of the ages of the uninsured senior citizens correct to the nearest hundredth of a year.
سؤال
سؤال
سؤال
سؤال
TABLE 3-1
Health care issues are receiving much attention in both academic and political arenas. A sociologist recently conducted a survey of citizens over 60 years of age whose net worth is too high to qualify for Medicaid and have no private health insurance. The ages of 25 uninsured senior citizens were as follows:

Referring to Table 3-1, calculate the coefficient of variation of the ages of the uninsured senior citizens.
Health care issues are receiving much attention in both academic and political arenas. A sociologist recently conducted a survey of citizens over 60 years of age whose net worth is too high to qualify for Medicaid and have no private health insurance. The ages of 25 uninsured senior citizens were as follows:
Referring to Table 3-1, calculate the coefficient of variation of the ages of the uninsured senior citizens.
سؤال
سؤال
سؤال
سؤال
 The data below represent the amount of grams of carbohydrates in a serving of breakfast cereal in a sample of 11 different servings.
Referring to Table 3-2, what type of shape does the distribution of the sample appear to have?
سؤال
سؤال
 Health care issues are receiving much attention in both academic and political arenas. A sociologist recently conducted a survey of citizens over 60 years of age whose net worth is too high to qualify for Medicaid and have no private health insurance. The ages of 25 uninsured senior citizens were as follows:
Referring to Table 3-1, identify the first quartile of the ages of the uninsured senior citizens.
سؤال
سؤال
سؤال
سؤال

فتح الحزمة
قم بالتسجيل لفتح البطاقات في هذه المجموعة!
Unlock Deck
Unlock Deck
1/138
العب
ملء الشاشة (f)
Deck 3: Numerical Descriptive Measures
1
Which of the following statistics is not a measure of central tendency?
A) mode
B) median
C) Q3
D) arithmetic mean
A) mode
B) median
C) Q3
D) arithmetic mean
C
2
When extreme values are present in a set of data, which of the following descriptive summary measures are most appropriate?
A) variance and interquartile range
B) arithmetic mean and standard deviation
C) interquartile range and median
D) CV and range
A) variance and interquartile range
B) arithmetic mean and standard deviation
C) interquartile range and median
D) CV and range
C
3
Which descriptive summary measures are considered to be resistant statistics?
A) the interquartile range and range
B) the arithmetic mean and standard deviation
C) the mode and variance
D) the median and interquartile range
A) the interquartile range and range
B) the arithmetic mean and standard deviation
C) the mode and variance
D) the median and interquartile range
D
4
In general, which of the following descriptive summary measures cannot be easily approximated from a boxplot?
A) the variance
B) the median
C) the interquartile range
D) the range
A) the variance
B) the median
C) the interquartile range
D) the range
فتح الحزمة
افتح القفل للوصول البطاقات البالغ عددها 138 في هذه المجموعة.
فتح الحزمة
k this deck
5
According to the Chebyshev rule, at least what percentage of the observations in any data set are contained within a distance of 2 standard deviations around the mean?
A) 88.89%
B) 75%
C) 67%
D) 95%
A) 88.89%
B) 75%
C) 67%
D) 95%
فتح الحزمة
افتح القفل للوصول البطاقات البالغ عددها 138 في هذه المجموعة.
فتح الحزمة
k this deck
6
According to the empirical rule, if the data form a "bell-shaped" normal distribution, percent of the observations will be contained within 3 standard deviations around the arithmetic mean.
A) 99.7
B) 68.26
C) 95.0
D) 75.00
A) 99.7
B) 68.26
C) 95.0
D) 75.00
فتح الحزمة
افتح القفل للوصول البطاقات البالغ عددها 138 في هذه المجموعة.
فتح الحزمة
k this deck
7
In right-skewed distributions, which of the following is the correct statement?
A) The distance from Q1 to Q2 is smaller than the distance from Q2 to Q3.
B) The arithmetic mean is smaller than the median.
C) The mode is larger than the arithmetic mean.
D) The distance from Q1 to Q2 is larger than the distance from Q2 to Q3.
A) The distance from Q1 to Q2 is smaller than the distance from Q2 to Q3.
B) The arithmetic mean is smaller than the median.
C) The mode is larger than the arithmetic mean.
D) The distance from Q1 to Q2 is larger than the distance from Q2 to Q3.
فتح الحزمة
افتح القفل للوصول البطاقات البالغ عددها 138 في هذه المجموعة.
فتح الحزمة
k this deck
8
In left-skewed distributions, which of the following is the correct statement?
A) The distance from Q1 to Q3 is twice the distance from the Q1 to Q2.
B) The distance from the smallest observation to Q1 is larger than the distance from Q3 to the largest observation.
C) The distance from the smallest observation to Q2 is smaller than the distance from Q2 to the largest observation.
D) The distance from Q1 to Q2 is smaller than the distance from Q2 to Q3.
فتح الحزمة
افتح القفل للوصول البطاقات البالغ عددها 138 في هذه المجموعة.
فتح الحزمة
k this deck
9
The smaller the spread of scores around the arithmetic mean
A) the smaller the standard deviation.
B) the smaller the interquartile range.
C) the smaller the coefficient of variation.
D) all of the above
A) the smaller the standard deviation.
B) the smaller the interquartile range.
C) the smaller the coefficient of variation.
D) all of the above
فتح الحزمة
افتح القفل للوصول البطاقات البالغ عددها 138 في هذه المجموعة.
فتح الحزمة
k this deck
10
Which of the following is the easiest to compute?
A) the median
B) the mode
C) the geometric mean
D) the arithmetic mean
A) the median
B) the mode
C) the geometric mean
D) the arithmetic mean
فتح الحزمة
افتح القفل للوصول البطاقات البالغ عددها 138 في هذه المجموعة.
فتح الحزمة
k this deck
11
According to the Chebyshev rule, at least 93.75% of all observations in any data set are contained within a distance of how many standard deviations around the mean?
A) 1
B) 2
C) 3
D) 4
A) 1
B) 2
C) 3
D) 4
فتح الحزمة
افتح القفل للوصول البطاقات البالغ عددها 138 في هذه المجموعة.
فتح الحزمة
k this deck
12
According to the Chebyshev rule, at least 75% of all observations in any data set are contained within a distance of how many standard deviations around the mean?
A) 1
B) 2
C) 3
D) 4
A) 1
B) 2
C) 3
D) 4
فتح الحزمة
افتح القفل للوصول البطاقات البالغ عددها 138 في هذه المجموعة.
فتح الحزمة
k this deck
13
Which measure of central tendency can be used for both numerical and categorical variables?
A) geometric mean
B) median
C) arithmetic mean
D) mode
A) geometric mean
B) median
C) arithmetic mean
D) mode
فتح الحزمة
افتح القفل للوصول البطاقات البالغ عددها 138 في هذه المجموعة.
فتح الحزمة
k this deck
14
According to the empirical rule, if the data form a "bell-shaped" normal distribution, _________percent of the observations will be contained within 2 standard deviations around the arithmetic mean.
A) 93.75
B) 95.44
C) 68.26
D) 88.89
A) 93.75
B) 95.44
C) 68.26
D) 88.89
فتح الحزمة
افتح القفل للوصول البطاقات البالغ عددها 138 في هذه المجموعة.
فتح الحزمة
k this deck
15
TABLE 3-1
Health care issues are receiving much attention in both academic and political arenas. A sociologist recently conducted a survey of citizens over 60 years of age whose net worth is too high to qualify for Medicaid and have no private health insurance. The ages of 25 uninsured senior citizens were as follows:
-Referring to Table 3-1, identify which of the following is the correct statement.
A) The middle 50% of the senior citizens sampled are between 65.5 and 73.0 years of age.
B) 25% of the senior citizens sampled are older than 81.5 years of age.
C) One fourth of the senior citizens sampled are below 64 years of age.
D) All of the above are correct.
فتح الحزمة
افتح القفل للوصول البطاقات البالغ عددها 138 في هذه المجموعة.
فتح الحزمة
k this deck
16
In a right-skewed distribution
A) the median is less than the arithmetic mean.
B) the median equals the arithmetic mean.
C) the median is larger than the arithmetic mean.
D) none of the above
A) the median is less than the arithmetic mean.
B) the median equals the arithmetic mean.
C) the median is larger than the arithmetic mean.
D) none of the above
فتح الحزمة
افتح القفل للوصول البطاقات البالغ عددها 138 في هذه المجموعة.
فتح الحزمة
k this deck
17
In a perfectly symmetrical bell-shaped "normal" distribution
A) the arithmetic mean equals the mode.
B) the arithmetic mean equals the median.
C) the median equals the mode.
D) all of the above
A) the arithmetic mean equals the mode.
B) the arithmetic mean equals the median.
C) the median equals the mode.
D) all of the above
فتح الحزمة
افتح القفل للوصول البطاقات البالغ عددها 138 في هذه المجموعة.
فتح الحزمة
k this deck
18
In perfectly symmetrical distributions, which of the following is not a correct statement?
A) The distance from the smallest observation to Q2 is the same as the distance from Q2 to the largest observation.
B) The distance from the smallest observation to Q1 is the same as the distance from Q3 to the largest observation.
C) The distance from Q1 to Q3 is half of the distance from the smallest to the largest observation.
D) The distance from Q1 to Q2 equals to the distance from Q2 to Q3.
فتح الحزمة
افتح القفل للوصول البطاقات البالغ عددها 138 في هذه المجموعة.
فتح الحزمة
k this deck
19
Which of the following is sensitive to extreme values?
A) the arithmetic mean
B) the median
C) the interquartile range
D) the 1st quartile
A) the arithmetic mean
B) the median
C) the interquartile range
D) the 1st quartile
فتح الحزمة
افتح القفل للوصول البطاقات البالغ عددها 138 في هذه المجموعة.
فتح الحزمة
k this deck
20
According to the empirical rule, if the data form a "bell-shaped" normal distribution, percent of the observations will be contained within 1 standard deviation around the arithmetic mean.
A) 93.75
B) 88.89
C) 75.00
D) 68.26
A) 93.75
B) 88.89
C) 75.00
D) 68.26
فتح الحزمة
افتح القفل للوصول البطاقات البالغ عددها 138 في هذه المجموعة.
فتح الحزمة
k this deck
21
Which of the following statements about the median is not true?
A) It is equal to Q2.
B) It is a measure of central tendency.
C) It is more affected by extreme values than the arithmetic mean.
D) It is equal to the mode in bell-shaped "normal" distributions.
A) It is equal to Q2.
B) It is a measure of central tendency.
C) It is more affected by extreme values than the arithmetic mean.
D) It is equal to the mode in bell-shaped "normal" distributions.
فتح الحزمة
افتح القفل للوصول البطاقات البالغ عددها 138 في هذه المجموعة.
فتح الحزمة
k this deck
22
TABLE 3-1
Health care issues are receiving much attention in both academic and political arenas. A sociologist recently conducted a
survey of citizens over 60 years of age whose net worth is too high to qualify for Medicaid and have no private health
insurance. The ages of 25 uninsured senior citizens were as follows:
-Referring to Table 3-4, the five-number summary for the data in the customs sample consists of ____, ____ , _____, ______, and ____ .
فتح الحزمة
افتح القفل للوصول البطاقات البالغ عددها 138 في هذه المجموعة.
فتح الحزمة
k this deck
23
TABLE 3-2
The data below represent the amount of grams of carbohydrates in a serving of breakfast cereal in a sample of 11 different servings.
-Referring to Table 3-2, the range in the carbohydrate amounts is ____grams.
The data below represent the amount of grams of carbohydrates in a serving of breakfast cereal in a sample of 11 different servings.
-Referring to Table 3-2, the range in the carbohydrate amounts is ____grams.
فتح الحزمة
افتح القفل للوصول البطاقات البالغ عددها 138 في هذه المجموعة.
فتح الحزمة
k this deck
24
TABLE 3-2
The data below represent the amount of grams of carbohydrates in a serving of breakfast cereal in a sample of 11 different servings.
-Referring to Table 3-2, the coefficient of variation of the carbohydrate amounts is _____percent.
The data below represent the amount of grams of carbohydrates in a serving of breakfast cereal in a sample of 11 different servings.
-Referring to Table 3-2, the coefficient of variation of the carbohydrate amounts is _____percent.
فتح الحزمة
افتح القفل للوصول البطاقات البالغ عددها 138 في هذه المجموعة.
فتح الحزمة
k this deck
25
TABLE 3-9
In the 2002- 2003 academic year, many public universities in the United States raised tuition and fees due to a decrease in state subsidies. The change in the cost of tuition, a shared dormitory room, and the most popular meal plan from the 2001- 2002 academic year for a sample of 10 public universities were as follows: $1589, $593, $1223, $869, $423, $1720, $708, $1425, $922 and $308.
-Referring to Table 3-9, are the data skewed? If so, how?
فتح الحزمة
افتح القفل للوصول البطاقات البالغ عددها 138 في هذه المجموعة.
فتح الحزمة
k this deck
26
Given below is the frequency distribution of the 12-month rate of return achieved by 30 stocks.
-Referring to Table 3-7, what is the approximate standard deviation?
-Referring to Table 3-7, what is the approximate standard deviation?
فتح الحزمة
افتح القفل للوصول البطاقات البالغ عددها 138 في هذه المجموعة.
فتح الحزمة
k this deck
27
In the 2002- 2003 academic year, many public universities in the United States raised tuition and fees due to a decrease in state subsidies. The change in the cost of tuition, a shared dormitory room, and the most popular meal plan from the
2001- 2002 academic year for a sample of 10 public universities were as follows: $1589, $593, $1223, $869, $423, $1720, $708,
$1425, $922 and $308.
Referring to Table 3-9, what is the standard deviation of the change in the cost?
فتح الحزمة
افتح القفل للوصول البطاقات البالغ عددها 138 في هذه المجموعة.
فتح الحزمة
k this deck
28
TABLE 3-12
The population of eight analysts at a software firm were asked to estimate the reuse rate when developing a new software system. The following data are given as a percentage of the total code written for a software system that is part of the reuse database.
50, 62.5, 37.5, 75.0, 45.0, 47.5, 15.0, 25.0
Referring to Table 3-12, what is the mean percentage of the total code that is part of the reuse database?
فتح الحزمة
افتح القفل للوصول البطاقات البالغ عددها 138 في هذه المجموعة.
فتح الحزمة
k this deck
29
The data below represent the amount of grams of carbohydrates in a serving of breakfast cereal in a sample of 11 different servings.
-Referring to Table 3-2, the arithmetic mean carbohydrates in this sample is _____grams.
-Referring to Table 3-2, the arithmetic mean carbohydrates in this sample is _____grams.
فتح الحزمة
افتح القفل للوصول البطاقات البالغ عددها 138 في هذه المجموعة.
فتح الحزمة
k this deck
30
Which of the following is not a measure of central tendency?
A) the interquartile range
B) the arithmetic mean
C) the mode
D) the geometric mean
A) the interquartile range
B) the arithmetic mean
C) the mode
D) the geometric mean
فتح الحزمة
افتح القفل للوصول البطاقات البالغ عددها 138 في هذه المجموعة.
فتح الحزمة
k this deck
31
According to the Chebyshev rule, at least what percentage of the observations in any data set are contained within a distance of 3 standard deviations around the mean?
A) 99.7%
B) 88.89%
C) 75%
D) 67%
A) 99.7%
B) 88.89%
C) 75%
D) 67%
فتح الحزمة
افتح القفل للوصول البطاقات البالغ عددها 138 في هذه المجموعة.
فتح الحزمة
k this deck
32
The data below represent the amount of grams of carbohydrates in a serving of breakfast cereal in a sample of 11 different servings.
-Referring to Table 3-2, the variance of the carbohydrate amounts is_______ (grams squared).
-Referring to Table 3-2, the variance of the carbohydrate amounts is_______ (grams squared).
فتح الحزمة
افتح القفل للوصول البطاقات البالغ عددها 138 في هذه المجموعة.
فتح الحزمة
k this deck
33
TABLE 3-3
The stem-and-leaf display below represents the number of vitamin supplements sold by a health food store in a sample of 16 days.
Note (1): 1H means the "high teens" - 15, 16, 17, 18, or 19; 2L means the "low twenties" - 20, 21, 22, 23, or 24; 2H means
the "high twenties" - 25, 26, 27, 28, or 29, etc.
Note (2): For this sample, the sum of the observations is 448, the sum of the squares of the observations is 13,356, and the sum of the squared differences between each observation and the mean is 812.
-Referring to Table 3-3, the coefficient of variation of the number of vitamin supplements sold in this sample is_________ percent.
فتح الحزمة
افتح القفل للوصول البطاقات البالغ عددها 138 في هذه المجموعة.
فتح الحزمة
k this deck
34
In a perfectly symmetrical distribution
A) the range equals the interquartile range.
B) the median equals the arithmetic mean.
C) the interquartile range equals the arithmetic mean.
D) the variance equals the standard deviation.
A) the range equals the interquartile range.
B) the median equals the arithmetic mean.
C) the interquartile range equals the arithmetic mean.
D) the variance equals the standard deviation.
فتح الحزمة
افتح القفل للوصول البطاقات البالغ عددها 138 في هذه المجموعة.
فتح الحزمة
k this deck
35
Which of the arithmetic mean, median, mode, and geometric mean are resistant measures of central tendency?
A) the arithmetic mean and median only
B) the median and mode only
C) the arithmetic mean and mode only
D) the mode and geometric mean only
A) the arithmetic mean and median only
B) the median and mode only
C) the arithmetic mean and mode only
D) the mode and geometric mean only
فتح الحزمة
افتح القفل للوصول البطاقات البالغ عددها 138 في هذه المجموعة.
فتح الحزمة
k this deck
36
TABLE 3-1
Health care issues are receiving much attention in both academic and political arenas. A sociologist recently conducted a
survey of citizens over 60 years of age whose net worth is too high to qualify for Medicaid and have no private health
insurance. The ages of 25 uninsured senior citizens were as follows:
-Referring to Table 3-1, identify the median age of the uninsured senior citizens.
فتح الحزمة
افتح القفل للوصول البطاقات البالغ عددها 138 في هذه المجموعة.
فتح الحزمة
k this deck
37
Which of the following is not sensitive to extreme values?
A) the range
B) the standard deviation
C) the coefficient of variation
D) the interquartile range
A) the range
B) the standard deviation
C) the coefficient of variation
D) the interquartile range
فتح الحزمة
افتح القفل للوصول البطاقات البالغ عددها 138 في هذه المجموعة.
فتح الحزمة
k this deck
38
TABLE 3-4
The stem-and-leaf display below represents the number of cargo manifests approved by customs inspectors of the Port of New York in a sample of 35 days.
Note (1): 1H means the "high teens" - 15, 16, 17, 18, or 19; 2L means the "low twenties" - 20, 21, 22, 23, or 24; 2H means
the "high twenties" - 25, 26, 27, 28, or 29, etc.
Note (2): For this sample, the sum of the observations is 838, the sum of the squares of the observations is 20,684, and the sum of the squared differences between each observation and the mean is 619.89.
-Referring to Table 3-4, the first quartile of the customs data is_____ .
فتح الحزمة
افتح القفل للوصول البطاقات البالغ عددها 138 في هذه المجموعة.
فتح الحزمة
k this deck
39
Healthcare issues are receiving muchattentionin bothacademic and political arenas. A sociologistrecently conducted a survey of citizens over 60 years of age whose net worthis too high to qualify for Medicaid and have no private health insurance. The ages of 25 uninsured senior citizens were as follows:
-Referring to Table 3-1, identify which of the following is the correct statement.
A) The average age of senior citizens sampled is 73.5 years of age.
B) One fourth of the senior citizens sampled are below 65.5 years of age.
C) The middle 50% of the senior citizens sampled are between 65.5 and 73.0 years of age.
D) All of the above are correct.
فتح الحزمة
افتح القفل للوصول البطاقات البالغ عددها 138 في هذه المجموعة.
فتح الحزمة
k this deck
40
TABLE 3-5
The rate of return of a Fortune 500 company over the past 15 years are: 3.17%, 4.43%, 5.93%, 5.43%, 7.29%, 8.21%, 6.23%,
5.23%, 4.34%, 6.68%, 7.14%, -5.56%, -5.23%, -5.73%, -10.34%
Referring to Table 3-5, what is the shape of the distribution for the rate of return?
The rate of return of a Fortune 500 company over the past 15 years are: 3.17%, 4.43%, 5.93%, 5.43%, 7.29%, 8.21%, 6.23%,
5.23%, 4.34%, 6.68%, 7.14%, -5.56%, -5.23%, -5.73%, -10.34%
Referring to Table 3-5, what is the shape of the distribution for the rate of return?
فتح الحزمة
افتح القفل للوصول البطاقات البالغ عددها 138 في هذه المجموعة.
فتح الحزمة
k this deck
41
The data below represent the amount of grams of carbohydrates in a serving of breakfast cereal in a sample of 11 different servings.Referring to Table 3-2, construct a boxplot for the carbohydrate amounts.
فتح الحزمة
افتح القفل للوصول البطاقات البالغ عددها 138 في هذه المجموعة.
فتح الحزمة
k this deck
42
TABLE 3-9
In the 2002- 2003 academic year, many public universities in the United States raised tuition and fees due to a decrease in state subsidies. The change in the cost of tuition, a shared dormitory room, and the most popular meal plan from the
2001- 2002 academic year for a sample of 10 public universities were as follows: $1589, $593, $1223, $869, $423, $1720, $708,
$1425, $922 and $308.
Referring to Table 3-9, what are the five-number summary of the change in the cost?
فتح الحزمة
افتح القفل للوصول البطاقات البالغ عددها 138 في هذه المجموعة.
فتح الحزمة
k this deck
43
The 12-month rate of returns over a nine- year period of a particular stock is 0.099, - 0.289, 0.089, 0.226, 0.041, 0.161, 0.064, - 0.029 and 0.022. The geometric mean rate of return for this stock is ________.
فتح الحزمة
افتح القفل للوصول البطاقات البالغ عددها 138 في هذه المجموعة.
فتح الحزمة
k this deck
44
The data below represent the amount of grams of carbohydrates in a serving of breakfast cereal in a sample of 11 different servings.
-Referring to Table 3-2, the five-number summary of the carbohydrate amounts consists of_____,_____ ,_____ ,_____ , and ______.
-Referring to Table 3-2, the five-number summary of the carbohydrate amounts consists of_____,_____ ,_____ ,_____ , and ______.
فتح الحزمة
افتح القفل للوصول البطاقات البالغ عددها 138 في هذه المجموعة.
فتح الحزمة
k this deck
45
TABLE 3-6
The rate of return of an Internet Service Provider over a 10- year period are: 10.25%, 12.64%, 8.37%, 9.29%, 6.23%, 42.53%,
29.23%, 15.25%, 21.52%, -2.35%.
Referring to Table 3-6, compute the geometric mean rate of return.
The rate of return of an Internet Service Provider over a 10- year period are: 10.25%, 12.64%, 8.37%, 9.29%, 6.23%, 42.53%,
29.23%, 15.25%, 21.52%, -2.35%.
Referring to Table 3-6, compute the geometric mean rate of return.
فتح الحزمة
افتح القفل للوصول البطاقات البالغ عددها 138 في هذه المجموعة.
فتح الحزمة
k this deck
46
TABLE 3-8
Given below is the frequency distribution of the number of defective tomatoes in 50 different shipments.
Referring to Table 3-8, what is the approximate mean number of defective tomatoes?
Given below is the frequency distribution of the number of defective tomatoes in 50 different shipments.
Referring to Table 3-8, what is the approximate mean number of defective tomatoes?
فتح الحزمة
افتح القفل للوصول البطاقات البالغ عددها 138 في هذه المجموعة.
فتح الحزمة
k this deck
47
TABLE 3-11
The following table represents the assets in billions of dollars of the five largest bond funds.
-Referring to Table 3-11, what are the variance and standard deviation for this population?
The following table represents the assets in billions of dollars of the five largest bond funds.
-Referring to Table 3-11, what are the variance and standard deviation for this population?
فتح الحزمة
افتح القفل للوصول البطاقات البالغ عددها 138 في هذه المجموعة.
فتح الحزمة
k this deck
48
TABLE 3-1
Health care issues are receiving much attention in both academic and political arenas. A sociologist recently conducted a survey of citizens over 60 years of age whose net worth is too high to qualify for Medicaid and have no private health insurance. The ages of 25 uninsured senior citizens were as follows:
Referring to Table 3-1, identify the third quartile of the ages of the uninsured senior citizens.
فتح الحزمة
افتح القفل للوصول البطاقات البالغ عددها 138 في هذه المجموعة.
فتح الحزمة
k this deck
49
The rate of return of an Internet Service Provider over a 10- year period are: 10.25%, 12.64%, 8.37%, 9.29%, 6.23%, 42.53%,
29.23%, 15.25%, 21.52%, -2.35%.
-Referring to Table 3-6, construct a boxplot for the rate of return
29.23%, 15.25%, 21.52%, -2.35%.
-Referring to Table 3-6, construct a boxplot for the rate of return
فتح الحزمة
افتح القفل للوصول البطاقات البالغ عددها 138 في هذه المجموعة.
فتح الحزمة
k this deck
50
TABLE 3-7
Given below is the frequency distribution of the 12-month rate of return achieved by 30 stocks.
-Referring to Table 3-7, what is the approximate mean rate of return?
Given below is the frequency distribution of the 12-month rate of return achieved by 30 stocks.
-Referring to Table 3-7, what is the approximate mean rate of return?
فتح الحزمة
افتح القفل للوصول البطاقات البالغ عددها 138 في هذه المجموعة.
فتح الحزمة
k this deck
51
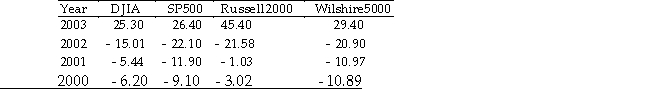
TABLE 3-10
The time period from 2000 to 2003 saw a great deal of volatility in the value of stocks. The data in the following table represent the total rate of return of the Dow Jones Industrial Index, the Standard & Poor's 500, the Russell 2000 Index, and the Wilshire 5000 Index from 2000 to 2003.
Referring to Table 3-10, calculate the geometric mean rate of return for the Standard & Poor's 500.
The time period from 2000 to 2003 saw a great deal of volatility in the value of stocks. The data in the following table represent the total rate of return of the Dow Jones Industrial Index, the Standard & Poor's 500, the Russell 2000 Index, and the Wilshire 5000 Index from 2000 to 2003.
Referring to Table 3-10, calculate the geometric mean rate of return for the Standard & Poor's 500.
فتح الحزمة
افتح القفل للوصول البطاقات البالغ عددها 138 في هذه المجموعة.
فتح الحزمة
k this deck
52
TABLE 3-4
The stem-and-leaf display below represents the number of cargo manifests approved by customs inspectors of the Port of New York in a sample of 35 days.
Note (1): 1H means the "high teens" - 15, 16, 17, 18, or 19; 2L means the "low twenties" - 20, 21, 22, 23, or 24; 2H means
the "high twenties" - 25, 26, 27, 28, or 29, etc.
Note (2): For this sample, the sum of the observations is 838, the sum of the squares of the observations is 20,684, and the sum of the squared differences between each observation and the mean is 619.89.
-Referring to Table 3-4, the interquartile range of the customs data is ____.
فتح الحزمة
افتح القفل للوصول البطاقات البالغ عددها 138 في هذه المجموعة.
فتح الحزمة
k this deck
53
Health care issues are receiving much attention in both academic and political arenas. A sociologist recently conducted a survey of citizens over 60 years of age whose net worth is too high to qualify for Medicaid and have no private health insurance. The ages of 25 uninsured senior citizens were as follows:
Referring to Table 3-1, identify the interquartile range of the ages of the uninsured senior citizens.
فتح الحزمة
افتح القفل للوصول البطاقات البالغ عددها 138 في هذه المجموعة.
فتح الحزمة
k this deck
54
The stem-and-leaf display below represents the number of cargo manifests approved by customs inspectors of the Port of New York in a sample of 35 days.
Note (1): 1H means the "high teens" - 15, 16, 17, 18, or 19; 2L means the "low twenties" - 20, 21, 22, 23, or 24; 2H means
the "high twenties" - 25, 26, 27, 28, or 29, etc.
Note (2): For this sample, the sum of the observations is 838, the sum of the squares of the observations is 20,684, and the sum of the squared differences between each observation and the mean is 619.89.
-Referring to Table 3-4, the range of the customs data is_______ .
فتح الحزمة
افتح القفل للوصول البطاقات البالغ عددها 138 في هذه المجموعة.
فتح الحزمة
k this deck
55
Given below is the frequency distribution of the number of defective tomatoes in 50 different shipments.Referring to Table 3-8, what is the approximate variance?
فتح الحزمة
افتح القفل للوصول البطاقات البالغ عددها 138 في هذه المجموعة.
فتح الحزمة
k this deck
56
The stem-and-leaf display below represents the number of vitamin supplements sold by a health food store in a sample of 16 days.
Note (1): 1H means the "high teens" - 15, 16, 17, 18, or 19; 2L means the "low twenties" - 20, 21, 22, 23, or 24; 2H means
the "high twenties" - 25, 26, 27, 28, or 29, etc.
Note (2): For this sample, the sum of the observations is 448, the sum of the squares of the observations is 13,356, and the sum of the squared differences between each observation and the mean is 812.
-Referring to Table 3-3, the arithmetic mean of the number of vitamin supplements sold in this sample is ______.
فتح الحزمة
افتح القفل للوصول البطاقات البالغ عددها 138 في هذه المجموعة.
فتح الحزمة
k this deck
57
TABLE 3-5
The rate of return of a Fortune 500 company over the past 15 years are: 3.17%, 4.43%, 5.93%, 5.43%, 7.29%, 8.21%, 6.23%,
5.23%, 4.34%, 6.68%, 7.14%, -5.56%, -5.23%, -5.73%, -10.34%
Referring to Table 3-5, compute the geometric mean rate of return.
The rate of return of a Fortune 500 company over the past 15 years are: 3.17%, 4.43%, 5.93%, 5.43%, 7.29%, 8.21%, 6.23%,
5.23%, 4.34%, 6.68%, 7.14%, -5.56%, -5.23%, -5.73%, -10.34%
Referring to Table 3-5, compute the geometric mean rate of return.
فتح الحزمة
افتح القفل للوصول البطاقات البالغ عددها 138 في هذه المجموعة.
فتح الحزمة
k this deck
58
TABLE 3-4
The stem-and-leaf display below represents the number of cargo manifests approved by customs inspectors of the Port of New York in a sample of 35 days.
Note (1): 1H means the "high teens" - 15, 16, 17, 18, or 19; 2L means the "low twenties" - 20, 21, 22, 23, or 24; 2H means
the "high twenties" - 25, 26, 27, 28, or 29, etc.
Note (2): For this sample, the sum of the observations is 838, the sum of the squares of the observations is 20,684, and the sum of the squared differences between each observation and the mean is 619.89.
-Referring to Table 3-4, construct a boxplot of this sample.
فتح الحزمة
افتح القفل للوصول البطاقات البالغ عددها 138 في هذه المجموعة.
فتح الحزمة
k this deck
59
TABLE 3-5
The rate of return of a Fortune 500 company over the past 15 years are: 3.17%, 4.43%, 5.93%, 5.43%, 7.29%, 8.21%, 6.23%,
5.23%, 4.34%, 6.68%, 7.14%, -5.56%, -5.23%, -5.73%, -10.34%
Referring to Table 3-5, what is the range of the rate of return?
The rate of return of a Fortune 500 company over the past 15 years are: 3.17%, 4.43%, 5.93%, 5.43%, 7.29%, 8.21%, 6.23%,
5.23%, 4.34%, 6.68%, 7.14%, -5.56%, -5.23%, -5.73%, -10.34%
Referring to Table 3-5, what is the range of the rate of return?
فتح الحزمة
افتح القفل للوصول البطاقات البالغ عددها 138 في هذه المجموعة.
فتح الحزمة
k this deck
60
TABLE 3-9
In the 2002- 2003 academic year, many public universities in the United States raised tuition and fees due to a decrease in state subsidies. The change in the cost of tuition, a shared dormitory room, and the most popular meal plan from the
2001- 2002 academic year for a sample of 10 public universities were as follows: $1589, $593, $1223, $869, $423, $1720, $708,
$1425, $922 and $308.
Referring to Table 3-9, what is the mean and median change in the cost?
فتح الحزمة
افتح القفل للوصول البطاقات البالغ عددها 138 في هذه المجموعة.
فتح الحزمة
k this deck
61
The data below represent the amount of grams of carbohydrates in a serving of breakfast cereal in a sample of 11 different servings.
-Referring to Table 3-2, the standard deviation of the carbohydrate amounts is ____grams.
-Referring to Table 3-2, the standard deviation of the carbohydrate amounts is ____grams.
فتح الحزمة
افتح القفل للوصول البطاقات البالغ عددها 138 في هذه المجموعة.
فتح الحزمة
k this deck
62
TABLE 3-9
In the 2002- 2003 academic year, many public universities in the United States raised tuition and fees due to a decrease in state subsidies. The change in the cost of tuition, a shared dormitory room, and the most popular meal plan from the2001- 2002 academic year for a sample of 10 public universities were as follows: $1589, $593, $1223, $869, $423, $1720, $708, $1425, $922 and $308.
-Referring to Table 3-9, the middle 50% of the change in the cost is spread over what value?
فتح الحزمة
افتح القفل للوصول البطاقات البالغ عددها 138 في هذه المجموعة.
فتح الحزمة
k this deck
63
TABLE 3-3
The stem-and-leaf display below represents the number of vitamin supplements sold by a health food store in a sample of 16 days.
Note (1): 1H means the "high teens" - 15, 16, 17, 18, or 19; 2L means the "low twenties" - 20, 21, 22, 23, or 24; 2H means
the "high twenties" - 25, 26, 27, 28, or 29, etc.
Note (2): For this sample, the sum of the observations is 448, the sum of the squares of the observations is 13,356, and the sum of the squared differences between each observation and the mean is 812.
-Referring to Table 3-3, what type of shape does the distribution of the sample appear to have?
فتح الحزمة
افتح القفل للوصول البطاقات البالغ عددها 138 في هذه المجموعة.
فتح الحزمة
k this deck
64
TABLE 3-3
The stem-and-leaf display below represents the number of vitamin supplements sold by a health food store in a sample of 16 days.
Note (1): 1H means the "high teens" - 15, 16, 17, 18, or 19; 2L means the "low twenties" - 20, 21, 22, 23, or 24; 2H means
the "high twenties" - 25, 26, 27, 28, or 29, etc.
Note (2): For this sample, the sum of the observations is 448, the sum of the squares of the observations is 13,356, and the sum of the squared differences between each observation and the mean is 812.
-Referring to Table 3-3, the variance of the number of vitamin supplements sold in this sample is ______.
فتح الحزمة
افتح القفل للوصول البطاقات البالغ عددها 138 في هذه المجموعة.
فتح الحزمة
k this deck
65
TABLE 3-2
The data below represent the amount of grams of carbohydrates in a serving of breakfast cereal in a sample of 11 different servings.
-Referring to Table 3-2, the median carbohydrate amount in the cereal is____ grams.
The data below represent the amount of grams of carbohydrates in a serving of breakfast cereal in a sample of 11 different servings.
-Referring to Table 3-2, the median carbohydrate amount in the cereal is____ grams.
فتح الحزمة
افتح القفل للوصول البطاقات البالغ عددها 138 في هذه المجموعة.
فتح الحزمة
k this deck
66
TABLE 3-1
Health care issues are receiving much attention in both academic and political arenas. A sociologist recently conducted a survey of citizens over 60 years of age whose net worth is too high to qualify for Medicaid and have no private health insurance. The ages of 25 uninsured senior citizens were as follows:
Referring to Table 3-1, calculate the standard deviation of the ages of the uninsured senior citizens correct to the nearest hundredth of a year.
فتح الحزمة
افتح القفل للوصول البطاقات البالغ عددها 138 في هذه المجموعة.
فتح الحزمة
k this deck
67
TABLE 3-5
The rate of return of a Fortune 500 company over the past 15 years are: 3.17%, 4.43%, 5.93%, 5.43%, 7.29%, 8.21%, 6.23%, 5.23%, 4.34%, 6.68%, 7.14%, -5.56%, -5.23%, -5.73%, -10.34%
-Referring to Table 3-5, construct a boxplot for the rate of return.
The rate of return of a Fortune 500 company over the past 15 years are: 3.17%, 4.43%, 5.93%, 5.43%, 7.29%, 8.21%, 6.23%, 5.23%, 4.34%, 6.68%, 7.14%, -5.56%, -5.23%, -5.73%, -10.34%
-Referring to Table 3-5, construct a boxplot for the rate of return.
فتح الحزمة
افتح القفل للوصول البطاقات البالغ عددها 138 في هذه المجموعة.
فتح الحزمة
k this deck
68
TABLE 3-4
The stem-and-leaf display below represents the number of cargo manifests approved by customs inspectors of the Port of New York in a sample of 35 days.
Note (1): 1H means the "high teens" - 15, 16, 17, 18, or 19; 2L means the "low twenties" - 20, 21, 22, 23, or 24; 2H means
the "high twenties" - 25, 26, 27, 28, or 29, etc.
Note (2): For this sample, the sum of the observations is 838, the sum of the squares of the observations is 20,684, and the sum of the squared differences between each observation and the mean is 619.89.
-Referring to Table 3-4, the arithmetic mean of the customs data is _____.
فتح الحزمة
افتح القفل للوصول البطاقات البالغ عددها 138 في هذه المجموعة.
فتح الحزمة
k this deck
69
The rate of return for the S&P 500 over a seven- year period is - 0.029, - 0.061, - 0.493,- 0.286, - 0.160, - 0.186 and - 0.224. The geometric mean rate of return is _____.
فتح الحزمة
افتح القفل للوصول البطاقات البالغ عددها 138 في هذه المجموعة.
فتح الحزمة
k this deck
70
TABLE 3-1
Health care issues are receiving much attention in both academic and political arenas. A sociologist recently conducted a survey of citizens over 60 years of age whose net worth is too high to qualify for Medicaid and have no private health insurance. The ages of 25 uninsured senior citizens were as follows:
Referring to Table 3-1, calculate the coefficient of variation of the ages of the uninsured senior citizens.
فتح الحزمة
افتح القفل للوصول البطاقات البالغ عددها 138 في هذه المجموعة.
فتح الحزمة
k this deck
71
TABLE 3-11
The following table represents the assets in billions of dollars of the five largest bond funds.
-Referring to Table 3-11, what is the mean for this population of the five largest bond funds?
The following table represents the assets in billions of dollars of the five largest bond funds.
-Referring to Table 3-11, what is the mean for this population of the five largest bond funds?
فتح الحزمة
افتح القفل للوصول البطاقات البالغ عددها 138 في هذه المجموعة.
فتح الحزمة
k this deck
72
TABLE 3-2
The data below represent the amount of grams of carbohydrates in a serving of breakfast cereal in a sample of 11 different servings.
11 15 23 29 19 22 21 20 15 25 17
-Referring to Table 3-2, the interquartile range in the carbohydrate amounts is _____grams.
The data below represent the amount of grams of carbohydrates in a serving of breakfast cereal in a sample of 11 different servings.
11 15 23 29 19 22 21 20 15 25 17
-Referring to Table 3-2, the interquartile range in the carbohydrate amounts is _____grams.
فتح الحزمة
افتح القفل للوصول البطاقات البالغ عددها 138 في هذه المجموعة.
فتح الحزمة
k this deck
73
TABLE 3-2
The data below represent the amount of grams of carbohydrates in a serving of breakfast cereal in a sample of 11 different servings.
-Referring to Table 3-2, the third quartile of the carbohydrate amounts is_____grams.
The data below represent the amount of grams of carbohydrates in a serving of breakfast cereal in a sample of 11 different servings.
-Referring to Table 3-2, the third quartile of the carbohydrate amounts is_____grams.
فتح الحزمة
افتح القفل للوصول البطاقات البالغ عددها 138 في هذه المجموعة.
فتح الحزمة
k this deck
74
The data below represent the amount of grams of carbohydrates in a serving of breakfast cereal in a sample of 11 different servings.Referring to Table 3-2, what type of shape does the distribution of the sample appear to have?
فتح الحزمة
افتح القفل للوصول البطاقات البالغ عددها 138 في هذه المجموعة.
فتح الحزمة
k this deck
75
TABLE 3-6
The rate of return of an Internet Service Provider over a 10- year period are: 10.25%, 12.64%, 8.37%, 9.29%, 6.23%, 42.53%,29.23%, 15.25%, 21.52%, -2.35%.
-Referring to Table 3-6, compute the arithmetic mean rate of return.
The rate of return of an Internet Service Provider over a 10- year period are: 10.25%, 12.64%, 8.37%, 9.29%, 6.23%, 42.53%,29.23%, 15.25%, 21.52%, -2.35%.
-Referring to Table 3-6, compute the arithmetic mean rate of return.
فتح الحزمة
افتح القفل للوصول البطاقات البالغ عددها 138 في هذه المجموعة.
فتح الحزمة
k this deck
76
Health care issues are receiving much attention in both academic and political arenas. A sociologist recently conducted a survey of citizens over 60 years of age whose net worth is too high to qualify for Medicaid and have no private health insurance. The ages of 25 uninsured senior citizens were as follows:Referring to Table 3-1, identify the first quartile of the ages of the uninsured senior citizens.
فتح الحزمة
افتح القفل للوصول البطاقات البالغ عددها 138 في هذه المجموعة.
فتح الحزمة
k this deck
77
The stem-and-leaf display below represents the number of vitamin supplements sold by a health food store in a sample of 16 days.
Note (1): 1H means the "high teens" - 15, 16, 17, 18, or 19; 2L means the "low twenties" - 20, 21, 22, 23, or 24; 2H means
the "high twenties" - 25, 26, 27, 28, or 29, etc.
Note (2): For this sample, the sum of the observations is 448, the sum of the squares of the observations is 13,356, and the sum of the squared differences between each observation and the mean is 812.
-Referring to Table 3-3, construct a boxplot for the data in this sample.
فتح الحزمة
افتح القفل للوصول البطاقات البالغ عددها 138 في هذه المجموعة.
فتح الحزمة
k this deck
78
Given below is the frequency distribution of the 12-month rate of return achieved by 30 stocks.
-Referring to Table 3-7, what is the approximate variance?
فتح الحزمة
افتح القفل للوصول البطاقات البالغ عددها 138 في هذه المجموعة.
فتح الحزمة
k this deck
79
In the 2002- 2003 academic year, many public universities in the United States raised tuition and fees due to a decrease in state subsidies. The change in the cost of tuition, a shared dormitory room, and the most popular meal plan from the 2001- 2002 academic year for a sample of 10 public universities were as follows: $1589, $593, $1223, $869, $423, $1720, $708, $1425, $922 and $308.
-Referring to Table 3-9, what are the (absolute values of) the Z scores of the change in cost?
-Referring to Table 3-9, what are the (absolute values of) the Z scores of the change in cost?
فتح الحزمة
افتح القفل للوصول البطاقات البالغ عددها 138 في هذه المجموعة.
فتح الحزمة
k this deck
80
The rate of return for Microsoft's stock over a seven- year period is 0.527, 0.145, 0.684, 1.146, 0.564, 0.883 and 0.436. The geometric mean rate of return is ______ .
فتح الحزمة
افتح القفل للوصول البطاقات البالغ عددها 138 في هذه المجموعة.
فتح الحزمة
k this deck
فتح الحزمة
افتح القفل للوصول البطاقات البالغ عددها 138 في هذه المجموعة.


