Deck 12: Time Series Analysis and Forecasting
ملء الشاشة (f)
سؤال
The random walk model is written as: 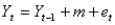 . In this model,
  represents the:
A) average of the Y's
B) average of the X's
C) forecasted value
D) random series with mean 0 and some constant standard deviation
. In this model, represents the:A) average of the Y's
B) average of the X's
C) forecasted value
D) random series with mean 0 and some constant standard deviation
سؤال
سؤال
سؤال
سؤال
سؤال
سؤال
سؤال
سؤال
سؤال
سؤال
سؤال
سؤال
سؤال
سؤال
سؤال
سؤال
سؤال
The linear trend  was estimated using a time series with 20 time periods. The forecasted value for time period 21 is:
A) 120
B) 122
C) 160
D) 162
was estimated using a time series with 20 time periods. The forecasted value for time period 21 is:A) 120
B) 122
C) 160
D) 162
سؤال
سؤال
سؤال
When using exponential smoothing, if you want the forecast to react quickly to movements in the series, you should choose:
A) values of near 1
B) values of near 0
C) values of midway between 0 and 1
D) the values based on the particular data set
A) values of
near 1B) values of
near 0C) values of
midway between 0 and 1D) the values based on the particular data set
سؤال
سؤال
سؤال
سؤال
سؤال
سؤال
The data below represents sales for a particular product. If you were to use the moving average method with a span of 3 periods, what would be your forecast for period 5? 
A) 90
B) 100
C) 105
D) 110
A) 90
B) 100
C) 105
D) 110
سؤال
سؤال
When using exponential smoothing, a smoothing constant  must be used. The value for
  :
:
A) ranges between 0 and 1
B) ranges between -1 and +1
C) equals the largest observed value in the series
D) represents the strength of the association between the forecasted and observed values
must be used. The value for :A) ranges between 0 and 1
B) ranges between -1 and +1
C) equals the largest observed value in the series
D) represents the strength of the association between the forecasted and observed values
سؤال
سؤال
When using Holt's model, choosing values of the smoothing constant  that are near 1 will result in forecast models that:
A) react very quickly to changes in the level
B) react very quickly to changes in the trend
C) react very quickly to changes in the level and the trend
D) react very slowly to changes in the level and the trend
that are near 1 will result in forecast models that:A) react very quickly to changes in the level
B) react very quickly to changes in the trend
C) react very quickly to changes in the level and the trend
D) react very slowly to changes in the level and the trend
سؤال
سؤال
سؤال
Suppose that a simple exponential smoothing model is used (with  = 0.40) to forecast monthly sandwich sales at a local sandwich shop. The forecasted demand for September was 1560 and the actual demand was 1480 sandwiches. Given this information, what would be the forecast number of sandwiches for October?
A) 1480
B) 1528
C) 1560
D) 1592
= 0.40) to forecast monthly sandwich sales at a local sandwich shop. The forecasted demand for September was 1560 and the actual demand was 1480 sandwiches. Given this information, what would be the forecast number of sandwiches for October?A) 1480
B) 1528
C) 1560
D) 1592
سؤال
The following are the values of a time series for the first four time periods:  Using a four-period moving average, the forecasted value for time period 5 is:
A) 24.5
B) 25.5
C) 26.5
D) 27.5
Using a four-period moving average, the forecasted value for time period 5 is:A) 24.5
B) 25.5
C) 26.5
D) 27.5
سؤال
سؤال
The data below represents sales for a particular product. If you were to use the moving average method with a span of 4 periods, what would be your forecast for period 5? 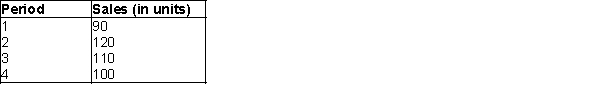
A) 90
B) 100
C) 105
D) 110
A) 90
B) 100
C) 105
D) 110
سؤال
سؤال
سؤال
سؤال
سؤال
سؤال
سؤال
سؤال
سؤال
The null hypothesis in a runs test is  the data series is random.
the data series is random. سؤال
سؤال
Assume that the trend line 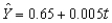 was calculated from quarterly data for 2011 - 2015, where t = 1 for the first quarter of 2011. The trend value for the second quarter of the year 2016 is 0.75.
was calculated from quarterly data for 2011 - 2015, where t = 1 for the first quarter of 2011. The trend value for the second quarter of the year 2016 is 0.75. سؤال
سؤال
سؤال
سؤال
سؤال
سؤال
سؤال
سؤال
سؤال
سؤال
سؤال
سؤال
سؤال
سؤال
سؤال
سؤال
سؤال
سؤال
If we use a value close to 1 for the smoothing constant  in a simple exponential smoothing model, then we expect the model to respond very slowly to changes in the level.
in a simple exponential smoothing model, then we expect the model to respond very slowly to changes in the level. سؤال
سؤال
If we use a value close to 1 for the level smoothing constant  and a value close to 0 for the trend smoothing constant
  in Holt's exponential smoothing model, then we expect the model to respond very quickly to changes in the level, but very slowly to changes in the trend.
and a value close to 0 for the trend smoothing constant in Holt's exponential smoothing model, then we expect the model to respond very quickly to changes in the level, but very slowly to changes in the trend. سؤال
سؤال
سؤال
سؤال
سؤال
سؤال
سؤال
سؤال
سؤال
An equation for the random walk model is given by the equation:  , where
  is the change in the time series from time t to time t - 1,
  is a constant, and
  is a random variable (noise) with mean 0 and some standard deviation
  .
.
, where is the change in the time series from time t to time t - 1, is a constant, and is a random variable (noise) with mean 0 and some standard deviation . سؤال
سؤال
سؤال

فتح الحزمة
قم بالتسجيل لفتح البطاقات في هذه المجموعة!
Unlock Deck
Unlock Deck
1/106
العب
ملء الشاشة (f)
Deck 12: Time Series Analysis and Forecasting
1
The random walk model is written as: . In this model, represents the:
A) average of the Y's
B) average of the X's
C) forecasted value
D) random series with mean 0 and some constant standard deviation
. In this model, represents the:A) average of the Y's
B) average of the X's
C) forecasted value
D) random series with mean 0 and some constant standard deviation
random series with mean 0 and some constant standard deviation
2
Which of the following is not one of the techniques that can be used to identify whether a time series is truly random?
A) a graph (plot the data)
B) the runs test
C) a control chart
D) the autocorrelations (or a correlogram)
A) a graph (plot the data)
B) the runs test
C) a control chart
D) the autocorrelations (or a correlogram)
the autocorrelations (or a correlogram)
3
The most common form of autocorrelation is positive autocorrelation, in which:
A) large observations tend to follow both large and small observations
B) small observations tend to follow both large and small observations
C) large observations tend to follow large observations and small observations tend to follow small observations
D) large observations tend to follow small observations and small observations tend to follow large observations
large observations tend to follow large observations and small observations tend to follow small observations
4
The idea behind the runs test is that a random number series should have a number of runs that is:
A) large
B) small
C) not large or small
D) constant
A) large
B) small
C) not large or small
D) constant
فتح الحزمة
افتح القفل للوصول البطاقات البالغ عددها 106 في هذه المجموعة.
فتح الحزمة
k this deck
5
A linear trend means that the time series variable changes by a:
A) constant amount each time period
B) constant percentage each time period
C) positive amount each time period
D) negative amount each time period
A) constant amount each time period
B) constant percentage each time period
C) positive amount each time period
D) negative amount each time period
فتح الحزمة
افتح القفل للوصول البطاقات البالغ عددها 106 في هذه المجموعة.
فتح الحزمة
k this deck
6
What is a component of a time series?
A) base series
B) trend
C) seasonal component
D) cyclic component
E) all of these choices
A) base series
B) trend
C) seasonal component
D) cyclic component
E) all of these choices
فتح الحزمة
افتح القفل للوصول البطاقات البالغ عددها 106 في هذه المجموعة.
فتح الحزمة
k this deck
7
Econometric models can also be called:
A) judgmental models
B) time series models
C) causal models
D) environmetric models
A) judgmental models
B) time series models
C) causal models
D) environmetric models
فتح الحزمة
افتح القفل للوصول البطاقات البالغ عددها 106 في هذه المجموعة.
فتح الحزمة
k this deck
8
Which summary measure for forecast errors does not depend on the units of the forecast variable?
A) MAE (mean absolute error)
B) MFE (mean forecast error)
C) RMSE (root mean square error)
D) MAPE (mean absolute percentage error)
A) MAE (mean absolute error)
B) MFE (mean forecast error)
C) RMSE (root mean square error)
D) MAPE (mean absolute percentage error)
فتح الحزمة
افتح القفل للوصول البطاقات البالغ عددها 106 في هذه المجموعة.
فتح الحزمة
k this deck
9
Examples of non-random patterns that may be evident on a time series graph include:
A) trends
B) increasing variance over time
C) a meandering pattern
D) too many zigzags
E) all of these choices
A) trends
B) increasing variance over time
C) a meandering pattern
D) too many zigzags
E) all of these choices
فتح الحزمة
افتح القفل للوصول البطاقات البالغ عددها 106 في هذه المجموعة.
فتح الحزمة
k this deck
10
Extrapolation methods attempt to:
A) use non-quantitative methods to predict future values
B) search for patterns in the data and then use those to predict future values
C) find variables that are correlated with the data being predicted
D) predict the next period's value by using the latest period's value
A) use non-quantitative methods to predict future values
B) search for patterns in the data and then use those to predict future values
C) find variables that are correlated with the data being predicted
D) predict the next period's value by using the latest period's value
فتح الحزمة
افتح القفل للوصول البطاقات البالغ عددها 106 في هذه المجموعة.
فتح الحزمة
k this deck
11
In a random series, successive observations are probabilistically independent of one another. If this property is violated, the observations are said to be:
A) autocorrelated
B) intercorrelated
C) causal
D) seasonal
A) autocorrelated
B) intercorrelated
C) causal
D) seasonal
فتح الحزمة
افتح القفل للوصول البطاقات البالغ عددها 106 في هذه المجموعة.
فتح الحزمة
k this deck
12
Forecasting models can be divided into three groups. They are:
A) time series, optimization, and simulation methods
B) judgmental, extrapolation, and econometric methods
C) judgmental, random, and linear methods
D) linear, non-linear, and extrapolation methods
A) time series, optimization, and simulation methods
B) judgmental, extrapolation, and econometric methods
C) judgmental, random, and linear methods
D) linear, non-linear, and extrapolation methods
فتح الحزمة
افتح القفل للوصول البطاقات البالغ عددها 106 في هذه المجموعة.
فتح الحزمة
k this deck
13
Which term refers to a consecutive series of observations that remain on one side of the base level?
A) outlier
B) random walk
C) run
D) variance
A) outlier
B) random walk
C) run
D) variance
فتح الحزمة
افتح القفل للوصول البطاقات البالغ عددها 106 في هذه المجموعة.
فتح الحزمة
k this deck
14
The forecast error is the difference between:
A) this period's value and the next period's value
B) the average value and the expected value of the response variable
C) the explanatory variable value and the response variable value
D) the actual value and the forecast value
A) this period's value and the next period's value
B) the average value and the expected value of the response variable
C) the explanatory variable value and the response variable value
D) the actual value and the forecast value
فتح الحزمة
افتح القفل للوصول البطاقات البالغ عددها 106 في هذه المجموعة.
فتح الحزمة
k this deck
15
In contrast to linear trend, an exponential trend is appropriate when the time series changes by a:
A) constant amount each time period
B) constant percentage each time period
C) positive amount each time period
D) negative amount each time period
A) constant amount each time period
B) constant percentage each time period
C) positive amount each time period
D) negative amount each time period
فتح الحزمة
افتح القفل للوصول البطاقات البالغ عددها 106 في هذه المجموعة.
فتح الحزمة
k this deck
16
A small p-value in the rune test provides evidence of:
A) randomness
B) nonrandomness
C) nonnormality
D) heteroscedasticity
A) randomness
B) nonrandomness
C) nonnormality
D) heteroscedasticity
فتح الحزمة
افتح القفل للوصول البطاقات البالغ عددها 106 في هذه المجموعة.
فتح الحزمة
k this deck
17
Which of the following is not one of the commonly used summary measures for forecast errors?
A) MAE (mean absolute error)
B) MFE (mean forecast error)
C) RMSE (root mean square error)
D) MAPE (mean absolute percentage error)
A) MAE (mean absolute error)
B) MFE (mean forecast error)
C) RMSE (root mean square error)
D) MAPE (mean absolute percentage error)
فتح الحزمة
افتح القفل للوصول البطاقات البالغ عددها 106 في هذه المجموعة.
فتح الحزمة
k this deck
18
The linear trend was estimated using a time series with 20 time periods. The forecasted value for time period 21 is:
A) 120
B) 122
C) 160
D) 162
was estimated using a time series with 20 time periods. The forecasted value for time period 21 is:A) 120
B) 122
C) 160
D) 162
فتح الحزمة
افتح القفل للوصول البطاقات البالغ عددها 106 في هذه المجموعة.
فتح الحزمة
k this deck
19
The runs test uses a series of 0's and 1's. The 0's and 1's typically represent whether each observation is:
A) above or below the predicted value of Y
B) above or below the mean value of Y
C) is above or below the mean value of the previous two observations
D) is positive or negative
A) above or below the predicted value of Y
B) above or below the mean value of Y
C) is above or below the mean value of the previous two observations
D) is positive or negative
فتح الحزمة
افتح القفل للوصول البطاقات البالغ عددها 106 في هذه المجموعة.
فتح الحزمة
k this deck
20
Models such as moving averages, exponential smoothing, and linear trend use only:
A) future values of Y to forecast previous values of Y
B) previous values of Y to forecast future values of Y
C) multiple explanatory variables (not just values of Y) to forecast future values of Y
D) ratio-to-moving-average methods
A) future values of Y to forecast previous values of Y
B) previous values of Y to forecast future values of Y
C) multiple explanatory variables (not just values of Y) to forecast future values of Y
D) ratio-to-moving-average methods
فتح الحزمة
افتح القفل للوصول البطاقات البالغ عددها 106 في هذه المجموعة.
فتح الحزمة
k this deck
21
When using exponential smoothing, if you want the forecast to react quickly to movements in the series, you should choose:
A) values of near 1
B) values of near 0
C) values of midway between 0 and 1
D) the values based on the particular data set
A) values of
near 1B) values of
near 0C) values of
midway between 0 and 1D) the values based on the particular data set
فتح الحزمة
افتح القفل للوصول البطاقات البالغ عددها 106 في هذه المجموعة.
فتح الحزمة
k this deck
22
Perhaps the simplest and one of the most frequently used extrapolation methods is the:
A) moving average
B) linear trend
C) exponential trend
D) causal model
A) moving average
B) linear trend
C) exponential trend
D) causal model
فتح الحزمة
افتح القفل للوصول البطاقات البالغ عددها 106 في هذه المجموعة.
فتح الحزمة
k this deck
23
The moving average method can also be referred to as a(n) ____ method.
A) causal
B) smoothing
C) exponential
D) econometric
A) causal
B) smoothing
C) exponential
D) econometric
فتح الحزمة
افتح القفل للوصول البطاقات البالغ عددها 106 في هذه المجموعة.
فتح الحزمة
k this deck
24
In a random walk model, the:
A) series itself is random
B) series itself is not random but its differences are random
C) series itself and its differences are random
D) series itself and its differences are not random
A) series itself is random
B) series itself is not random but its differences are random
C) series itself and its differences are random
D) series itself and its differences are not random
فتح الحزمة
افتح القفل للوصول البطاقات البالغ عددها 106 في هذه المجموعة.
فتح الحزمة
k this deck
25
A regression approach can also be used to deal with seasonality by using ____ variables for the seasons.
A) smoothing
B) response
C) residual
D) dummy
A) smoothing
B) response
C) residual
D) dummy
فتح الحزمة
افتح القفل للوصول البطاقات البالغ عددها 106 في هذه المجموعة.
فتح الحزمة
k this deck
26
Holt's model differs from simple exponential smoothing in that it includes a term for:
A) seasonality
B) trend
C) residuals
D) cyclical fluctuations
A) seasonality
B) trend
C) residuals
D) cyclical fluctuations
فتح الحزمة
افتح القفل للوصول البطاقات البالغ عددها 106 في هذه المجموعة.
فتح الحزمة
k this deck
27
The data below represents sales for a particular product. If you were to use the moving average method with a span of 3 periods, what would be your forecast for period 5?
A) 90
B) 100
C) 105
D) 110
A) 90
B) 100
C) 105
D) 110
فتح الحزمة
افتح القفل للوصول البطاقات البالغ عددها 106 في هذه المجموعة.
فتح الحزمة
k this deck
28
In a moving averages method, which of the following represent(s) the number of terms in the moving average?
A) a smoothing constant
B) the explanatory variables
C) an alpha value
D) a span
A) a smoothing constant
B) the explanatory variables
C) an alpha value
D) a span
فتح الحزمة
افتح القفل للوصول البطاقات البالغ عددها 106 في هذه المجموعة.
فتح الحزمة
k this deck
29
When using exponential smoothing, a smoothing constant must be used. The value for :
A) ranges between 0 and 1
B) ranges between -1 and +1
C) equals the largest observed value in the series
D) represents the strength of the association between the forecasted and observed values
must be used. The value for :A) ranges between 0 and 1
B) ranges between -1 and +1
C) equals the largest observed value in the series
D) represents the strength of the association between the forecasted and observed values
فتح الحزمة
افتح القفل للوصول البطاقات البالغ عددها 106 في هذه المجموعة.
فتح الحزمة
k this deck
30
Which of the following is not a method for dealing with seasonality in data?
A) Winter's exponential smoothing model
B) deseasonalizing the data, using any forecasting model, then reseasonalizing the data
C) multiple regression with lags for the seasons
D) multiple regression with dummy variables for the seasons
A) Winter's exponential smoothing model
B) deseasonalizing the data, using any forecasting model, then reseasonalizing the data
C) multiple regression with lags for the seasons
D) multiple regression with dummy variables for the seasons
فتح الحزمة
افتح القفل للوصول البطاقات البالغ عددها 106 في هذه المجموعة.
فتح الحزمة
k this deck
31
When using Holt's model, choosing values of the smoothing constant that are near 1 will result in forecast models that:
A) react very quickly to changes in the level
B) react very quickly to changes in the trend
C) react very quickly to changes in the level and the trend
D) react very slowly to changes in the level and the trend
that are near 1 will result in forecast models that:A) react very quickly to changes in the level
B) react very quickly to changes in the trend
C) react very quickly to changes in the level and the trend
D) react very slowly to changes in the level and the trend
فتح الحزمة
افتح القفل للوصول البطاقات البالغ عددها 106 في هذه المجموعة.
فتح الحزمة
k this deck
32
A trend component of a time series is a long-term, relatively smooth pattern or direction exhibited by a series, and its duration is more than one year.
فتح الحزمة
افتح القفل للوصول البطاقات البالغ عددها 106 في هذه المجموعة.
فتح الحزمة
k this deck
33
Suppose that a simple exponential smoothing model is used (with a = 0.30) to forecast monthly sandwich sales at a local sandwich shop. After June's demand is observed at 1520 sandwiches, the forecasted demand for July is 1600 sandwiches. At the beginning of July, what would be the forecasted demand for August?
A) 1520
B) 1544
C) 1550
D) 1600
A) 1520
B) 1544
C) 1550
D) 1600
فتح الحزمة
افتح القفل للوصول البطاقات البالغ عددها 106 في هذه المجموعة.
فتح الحزمة
k this deck
34
Suppose that a simple exponential smoothing model is used (with = 0.40) to forecast monthly sandwich sales at a local sandwich shop. The forecasted demand for September was 1560 and the actual demand was 1480 sandwiches. Given this information, what would be the forecast number of sandwiches for October?
A) 1480
B) 1528
C) 1560
D) 1592
= 0.40) to forecast monthly sandwich sales at a local sandwich shop. The forecasted demand for September was 1560 and the actual demand was 1480 sandwiches. Given this information, what would be the forecast number of sandwiches for October?A) 1480
B) 1528
C) 1560
D) 1592
فتح الحزمة
افتح القفل للوصول البطاقات البالغ عددها 106 في هذه المجموعة.
فتح الحزمة
k this deck
35
The following are the values of a time series for the first four time periods: Using a four-period moving average, the forecasted value for time period 5 is:
A) 24.5
B) 25.5
C) 26.5
D) 27.5
Using a four-period moving average, the forecasted value for time period 5 is:A) 24.5
B) 25.5
C) 26.5
D) 27.5
فتح الحزمة
افتح القفل للوصول البطاقات البالغ عددها 106 في هذه المجموعة.
فتح الحزمة
k this deck
36
Winters' model differs from Holt's model and simple exponential smoothing in that it includes an index for:
A) seasonality
B) trend
C) residuals
D) cyclical fluctuations
A) seasonality
B) trend
C) residuals
D) cyclical fluctuations
فتح الحزمة
افتح القفل للوصول البطاقات البالغ عددها 106 في هذه المجموعة.
فتح الحزمة
k this deck
37
The data below represents sales for a particular product. If you were to use the moving average method with a span of 4 periods, what would be your forecast for period 5?
A) 90
B) 100
C) 105
D) 110
A) 90
B) 100
C) 105
D) 110
فتح الحزمة
افتح القفل للوصول البطاقات البالغ عددها 106 في هذه المجموعة.
فتح الحزمة
k this deck
38
A time series can consist of four different components: trend, seasonal, cyclical, and random (or noise).
فتح الحزمة
افتح القفل للوصول البطاقات البالغ عددها 106 في هذه المجموعة.
فتح الحزمة
k this deck
39
There are a variety of deseasonalizing methods, but they are typically variations of:
A) ratio-to-seasonality methods
B) ratio-to-exponential-smoothing methods
C) ratio-to-moving-average methods
D) linear trend
A) ratio-to-seasonality methods
B) ratio-to-exponential-smoothing methods
C) ratio-to-moving-average methods
D) linear trend
فتح الحزمة
افتح القفل للوصول البطاقات البالغ عددها 106 في هذه المجموعة.
فتح الحزمة
k this deck
40
A time series is any variable that is measured over time in sequential order.
فتح الحزمة
افتح القفل للوصول البطاقات البالغ عددها 106 في هذه المجموعة.
فتح الحزمة
k this deck
41
If the observations of a time series increase or decrease regularly through time, we say that the time series has a random (or noise) component.
فتح الحزمة
افتح القفل للوصول البطاقات البالغ عددها 106 في هذه المجموعة.
فتح الحزمة
k this deck
42
Econometric forecasting models, also called causal models, use regression to forecast a time series variable by using other explanatory time series variables.
فتح الحزمة
افتح القفل للوصول البطاقات البالغ عددها 106 في هذه المجموعة.
فتح الحزمة
k this deck
43
Forecasting software packages typically report several summary measures of the forecasting error. The most important of these are MAE (mean absolute error), RMSE (root mean square error), and MAPE (mean absolute percentage error).
فتح الحزمة
افتح القفل للوصول البطاقات البالغ عددها 106 في هذه المجموعة.
فتح الحزمة
k this deck
44
The time series component that reflects a wavelike pattern describing a long-term trend that is generally apparent over a number of years is called cyclical.
فتح الحزمة
افتح القفل للوصول البطاقات البالغ عددها 106 في هذه المجموعة.
فتح الحزمة
k this deck
45
A meandering pattern is an example of a random time series.
فتح الحزمة
افتح القفل للوصول البطاقات البالغ عددها 106 في هذه المجموعة.
فتح الحزمة
k this deck
46
The null hypothesis in a runs test is the data series is random.
the data series is random. فتح الحزمة
افتح القفل للوصول البطاقات البالغ عددها 106 في هذه المجموعة.
فتح الحزمة
k this deck
47
The time series component that reflects a long-term, relatively smooth pattern or direction exhibited by a time series over a long time period, is called seasonal.
فتح الحزمة
افتح القفل للوصول البطاقات البالغ عددها 106 في هذه المجموعة.
فتح الحزمة
k this deck
48
Assume that the trend line was calculated from quarterly data for 2011 - 2015, where t = 1 for the first quarter of 2011. The trend value for the second quarter of the year 2016 is 0.75.
was calculated from quarterly data for 2011 - 2015, where t = 1 for the first quarter of 2011. The trend value for the second quarter of the year 2016 is 0.75. فتح الحزمة
افتح القفل للوصول البطاقات البالغ عددها 106 في هذه المجموعة.
فتح الحزمة
k this deck
49
If a random series has too few runs, then it is zigzagging too often.
فتح الحزمة
افتح القفل للوصول البطاقات البالغ عددها 106 في هذه المجموعة.
فتح الحزمة
k this deck
50
Extrapolation forecasting methods are quantitative methods that use past data of a time series variable - and nothing else, except possible time itself - to forecast values of the variable.
فتح الحزمة
افتح القفل للوصول البطاقات البالغ عددها 106 في هذه المجموعة.
فتح الحزمة
k this deck
51
An exponential trend is appropriate when the time series changes by a constant percentage each period.
فتح الحزمة
افتح القفل للوصول البطاقات البالغ عددها 106 في هذه المجموعة.
فتح الحزمة
k this deck
52
The seasonal component of a time series is more difficult to predict than the cyclic component because cyclic variation is much more regular.
فتح الحزمة
افتح القفل للوصول البطاقات البالغ عددها 106 في هذه المجموعة.
فتح الحزمة
k this deck
53
A shortcoming of the RMSE (root mean square error) is that it is not in the same units as the forecast variable.
فتح الحزمة
افتح القفل للوصول البطاقات البالغ عددها 106 في هذه المجموعة.
فتح الحزمة
k this deck
54
As is the case with residuals from regression, the forecast errors for nonregression methods will always average to zero.
فتح الحزمة
افتح القفل للوصول البطاقات البالغ عددها 106 في هذه المجموعة.
فتح الحزمة
k this deck
55
The runs test is a formal test of the null hypothesis of randomness. If there are too many or too few runs in the series, then we conclude that the series is not random.
فتح الحزمة
افتح القفل للوصول البطاقات البالغ عددها 106 في هذه المجموعة.
فتح الحزمة
k this deck
56
The most common form of autocorrelation is positive autocorrelation, where large observations tend to follow large observations and small observations tend to follow small observations.
فتح الحزمة
افتح القفل للوصول البطاقات البالغ عددها 106 في هذه المجموعة.
فتح الحزمة
k this deck
57
The cyclic component of a time series is more likely to exhibit business cycles that record periods of economic recession and inflation.
فتح الحزمة
افتح القفل للوصول البطاقات البالغ عددها 106 في هذه المجموعة.
فتح الحزمة
k this deck
58
An autocorrelation is a type of correlation used to measure whether the values of a time series are related to their own past values.
فتح الحزمة
افتح القفل للوصول البطاقات البالغ عددها 106 في هذه المجموعة.
فتح الحزمة
k this deck
59
If a time series exhibits an exponential trend, then a plot of its logarithm should be approximately linear.
فتح الحزمة
افتح القفل للوصول البطاقات البالغ عددها 106 في هذه المجموعة.
فتح الحزمة
k this deck
60
You will always get more accurate forecasts by using more complex forecasting methods.
فتح الحزمة
افتح القفل للوصول البطاقات البالغ عددها 106 في هذه المجموعة.
فتح الحزمة
k this deck
61
If the span of a moving average is large - say, 12 months - then few observations go into each average, and extreme values have relatively large effect on the forecasts.
فتح الحزمة
افتح القفل للوصول البطاقات البالغ عددها 106 في هذه المجموعة.
فتح الحزمة
k this deck
62
In a random walk model, there are significantly more runs than expected, and the autocorrelations are not significant.
فتح الحزمة
افتح القفل للوصول البطاقات البالغ عددها 106 في هذه المجموعة.
فتح الحزمة
k this deck
63
Holt's method is an exponential smoothing method, which is appropriate for a series with seasonality and possibly a trend.
فتح الحزمة
افتح القفل للوصول البطاقات البالغ عددها 106 في هذه المجموعة.
فتح الحزمة
k this deck
64
The purpose of using the moving average is to take away the short-term seasonal and random variation, leaving behind a combined trend and cyclical movement.
فتح الحزمة
افتح القفل للوصول البطاقات البالغ عددها 106 في هذه المجموعة.
فتح الحزمة
k this deck
65
Seasonal variations will not be present in a deseasonalized time series.
فتح الحزمة
افتح القفل للوصول البطاقات البالغ عددها 106 في هذه المجموعة.
فتح الحزمة
k this deck
66
If we use a value close to 1 for the smoothing constant in a simple exponential smoothing model, then we expect the model to respond very slowly to changes in the level.
in a simple exponential smoothing model, then we expect the model to respond very slowly to changes in the level. فتح الحزمة
افتح القفل للوصول البطاقات البالغ عددها 106 في هذه المجموعة.
فتح الحزمة
k this deck
67
The seasonal component of a time series is more likely to exhibit the relatively steady growth of a variable, such as the population of Egypt from 35 million in 1960 to 93 million in 2016.
فتح الحزمة
افتح القفل للوصول البطاقات البالغ عددها 106 في هذه المجموعة.
فتح الحزمة
k this deck
68
If we use a value close to 1 for the level smoothing constant and a value close to 0 for the trend smoothing constant in Holt's exponential smoothing model, then we expect the model to respond very quickly to changes in the level, but very slowly to changes in the trend.
and a value close to 0 for the trend smoothing constant in Holt's exponential smoothing model, then we expect the model to respond very quickly to changes in the level, but very slowly to changes in the trend. فتح الحزمة
افتح القفل للوصول البطاقات البالغ عددها 106 في هذه المجموعة.
فتح الحزمة
k this deck
69
Every form of exponential smoothing model has at least one smoothing constant, which is always between 0 and 1.
فتح الحزمة
افتح القفل للوصول البطاقات البالغ عددها 106 في هذه المجموعة.
فتح الحزمة
k this deck
70
We compute the five-period moving averages for all time periods except the first two.
فتح الحزمة
افتح القفل للوصول البطاقات البالغ عددها 106 في هذه المجموعة.
فتح الحزمة
k this deck
71
Simple exponential smoothing is appropriate for a series without a pronounced trend or seasonality.
فتح الحزمة
افتح القفل للوصول البطاقات البالغ عددها 106 في هذه المجموعة.
فتح الحزمة
k this deck
72
The moving average method is perhaps the simplest and one of the most frequently-used extrapolation methods.
فتح الحزمة
افتح القفل للوصول البطاقات البالغ عددها 106 في هذه المجموعة.
فتح الحزمة
k this deck
73
In exponential smoothing models, the forecast is based on the level at time t, Lt, which is not observable and can only be estimated.
فتح الحزمة
افتح القفل للوصول البطاقات البالغ عددها 106 في هذه المجموعة.
فتح الحزمة
k this deck
74
The smoothing constants in exponential smoothing models are effectively a way to assign different weights to past levels, trends and cycles in the data.
فتح الحزمة
افتح القفل للوصول البطاقات البالغ عددها 106 في هذه المجموعة.
فتح الحزمة
k this deck
75
Correlogram is a bar chart of autocorrelation at different lags.
فتح الحزمة
افتح القفل للوصول البطاقات البالغ عددها 106 في هذه المجموعة.
فتح الحزمة
k this deck
76
A moving average is the average of the observations in the past few periods, where the number of terms in the average is the span.
فتح الحزمة
افتح القفل للوصول البطاقات البالغ عددها 106 في هذه المجموعة.
فتح الحزمة
k this deck
77
An equation for the random walk model is given by the equation: , where is the change in the time series from time t to time t - 1, is a constant, and is a random variable (noise) with mean 0 and some standard deviation .
, where is the change in the time series from time t to time t - 1, is a constant, and is a random variable (noise) with mean 0 and some standard deviation . فتح الحزمة
افتح القفل للوصول البطاقات البالغ عددها 106 في هذه المجموعة.
فتح الحزمة
k this deck
78
To deseasonalize an observation (assuming a multiplicative model of seasonality), multiply it by the appropriate seasonal index.
فتح الحزمة
افتح القفل للوصول البطاقات البالغ عددها 106 في هذه المجموعة.
فتح الحزمة
k this deck
79
To calculate the five-period moving average for a time series, we average the values in the two preceding periods, and the values in the three following time periods.
فتح الحزمة
افتح القفل للوصول البطاقات البالغ عددها 106 في هذه المجموعة.
فتح الحزمة
k this deck
80
The smoothing constant used in simple exponential smoothing is analogous to the span in moving averages.
فتح الحزمة
افتح القفل للوصول البطاقات البالغ عددها 106 في هذه المجموعة.
فتح الحزمة
k this deck
فتح الحزمة
افتح القفل للوصول البطاقات البالغ عددها 106 في هذه المجموعة.


