Deck 2: Descriptive Statistics
ملء الشاشة (f)
سؤال
سؤال
سؤال
سؤال
سؤال
سؤال
سؤال
سؤال
سؤال
سؤال
سؤال
سؤال
سؤال
سؤال
سؤال
سؤال
سؤال
سؤال
سؤال
سؤال
سؤال
سؤال
سؤال
سؤال
سؤال
سؤال
Identify the shape of the distribution in the figure below. 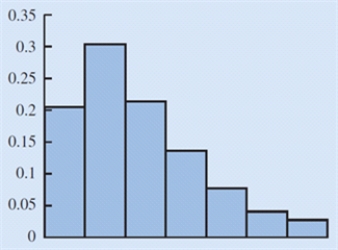
A)Skewed left
B)Symmetric
C)Approximately bell shaped
D)Skewed right
A)Skewed left
B)Symmetric
C)Approximately bell shaped
D)Skewed right
سؤال
سؤال
سؤال
سؤال
سؤال
سؤال
سؤال
سؤال
سؤال
سؤال
سؤال
سؤال
سؤال
سؤال
سؤال
Which graph represents a negative linear relationship between x and y? 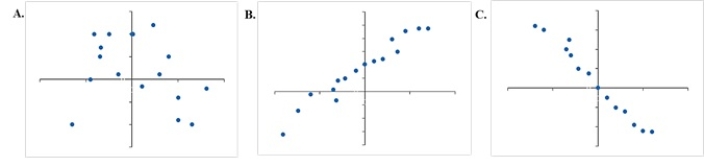
A)A
B)B
C)C
D)None of the graphs display a negative linear relationship.
A)A
B)B
C)C
D)None of the graphs display a negative linear relationship.
سؤال
Below is a histogram for the number of days that it took Wyche Accounting to perform audits in the last quarter of last year. What is the bin size for the histogram? 
A)3
B)4
C)16
D)5
A)3
B)4
C)16
D)5
سؤال
سؤال
سؤال
سؤال
سؤال
سؤال
Below is a histogram for the number of days that it took Wyche Accounting to perform audits in the last quarter of last year. What is the relative frequency of the 21-24 bin? 
A)0.05
B)0.14
C)0.25
D)2.5
A)0.05
B)0.14
C)0.25
D)2.5
سؤال
سؤال
سؤال
سؤال
سؤال
سؤال
سؤال
Select the histogram that is moderately skewed right. 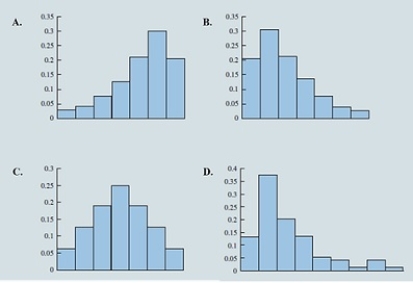
A)A
B)B
C)C
D)D
A)A
B)B
C)C
D)D
سؤال
Below is a histogram for the number of days that it took Wyche Accounting to perform audits in the last quarter of last year. What is the frequency of the 25-28 bin? 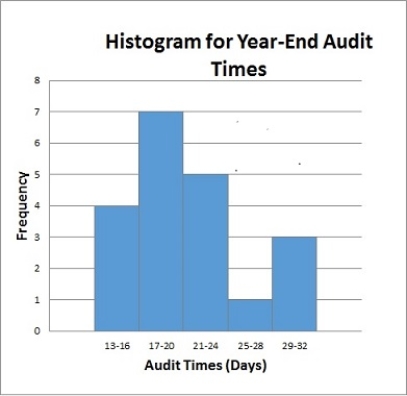
A)0.05
B)1
C)0.5
D)4
A)0.05
B)1
C)0.5
D)4
سؤال
سؤال
سؤال
سؤال
سؤال
سؤال
سؤال
سؤال
سؤال

فتح الحزمة
قم بالتسجيل لفتح البطاقات في هذه المجموعة!
Unlock Deck
Unlock Deck
1/65
العب
ملء الشاشة (f)
Deck 2: Descriptive Statistics
1
Which of the following are necessary to be determined to define the classes for a frequency distribution with quantitative data?
A)Number of nonoverlapping bins, width of each bin, and bin limits
B)Width of each bin and bin lower limits
C)Number of overlapping bins, width of each bin, and bin upper limits
D)Width of each bin and number of bins
A)Number of nonoverlapping bins, width of each bin, and bin limits
B)Width of each bin and bin lower limits
C)Number of overlapping bins, width of each bin, and bin upper limits
D)Width of each bin and number of bins
Number of nonoverlapping bins, width of each bin, and bin limits
2
The data collected from the customers in restaurants about the quality of food is an example of a(n)
A)variable study.
B)cross-sectional study.
C)experimental study.
D)observational study.
A)variable study.
B)cross-sectional study.
C)experimental study.
D)observational study.
observational study.
3
The act of collecting data that are representative of the population data is called
A)random sampling.
B)sample data.
C)population sampling.
D)sources of data.
A)random sampling.
B)sample data.
C)population sampling.
D)sources of data.
random sampling.
4
The difference in a variable measured over observations (time, customers, items, etc.) is known as
A)observed differences.
B)variation.
C)variable change.
D)descriptive analytics.
A)observed differences.
B)variation.
C)variable change.
D)descriptive analytics.
فتح الحزمة
افتح القفل للوصول البطاقات البالغ عددها 65 في هذه المجموعة.
فتح الحزمة
k this deck
5
When working with large spreadsheets with many rows of data, it can be helpful to __________ the data to better find, view, or manage subsets of data.
A)split
B)sort and filter
C)chart
D)manipulate
A)split
B)sort and filter
C)chart
D)manipulate
فتح الحزمة
افتح القفل للوصول البطاقات البالغ عددها 65 في هذه المجموعة.
فتح الحزمة
k this deck
6
The amount of time taken by each of 10 students in a class to complete an exam is an example of what type of data?
A)Cannot be determined
B)Categorical data
C)Time series data
D)Quantitative data
A)Cannot be determined
B)Categorical data
C)Time series data
D)Quantitative data
فتح الحزمة
افتح القفل للوصول البطاقات البالغ عددها 65 في هذه المجموعة.
فتح الحزمة
k this deck
7
In a(n) __________, one or more variables are identified and controlled or manipulated so that data can be obtained about how they influence the variable of interest identified first.
A)experimental study
B)observational study
C)categorical study
D)variable study
A)experimental study
B)observational study
C)categorical study
D)variable study
فتح الحزمة
افتح القفل للوصول البطاقات البالغ عددها 65 في هذه المجموعة.
فتح الحزمة
k this deck
8
_______________ acts as a representative of the population.
A)The variable
B)The variance
C)A sample
D)A random variable
A)The variable
B)The variance
C)A sample
D)A random variable
فتح الحزمة
افتح القفل للوصول البطاقات البالغ عددها 65 في هذه المجموعة.
فتح الحزمة
k this deck
9
Compute the relative frequencies for the data given in the table below:
A)
B)
C)
D)
A)
B)
C)
D)
فتح الحزمة
افتح القفل للوصول البطاقات البالغ عددها 65 في هذه المجموعة.
فتح الحزمة
k this deck
10
A set of values corresponding to a set of variables is defined as a(n)
A)quantity.
B)event.
C)factor.
D)observation.
A)quantity.
B)event.
C)factor.
D)observation.
فتح الحزمة
افتح القفل للوصول البطاقات البالغ عددها 65 في هذه المجموعة.
فتح الحزمة
k this deck
11
A __________ is a graphical summary of data previously summarized in a frequency distribution.
A)box plot
B)histogram
C)line chart
D)scatter chart
A)box plot
B)histogram
C)line chart
D)scatter chart
فتح الحزمة
افتح القفل للوصول البطاقات البالغ عددها 65 في هذه المجموعة.
فتح الحزمة
k this deck
12
Data collected from several entities over a period of time (minutes, hours, days, etc.) are called
A)categorical and quantitative data.
B)time series data.
C)source data.
D)cross-sectional data.
A)categorical and quantitative data.
B)time series data.
C)source data.
D)cross-sectional data.
فتح الحزمة
افتح القفل للوصول البطاقات البالغ عددها 65 في هذه المجموعة.
فتح الحزمة
k this deck
13
When working with data sets in Excel, __________ can be used to automatically highlight cells that meet specified requirements.
A)averaging
B)conditional formatting
C)summing
D)sorting
A)averaging
B)conditional formatting
C)summing
D)sorting
فتح الحزمة
افتح القفل للوصول البطاقات البالغ عددها 65 في هذه المجموعة.
فتح الحزمة
k this deck
14
A quantity of interest that can take on different values is known as a(n)
A)variable.
B)parameter.
C)sample.
D)observation.
A)variable.
B)parameter.
C)sample.
D)observation.
فتح الحزمة
افتح القفل للوصول البطاقات البالغ عددها 65 في هذه المجموعة.
فتح الحزمة
k this deck
15
The letter grades (A, B, C, D, F) of business analysis students are recorded by a professor. This variable's classification
A)is quantitative data.
B)cannot be determined.
C)is categorical data.
D)is time series data.
A)is quantitative data.
B)cannot be determined.
C)is categorical data.
D)is time series data.
فتح الحزمة
افتح القفل للوصول البطاقات البالغ عددها 65 في هذه المجموعة.
فتح الحزمة
k this deck
16
A summary of data that shows the number of observations in each of several nonoverlapping bins is called a(n)
A)frequency distribution.
B)sample summary.
C)bin distribution.
D)observed distribution.
A)frequency distribution.
B)sample summary.
C)bin distribution.
D)observed distribution.
فتح الحزمة
افتح القفل للوصول البطاقات البالغ عددها 65 في هذه المجموعة.
فتح الحزمة
k this deck
17
The goal regarding using an appropriate number of bins is to show the
A)number of observations.
B)number of variables.
C)variation in the data.
D)correlation in the data.
A)number of observations.
B)number of variables.
C)variation in the data.
D)correlation in the data.
فتح الحزمة
افتح القفل للوصول البطاقات البالغ عددها 65 في هذه المجموعة.
فتح الحزمة
k this deck
18
Consider the data below. What percentage of students scored grade C?
A)
B)
C)
D)
A)
B)
C)
D)
فتح الحزمة
افتح القفل للوصول البطاقات البالغ عددها 65 في هذه المجموعة.
فتح الحزمة
k this deck
19
Which of the following gives the proportion of items in each bin?
A)Frequency
B)Class size
C)Relative frequency
D)Bin proportion
A)Frequency
B)Class size
C)Relative frequency
D)Bin proportion
فتح الحزمة
افتح القفل للوصول البطاقات البالغ عددها 65 في هذه المجموعة.
فتح الحزمة
k this deck
20
__________ are collected from several entities at the same point in time.
A)Time series data
B)Categorical and quantitative data
C)Cross-sectional data
D)Random data
A)Time series data
B)Categorical and quantitative data
C)Cross-sectional data
D)Random data
فتح الحزمة
افتح القفل للوصول البطاقات البالغ عددها 65 في هذه المجموعة.
فتح الحزمة
k this deck
21
The __________ is a point estimate of the population mean for the variable of interest.
A)sample mean
B)median
C)sample
D)geometric mean
A)sample mean
B)median
C)sample
D)geometric mean
فتح الحزمة
افتح القفل للوصول البطاقات البالغ عددها 65 في هذه المجموعة.
فتح الحزمة
k this deck
22
The correlation coefficient will always take values
A)greater than 0.
B)between -1 and 0.
C)between -1 and +1.
D)less than -1.
A)greater than 0.
B)between -1 and 0.
C)between -1 and +1.
D)less than -1.
فتح الحزمة
افتح القفل للوصول البطاقات البالغ عددها 65 في هذه المجموعة.
فتح الحزمة
k this deck
23
Compute the geometric mean for the following data on growth factors of an investment for 10 years. 1.10, 0.50, 0.70, 1.21, 1.25, 1.12, 1.16, 1.11, 1.13, 1.22
A)1.0221
B)1.0148
C)1.0363
D)1.1475
A)1.0221
B)1.0148
C)1.0363
D)1.1475
فتح الحزمة
افتح القفل للوصول البطاقات البالغ عددها 65 في هذه المجموعة.
فتح الحزمة
k this deck
24
If covariance between two variables is near 0, it implies that
A)a positive relationship exists between the variables.
B)the variables are not linearly related.
C)the variables are negatively related.
D)the variables are strongly related.
A)a positive relationship exists between the variables.
B)the variables are not linearly related.
C)the variables are negatively related.
D)the variables are strongly related.
فتح الحزمة
افتح القفل للوصول البطاقات البالغ عددها 65 في هذه المجموعة.
فتح الحزمة
k this deck
25
Which of the following graphs provides information on outliers and IQR of a data set?
A)Histogram
B)Line chart
C)Scatter chart
D)Box plot
A)Histogram
B)Line chart
C)Scatter chart
D)Box plot
فتح الحزمة
افتح القفل للوصول البطاقات البالغ عددها 65 في هذه المجموعة.
فتح الحزمة
k this deck
26
Identify the shape of the distribution in the figure below.
A)Skewed left
B)Symmetric
C)Approximately bell shaped
D)Skewed right
A)Skewed left
B)Symmetric
C)Approximately bell shaped
D)Skewed right
فتح الحزمة
افتح القفل للوصول البطاقات البالغ عددها 65 في هذه المجموعة.
فتح الحزمة
k this deck
27
A __________ determines how far a particular value is from the mean relative to the data set's standard deviation.
A)coefficient of variation
B)z-score
C)variance
D)percentile
A)coefficient of variation
B)z-score
C)variance
D)percentile
فتح الحزمة
افتح القفل للوصول البطاقات البالغ عددها 65 في هذه المجموعة.
فتح الحزمة
k this deck
28
Compute the coefficient of variation for the following sample data. 32, 41, 36, 24, 29, 30, 40, 22, 25, 37
A)18.64%
B)21.36%
C)20.28%
D)21.67%
A)18.64%
B)21.36%
C)20.28%
D)21.67%
فتح الحزمة
افتح القفل للوصول البطاقات البالغ عددها 65 في هذه المجموعة.
فتح الحزمة
k this deck
29
For data having a bell-shaped distribution, approximately __________ percent of the data values will be within one standard deviation of the mean.
A)95
B)66
C)68
D)97
A)95
B)66
C)68
D)97
فتح الحزمة
افتح القفل للوصول البطاقات البالغ عددها 65 في هذه المجموعة.
فتح الحزمة
k this deck
30
Compute the 50th percentile for the following data. 10, 15, 17, 21, 25, 12, 16, 11, 13, 22
A)18.6
B)13.3
C)15.5
D)17.7
A)18.6
B)13.3
C)15.5
D)17.7
فتح الحزمة
افتح القفل للوصول البطاقات البالغ عددها 65 في هذه المجموعة.
فتح الحزمة
k this deck
31
Compute the median of the following data. 32, 41, 36, 24, 29, 30, 40, 22, 25, 37
A)28
B)31
C)40
D)34
A)28
B)31
C)40
D)34
فتح الحزمة
افتح القفل للوصول البطاقات البالغ عددها 65 في هذه المجموعة.
فتح الحزمة
k this deck
32
Compute the IQR for the following data. 10, 15, 17, 21, 25, 12, 16, 11, 13, 22
A)6.25
B)7.75
C)5.14
D)9.50
A)6.25
B)7.75
C)5.14
D)9.50
فتح الحزمة
افتح القفل للوصول البطاقات البالغ عددها 65 في هذه المجموعة.
فتح الحزمة
k this deck
33
Scores on Ms. Bond's test have a mean of 70 and a standard deviation of 11. Michelle has a score of 48. Convert Michelle's score to a z-score. (Round to two decimal places if necessary.)
A)2
B)41.64
C)-2
D)1.33
A)2
B)41.64
C)-2
D)1.33
فتح الحزمة
افتح القفل للوصول البطاقات البالغ عددها 65 في هذه المجموعة.
فتح الحزمة
k this deck
34
Any data value with a z-score less than -3 or greater than +3 is considered to be a(n)
A)outlier.
B)statistic.
C)whisker.
D)z-score value.
A)outlier.
B)statistic.
C)whisker.
D)z-score value.
فتح الحزمة
افتح القفل للوصول البطاقات البالغ عددها 65 في هذه المجموعة.
فتح الحزمة
k this deck
35
The __________ shows the number of data items with values less than or equal to the upper class limit of each class.
A)cumulative frequency distribution
B)frequency distribution
C)percent frequency distribution
D)relative frequency distribution
A)cumulative frequency distribution
B)frequency distribution
C)percent frequency distribution
D)relative frequency distribution
فتح الحزمة
افتح القفل للوصول البطاقات البالغ عددها 65 في هذه المجموعة.
فتح الحزمة
k this deck
36
Compute the third quartile for the following data. 10, 15, 17, 21, 25, 12, 16, 11, 13, 22
A)21.25
B)15.5
C)21.5
D)11.75
A)21.25
B)15.5
C)21.5
D)11.75
فتح الحزمة
افتح القفل للوصول البطاقات البالغ عددها 65 في هذه المجموعة.
فتح الحزمة
k this deck
37
Use technology to compute the standard deviation for the following sample data. 32, 41, 36, 24, 29, 30, 40, 22, 25, 37
A)5.96
B)6.41
C)5.42
D)6.75
A)5.96
B)6.41
C)5.42
D)6.75
فتح الحزمة
افتح القفل للوصول البطاقات البالغ عددها 65 في هذه المجموعة.
فتح الحزمة
k this deck
38
Compute the mode for the following data. 12, 16, 19, 10, 12, 11, 21, 12, 21, 10
A)21
B)11
C)12
D)10
A)21
B)11
C)12
D)10
فتح الحزمة
افتح القفل للوصول البطاقات البالغ عددها 65 في هذه المجموعة.
فتح الحزمة
k this deck
39
The variance is based on the
A)deviation about the median.
B)number of variables.
C)deviation about the mean.
D)correlation in the data.
A)deviation about the median.
B)number of variables.
C)deviation about the mean.
D)correlation in the data.
فتح الحزمة
افتح القفل للوصول البطاقات البالغ عددها 65 في هذه المجموعة.
فتح الحزمة
k this deck
40
The simplest measure of variability is the
A)variance.
B)standard deviation.
C)coefficient of variation.
D)range.
A)variance.
B)standard deviation.
C)coefficient of variation.
D)range.
فتح الحزمة
افتح القفل للوصول البطاقات البالغ عددها 65 في هذه المجموعة.
فتح الحزمة
k this deck
41
Which graph represents a negative linear relationship between x and y?
A)A
B)B
C)C
D)None of the graphs display a negative linear relationship.
A)A
B)B
C)C
D)None of the graphs display a negative linear relationship.
فتح الحزمة
افتح القفل للوصول البطاقات البالغ عددها 65 في هذه المجموعة.
فتح الحزمة
k this deck
42
Below is a histogram for the number of days that it took Wyche Accounting to perform audits in the last quarter of last year. What is the bin size for the histogram?
A)3
B)4
C)16
D)5
A)3
B)4
C)16
D)5
فتح الحزمة
افتح القفل للوصول البطاقات البالغ عددها 65 في هذه المجموعة.
فتح الحزمة
k this deck
43
You have been asked to reorganize the Excel table below into order of sales using the Sales column. Which option will allow you to do this quickly? ? ?
?
A)Use the Cut and Paste function to reorganize the data into order of sales.
B)Use the Filter function to organize the data into order of sales.
C)Use the Order function to organize the data into order of sales.
D)Use the Sort function to organize the data into order of sales.
?
A)Use the Cut and Paste function to reorganize the data into order of sales.
B)Use the Filter function to organize the data into order of sales.
C)Use the Order function to organize the data into order of sales.
D)Use the Sort function to organize the data into order of sales.
فتح الحزمة
افتح القفل للوصول البطاقات البالغ عددها 65 في هذه المجموعة.
فتح الحزمة
k this deck
44
Scores on Ms. Bond's test have a mean of 70 and a standard deviation of 11. David has a score of 52 on Ms. Bond's test. Scores on Ms. Nash's test have a mean of 64 and a standard deviation of 6. Steven has a score of 52 on Ms. Nash's test. Which student has the higher standardized score?
A)David's standardized score is -1.64 and Steven's standardized score is -2.00. Therefore, David has the higher standardized score.
B)David's standardized score is -1.64 and Steven's standardized score is -2.00. Therefore, Steven has the higher standardized score.
C)David's standardized score is 1.64 and Steven's standardized score is 2.00. Therefore, Steven has the higher standardized score.
D)Cannot be determined with the information provided.
فتح الحزمة
افتح القفل للوصول البطاقات البالغ عددها 65 في هذه المجموعة.
فتح الحزمة
k this deck
45
Which Excel command will return all modes when more than one mode exists?
A)MODE.MULT
B)MODE.SNGL
C)MODE
D)MODES
A)MODE.MULT
B)MODE.SNGL
C)MODE
D)MODES
فتح الحزمة
افتح القفل للوصول البطاقات البالغ عددها 65 في هذه المجموعة.
فتح الحزمة
k this deck
46
Compute the relative frequency for students who earned a C shown in the table of grades below. ? ?
A)0.43
B)0.53
C)0.83
D)Not enough information
A)0.43
B)0.53
C)0.83
D)Not enough information
فتح الحزمة
افتح القفل للوصول البطاقات البالغ عددها 65 في هذه المجموعة.
فتح الحزمة
k this deck
47
What is the total relative frequency? ?
A)1
B)99.12
C)0.88
D)Not enough information
A)1
B)99.12
C)0.88
D)Not enough information
فتح الحزمة
افتح القفل للوصول البطاقات البالغ عددها 65 في هذه المجموعة.
فتح الحزمة
k this deck
48
Below is a histogram for the number of days that it took Wyche Accounting to perform audits in the last quarter of last year. What is the relative frequency of the 21-24 bin?
A)0.05
B)0.14
C)0.25
D)2.5
A)0.05
B)0.14
C)0.25
D)2.5
فتح الحزمة
افتح القفل للوصول البطاقات البالغ عددها 65 في هذه المجموعة.
فتح الحزمة
k this deck
49
James's manager asked him to sort the last names in the following list in descending order. What does this mean? ? ?
?
A)The last names must be sorted from A to Z.
B)The last names must be sorted from Z to A.
C)The last names must be sorted from the earliest to the latest that has been added to the list.
D)James should use the Sort function to organize the data into order of sales.
?
A)The last names must be sorted from A to Z.
B)The last names must be sorted from Z to A.
C)The last names must be sorted from the earliest to the latest that has been added to the list.
D)James should use the Sort function to organize the data into order of sales.
فتح الحزمة
افتح القفل للوصول البطاقات البالغ عددها 65 في هذه المجموعة.
فتح الحزمة
k this deck
50
Scores on Ms. Nash's test have a mean of 64 and a standard deviation of 9. Steve has a score of 52. Convert Steve's score to a z-score. (Round to two decimal places if necessary.)
A)1.33
B)58.2
C)-2
D)-1.33
A)1.33
B)58.2
C)-2
D)-1.33
فتح الحزمة
افتح القفل للوصول البطاقات البالغ عددها 65 في هذه المجموعة.
فتح الحزمة
k this deck
51
Compute the relative frequency for students who earned an A shown in the table of grades below. ? ?
A)0.12
B)0.10
C)0.83
D)Not enough information
A)0.12
B)0.10
C)0.83
D)Not enough information
فتح الحزمة
افتح القفل للوصول البطاقات البالغ عددها 65 في هذه المجموعة.
فتح الحزمة
k this deck
52
What is the mode of the data set given below?
35, 47, 65, 47, 22
A)47.5
B)47
C)65
D)22
35, 47, 65, 47, 22
A)47.5
B)47
C)65
D)22
فتح الحزمة
افتح القفل للوصول البطاقات البالغ عددها 65 في هذه المجموعة.
فتح الحزمة
k this deck
53
The College Board reported that the mean Math Level 2 SAT subject test score was 686 with a standard deviation of 96. Assuming scores follow a bell-shaped distribution, use the empirical rule to find the percentage of students who scored less than 494.
A)97.5%
B)95%
C)2.5%
D)5%
A)97.5%
B)95%
C)2.5%
D)5%
فتح الحزمة
افتح القفل للوصول البطاقات البالغ عددها 65 في هذه المجموعة.
فتح الحزمة
k this deck
54
A sample of 13 adult males' heights are listed below.
70, 72, 71, 70, 69, 73, 69, 68, 70, 71, 67, 71, 74
Find the range of the data.
A)7
B)6.5
C)5
D)4
70, 72, 71, 70, 69, 73, 69, 68, 70, 71, 67, 71, 74
Find the range of the data.
A)7
B)6.5
C)5
D)4
فتح الحزمة
افتح القفل للوصول البطاقات البالغ عددها 65 في هذه المجموعة.
فتح الحزمة
k this deck
55
Select the histogram that is moderately skewed right.
A)A
B)B
C)C
D)D
A)A
B)B
C)C
D)D
فتح الحزمة
افتح القفل للوصول البطاقات البالغ عددها 65 في هذه المجموعة.
فتح الحزمة
k this deck
56
Below is a histogram for the number of days that it took Wyche Accounting to perform audits in the last quarter of last year. What is the frequency of the 25-28 bin?
A)0.05
B)1
C)0.5
D)4
A)0.05
B)1
C)0.5
D)4
فتح الحزمة
افتح القفل للوصول البطاقات البالغ عددها 65 في هذه المجموعة.
فتح الحزمة
k this deck
57
Below is the data for the number of days that it took Wyche Accounting to perform audits in the last quarter of last year.
56, 42, 37, 29, 45, 51, 30, 25, 34, 57
What is the median number of days that it took Wyche Accounting to perform audits in the last quarter of last year?
A)41
B)40.6
C)39.5
D)42
56, 42, 37, 29, 45, 51, 30, 25, 34, 57
What is the median number of days that it took Wyche Accounting to perform audits in the last quarter of last year?
A)41
B)40.6
C)39.5
D)42
فتح الحزمة
افتح القفل للوصول البطاقات البالغ عددها 65 في هذه المجموعة.
فتح الحزمة
k this deck
58
The College Board originally scaled SAT scores so that the scores for each section were approximately normally distributed with a mean of 500 and a standard deviation of 100. Assuming scores follow a bell-shaped distribution, use the empirical rule to find the percentage of students who scored less than 400.
A)16%
B)68%
C)84%
D)32%
A)16%
B)68%
C)84%
D)32%
فتح الحزمة
افتح القفل للوصول البطاقات البالغ عددها 65 في هذه المجموعة.
فتح الحزمة
k this deck
59
The College Board originally scaled SAT scores so that the scores for each section were approximately normally distributed with a mean of 500 and a standard deviation of 100. Assuming scores follow a bell-shaped distribution, use the empirical rule to find the percentage of students who scored greater than 700.
A)97.5%
B)95%
C)2.5%
D)5%
A)97.5%
B)95%
C)2.5%
D)5%
فتح الحزمة
افتح القفل للوصول البطاقات البالغ عددها 65 في هذه المجموعة.
فتح الحزمة
k this deck
60
In a survey of patients in a local hospital, 62.42% of the respondents indicated that the health care providers needed to spend more time with each patient. Who makes up the population?
A)All patients in a local hospital
B)All survey respondents
C)Hospital patients
D)Cannot be determined from the information given
A)All patients in a local hospital
B)All survey respondents
C)Hospital patients
D)Cannot be determined from the information given
فتح الحزمة
افتح القفل للوصول البطاقات البالغ عددها 65 في هذه المجموعة.
فتح الحزمة
k this deck
61
In a survey of patients in a local hospital, 62.42% of the respondents indicated that the health care providers needed to spend more time with each patient. Who makes up the sample?
A)All patients in a local hospital
B)All survey respondents
C)Hospital patients
D)Cannot be determined from the information given
A)All patients in a local hospital
B)All survey respondents
C)Hospital patients
D)Cannot be determined from the information given
فتح الحزمة
افتح القفل للوصول البطاقات البالغ عددها 65 في هذه المجموعة.
فتح الحزمة
k this deck
62
The distribution of hourly sales for a local family owned store is normally distributed with a mean of $225 per hour and a standard deviation of $75 per hour. Which of the following intervals contains the middle 95% of hourly sales?
A)$75 to $375
B)$150 to $300
C)$175 to $275
D)$125 to $325
A)$75 to $375
B)$150 to $300
C)$175 to $275
D)$125 to $325
فتح الحزمة
افتح القفل للوصول البطاقات البالغ عددها 65 في هذه المجموعة.
فتح الحزمة
k this deck
63
Which of the following relationships would have a negative correlation coefficient?
A)Supply and demand
B)Amount of a bill at a restaurant and the amount of the tip
C)Cost of a car and the amount of tax to be paid
D)The square footage of a home and the price of the home
A)Supply and demand
B)Amount of a bill at a restaurant and the amount of the tip
C)Cost of a car and the amount of tax to be paid
D)The square footage of a home and the price of the home
فتح الحزمة
افتح القفل للوصول البطاقات البالغ عددها 65 في هذه المجموعة.
فتح الحزمة
k this deck
64
A manager of a fast food restaurant wants the drive-thru employee to ask every fifth customer if he or she is satisfied with the service. Who makes up the population?
A)All customers who use the drive-thru window of this fast food restaurant
B)All survey respondents
C)All customers of this restaurant
D)The proportion of customers who say they are satisfied with their service
A)All customers who use the drive-thru window of this fast food restaurant
B)All survey respondents
C)All customers of this restaurant
D)The proportion of customers who say they are satisfied with their service
فتح الحزمة
افتح القفل للوصول البطاقات البالغ عددها 65 في هذه المجموعة.
فتح الحزمة
k this deck
65
A manager of a fast food restaurant wants the drive-thru employee to ask every fifth customer if he or she is satisfied with the service. Who makes up the sample?
A)All customers who use the drive-thru window of this fast food restaurant
B)All survey respondents
C)All customers of this restaurant
D)The proportion of customers who say they are satisfied with their service
A)All customers who use the drive-thru window of this fast food restaurant
B)All survey respondents
C)All customers of this restaurant
D)The proportion of customers who say they are satisfied with their service
فتح الحزمة
افتح القفل للوصول البطاقات البالغ عددها 65 في هذه المجموعة.
فتح الحزمة
k this deck
فتح الحزمة
افتح القفل للوصول البطاقات البالغ عددها 65 في هذه المجموعة.


