Deck 2: Graphical Descriptive Techniques I
ملء الشاشة (f)
سؤال
NARRBEGIN: Internet Classes
Internet Classes
A survey of 25 students was conducted to determine how they rate the quality of Internet classes. Students were asked to rate the overall quality from 0 (no quality at all) to 100 (extremely good quality). The stem-and-leaf display of the data is shown below. NARREND
-A survey of 100 adults was conducted to see if gender is related to pet ownership. The results are summarized in the bar chart below. Which of the following statements describes the relationship?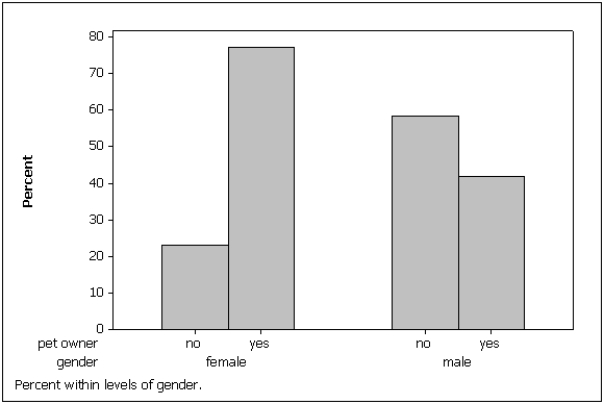
A)Pet ownership and gender are not related.
B)More females own pets than don't own pets.
C)Fewer males own pets than don't own pets.
D)None of these choices.
سؤال
سؤال
سؤال
سؤال
NARRBEGIN: Internet Classes
Internet Classes
A survey of 25 students was conducted to determine how they rate the quality of Internet classes. Students were asked to rate the overall quality from 0 (no quality at all) to 100 (extremely good quality). The stem-and-leaf display of the data is shown below. NARREND
A cross-classification table is used to describe the relationship between two ____________________ variables.
Internet Classes
A survey of 25 students was conducted to determine how they rate the quality of Internet classes. Students were asked to rate the overall quality from 0 (no quality at all) to 100 (extremely good quality). The stem-and-leaf display of the data is shown below.
NARRENDA cross-classification table is used to describe the relationship between two ____________________ variables.
سؤال
سؤال
NARRBEGIN: Internet Classes
Internet Classes
A survey of 25 students was conducted to determine how they rate the quality of Internet classes. Students were asked to rate the overall quality from 0 (no quality at all) to 100 (extremely good quality). The stem-and-leaf display of the data is shown below. NARREND
-The bar charts below summarize data collected on 100 adults regarding gender and pet ownership. Which of the following statements is (are) true based on this chart?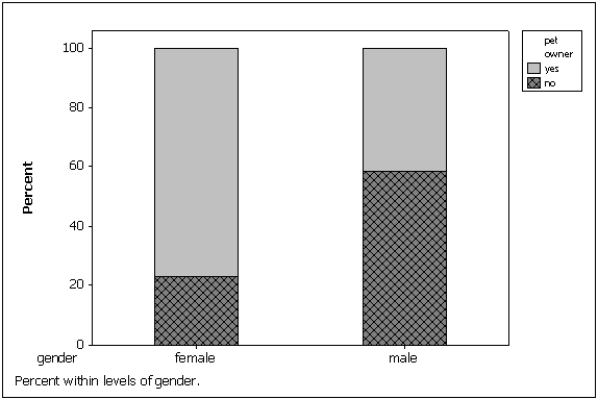
A)Gender and pet ownership are related; a higher percentage of males own pets than females.
B)Gender and pet ownership are related; a higher percentage of females own pets than males.
C)Gender and pet ownership are related; males and females own the same percentage of pets.
D)Gender and pet ownership are not related.
سؤال
سؤال
سؤال
سؤال
سؤال
سؤال
سؤال
NARRBEGIN: Internet Classes
Internet Classes
A survey of 25 students was conducted to determine how they rate the quality of Internet classes. Students were asked to rate the overall quality from 0 (no quality at all) to 100 (extremely good quality). The stem-and-leaf display of the data is shown below. NARREND
To evaluate two nominal variables at the same time, a(n) ____________________ table should be created from the data.
Internet Classes
A survey of 25 students was conducted to determine how they rate the quality of Internet classes. Students were asked to rate the overall quality from 0 (no quality at all) to 100 (extremely good quality). The stem-and-leaf display of the data is shown below.
NARRENDTo evaluate two nominal variables at the same time, a(n) ____________________ table should be created from the data.
سؤال
سؤال
سؤال
NARRBEGIN: Internet Classes
Internet Classes
A survey of 25 students was conducted to determine how they rate the quality of Internet classes. Students were asked to rate the overall quality from 0 (no quality at all) to 100 (extremely good quality). The stem-and-leaf display of the data is shown below. NARREND
Data that contains information on two variables is called ____________________ data.
Internet Classes
A survey of 25 students was conducted to determine how they rate the quality of Internet classes. Students were asked to rate the overall quality from 0 (no quality at all) to 100 (extremely good quality). The stem-and-leaf display of the data is shown below.
NARRENDData that contains information on two variables is called ____________________ data.
سؤال
NARRBEGIN: Internet Classes
Internet Classes
A survey of 25 students was conducted to determine how they rate the quality of Internet classes. Students were asked to rate the overall quality from 0 (no quality at all) to 100 (extremely good quality). The stem-and-leaf display of the data is shown below. NARREND
-Two hundred males and two hundred females were asked whether or not college baseball should have a playoff system (yes/no/undecided). Pie charts of the responses for males vs. females are shown below. Which of the following describes the relationship between gender and opinion?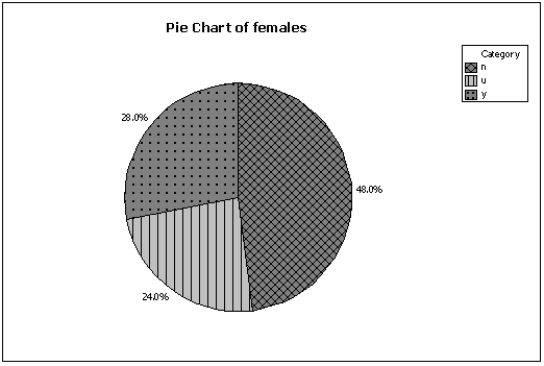
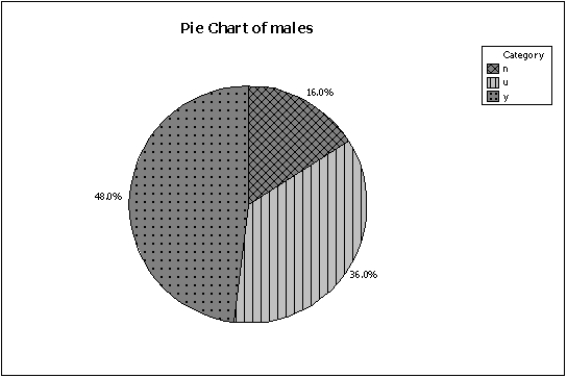
A)A higher percentage of males want a playoff system compared to females.
B)More males than females are undecided on this issue.
C)Gender and opinion on a playoff system are related.
D)All of these choices are true.
Internet Classes
A survey of 25 students was conducted to determine how they rate the quality of Internet classes. Students were asked to rate the overall quality from 0 (no quality at all) to 100 (extremely good quality). The stem-and-leaf display of the data is shown below. NARREND
-Two hundred males and two hundred females were asked whether or not college baseball should have a playoff system (yes/no/undecided). Pie charts of the responses for males vs. females are shown below. Which of the following describes the relationship between gender and opinion?
A)A higher percentage of males want a playoff system compared to females.
B)More males than females are undecided on this issue.
C)Gender and opinion on a playoff system are related.
D)All of these choices are true.
سؤال
سؤال
سؤال
Using the following cross-classification table, draw two bar charts that compare pet ownership for males vs. females. Are gender and pet ownership related?

سؤال
NARRBEGIN: All-Nighters
All-Nighters
A sample of 400 students at a certain university was taken after the midterm; 200 students reported staying up all night before the midterm and the other 200 students did not. Researchers recorded whether each student did well or poorly on the midterm. The following table contains the results. NARREND
{All-Nighter Narrative} Of those who stayed up all night before the midterm, what percentage did well on the midterm?
All-Nighters
A sample of 400 students at a certain university was taken after the midterm; 200 students reported staying up all night before the midterm and the other 200 students did not. Researchers recorded whether each student did well or poorly on the midterm. The following table contains the results.
NARREND{All-Nighter Narrative} Of those who stayed up all night before the midterm, what percentage did well on the midterm?
سؤال
NARRBEGIN: Internet Classes
Internet Classes
A survey of 25 students was conducted to determine how they rate the quality of Internet classes. Students were asked to rate the overall quality from 0 (no quality at all) to 100 (extremely good quality). The stem-and-leaf display of the data is shown below. NARREND
If two bar charts made from the rows of a cross-classification table look the same, then the two nominal variables ____________________ (are/are not) related.
Internet Classes
A survey of 25 students was conducted to determine how they rate the quality of Internet classes. Students were asked to rate the overall quality from 0 (no quality at all) to 100 (extremely good quality). The stem-and-leaf display of the data is shown below.
NARRENDIf two bar charts made from the rows of a cross-classification table look the same, then the two nominal variables ____________________ (are/are not) related.
سؤال
NARRBEGIN: All-Nighters
All-Nighters
A sample of 400 students at a certain university was taken after the midterm; 200 students reported staying up all night before the midterm and the other 200 students did not. Researchers recorded whether each student did well or poorly on the midterm. The following table contains the results. NARREND
{All-Nighters Narrative} Briefly explain (using percentages) whether staying up all night before this midterm is related to a student doing poorly.
All-Nighters
A sample of 400 students at a certain university was taken after the midterm; 200 students reported staying up all night before the midterm and the other 200 students did not. Researchers recorded whether each student did well or poorly on the midterm. The following table contains the results.
NARREND{All-Nighters Narrative} Briefly explain (using percentages) whether staying up all night before this midterm is related to a student doing poorly.
سؤال
سؤال
NARRBEGIN: All-Nighters
All-Nighters
A sample of 400 students at a certain university was taken after the midterm; 200 students reported staying up all night before the midterm and the other 200 students did not. Researchers recorded whether each student did well or poorly on the midterm. The following table contains the results. NARREND
{All-Nighters Narrative} There is a relationship between whether or not a student stayed up all night before the midterm, and how well they did on the midterm. Describe this relationship using percentages.
All-Nighters
A sample of 400 students at a certain university was taken after the midterm; 200 students reported staying up all night before the midterm and the other 200 students did not. Researchers recorded whether each student did well or poorly on the midterm. The following table contains the results.
NARREND{All-Nighters Narrative} There is a relationship between whether or not a student stayed up all night before the midterm, and how well they did on the midterm. Describe this relationship using percentages.
سؤال
NARRBEGIN: All-Nighters
All-Nighters
A sample of 400 students at a certain university was taken after the midterm; 200 students reported staying up all night before the midterm and the other 200 students did not. Researchers recorded whether each student did well or poorly on the midterm. The following table contains the results. NARREND
{All-Nighters Narrative} Of those who did well on the midterm, what percentage stayed up all night before the midterm?
All-Nighters
A sample of 400 students at a certain university was taken after the midterm; 200 students reported staying up all night before the midterm and the other 200 students did not. Researchers recorded whether each student did well or poorly on the midterm. The following table contains the results.
NARREND{All-Nighters Narrative} Of those who did well on the midterm, what percentage stayed up all night before the midterm?
سؤال
سؤال
سؤال
سؤال
سؤال
سؤال
سؤال
سؤال
سؤال
NARRBEGIN: Internet Classes
Internet Classes
A survey of 25 students was conducted to determine how they rate the quality of Internet classes. Students were asked to rate the overall quality from 0 (no quality at all) to 100 (extremely good quality). The stem-and-leaf display of the data is shown below. NARREND
If two pie charts made from the rows of a cross-classification table look the same, then the two nominal variables ____________________ (are/are not) related.
Internet Classes
A survey of 25 students was conducted to determine how they rate the quality of Internet classes. Students were asked to rate the overall quality from 0 (no quality at all) to 100 (extremely good quality). The stem-and-leaf display of the data is shown below.
NARRENDIf two pie charts made from the rows of a cross-classification table look the same, then the two nominal variables ____________________ (are/are not) related.
سؤال
Using the following cross-classification table, draw two pie charts that compare pet ownership for males vs. females. Are gender and pet ownership related?

سؤال
NARRBEGIN: Internet Classes
Internet Classes
A survey of 25 students was conducted to determine how they rate the quality of Internet classes. Students were asked to rate the overall quality from 0 (no quality at all) to 100 (extremely good quality). The stem-and-leaf display of the data is shown below. NARREND
Data that contains information on a single variable is called ____________________ data.
Internet Classes
A survey of 25 students was conducted to determine how they rate the quality of Internet classes. Students were asked to rate the overall quality from 0 (no quality at all) to 100 (extremely good quality). The stem-and-leaf display of the data is shown below.
NARRENDData that contains information on a single variable is called ____________________ data.
سؤال
NARRBEGIN: Internet Classes
Internet Classes
A survey of 25 students was conducted to determine how they rate the quality of Internet classes. Students were asked to rate the overall quality from 0 (no quality at all) to 100 (extremely good quality). The stem-and-leaf display of the data is shown below. NARREND
You can graph the relationship between two nominal variables using two ____________________ or two ____________________.
Internet Classes
A survey of 25 students was conducted to determine how they rate the quality of Internet classes. Students were asked to rate the overall quality from 0 (no quality at all) to 100 (extremely good quality). The stem-and-leaf display of the data is shown below.
NARRENDYou can graph the relationship between two nominal variables using two ____________________ or two ____________________.
سؤال
سؤال
سؤال
سؤال
NARRBEGIN: Business Graduates
Business School Graduates
A sample of business school graduates were asked what their major was. The results are shown in the following frequency distribution. NARREND
{Business School Graduates Narrative} Draw a pie chart of this data. Are you able to reconstruct the original data from this pie chart alone?
Business School Graduates
A sample of business school graduates were asked what their major was. The results are shown in the following frequency distribution.
NARREND{Business School Graduates Narrative} Draw a pie chart of this data. Are you able to reconstruct the original data from this pie chart alone?
سؤال
NARRBEGIN: Business Graduates
Business School Graduates
A sample of business school graduates were asked what their major was. The results are shown in the following frequency distribution. NARREND
{Business School Graduates Narrative} How many graduates were surveyed?
Business School Graduates
A sample of business school graduates were asked what their major was. The results are shown in the following frequency distribution.
NARREND{Business School Graduates Narrative} How many graduates were surveyed?
سؤال
سؤال
NARRBEGIN: Business Graduates
Business School Graduates
A sample of business school graduates were asked what their major was. The results are shown in the following frequency distribution. NARREND
{Business School Graduates Narrative} If you were only given the frequency bar chart below, would you able to reconstruct the original observations in the data set?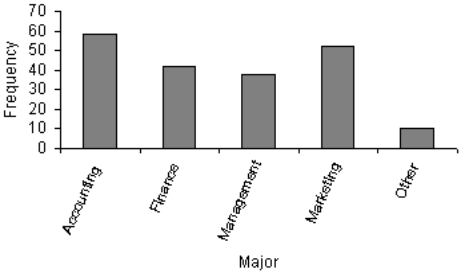
Business School Graduates
A sample of business school graduates were asked what their major was. The results are shown in the following frequency distribution.
NARREND{Business School Graduates Narrative} If you were only given the frequency bar chart below, would you able to reconstruct the original observations in the data set?
سؤال
NARRBEGIN: Car Buyers
Car Buyers
Forty car buyers were asked to indicate which car dealer offered the best overall service. The four choices were Contour Motors (C), Modern Chrysler (M), Tonneau Auto (T), and Uncanny Chevrolet (U). The following data were obtained:
 NARREND
{Car Buyers Narrative} Construct a pie chart of this data. Which car dealer offered the best overall service?
Car Buyers
Forty car buyers were asked to indicate which car dealer offered the best overall service. The four choices were Contour Motors (C), Modern Chrysler (M), Tonneau Auto (T), and Uncanny Chevrolet (U). The following data were obtained:
NARREND{Car Buyers Narrative} Construct a pie chart of this data. Which car dealer offered the best overall service?
سؤال
سؤال
NARRBEGIN: Business Graduates
Business School Graduates
A sample of business school graduates were asked what their major was. The results are shown in the following frequency distribution. NARREND
{Business School Graduates Narrative} Draw a pie chart to summarize this data. Which major was the most popular?
Business School Graduates
A sample of business school graduates were asked what their major was. The results are shown in the following frequency distribution.
NARREND{Business School Graduates Narrative} Draw a pie chart to summarize this data. Which major was the most popular?
سؤال
NARRBEGIN: Car Buyers
Car Buyers
Forty car buyers were asked to indicate which car dealer offered the best overall service. The four choices were Contour Motors (C), Modern Chrysler (M), Tonneau Auto (T), and Uncanny Chevrolet (U). The following data were obtained:
NARREND
{Car Buyers Narrative} Construct a frequency bar chart of this data. Which car dealer came in last place in terms of overall service?
Car Buyers
Forty car buyers were asked to indicate which car dealer offered the best overall service. The four choices were Contour Motors (C), Modern Chrysler (M), Tonneau Auto (T), and Uncanny Chevrolet (U). The following data were obtained:
NARREND{Car Buyers Narrative} Construct a frequency bar chart of this data. Which car dealer came in last place in terms of overall service?
سؤال
سؤال
سؤال
سؤال
سؤال
سؤال
NARRBEGIN: Business Graduates
Business School Graduates
A sample of business school graduates were asked what their major was. The results are shown in the following frequency distribution. NARREND
Suppose you measure the number of minutes it takes an employee to complete a task, where the maximum allowed time is 5 minutes, and each time is rounded to the nearest minute. Data from 130 employees is summarized below. Construct a frequency bar chart and a pie chart from this data. How long did it take most employees to complete the task?

Business School Graduates
A sample of business school graduates were asked what their major was. The results are shown in the following frequency distribution.
NARRENDSuppose you measure the number of minutes it takes an employee to complete a task, where the maximum allowed time is 5 minutes, and each time is rounded to the nearest minute. Data from 130 employees is summarized below. Construct a frequency bar chart and a pie chart from this data. How long did it take most employees to complete the task?
سؤال
سؤال
سؤال
سؤال
سؤال
سؤال
سؤال
سؤال
سؤال
سؤال
سؤال
سؤال
سؤال
سؤال
سؤال
سؤال
سؤال
سؤال
سؤال
سؤال
سؤال
سؤال
سؤال
سؤال

فتح الحزمة
قم بالتسجيل لفتح البطاقات في هذه المجموعة!
Unlock Deck
Unlock Deck
1/93
العب
ملء الشاشة (f)
Deck 2: Graphical Descriptive Techniques I
1
NARRBEGIN: Internet Classes
Internet Classes
A survey of 25 students was conducted to determine how they rate the quality of Internet classes. Students were asked to rate the overall quality from 0 (no quality at all) to 100 (extremely good quality). The stem-and-leaf display of the data is shown below. NARREND
-A survey of 100 adults was conducted to see if gender is related to pet ownership. The results are summarized in the bar chart below. Which of the following statements describes the relationship?
A)Pet ownership and gender are not related.
B)More females own pets than don't own pets.
C)Fewer males own pets than don't own pets.
D)None of these choices.
None of these choices.
2
NARRBEGIN: Internet Classes
Internet Classes
A survey of 25 students was conducted to determine how they rate the quality of Internet classes. Students were asked to rate the overall quality from 0 (no quality at all) to 100 (extremely good quality). The stem-and-leaf display of the data is shown below. NARREND
-In the following cross-classification table, how are gender and house ownership related?
A)The percentage of house owners is higher for males than for females.
B)The percentage of house owners is higher for females than for males.
C)The percentage of house owners is the same for females and males.
D)You cannot compare percentages for males and females since the total frequencies are not equal.
The percentage of house owners is the same for females and males.
3
NARRBEGIN: Internet Classes
Internet Classes
A survey of 25 students was conducted to determine how they rate the quality of Internet classes. Students were asked to rate the overall quality from 0 (no quality at all) to 100 (extremely good quality). The stem-and-leaf display of the data is shown below. NARREND
-A statistics professor classifies his students according to their grade point average (GPA) and their gender. The resulting cross-classification table is shown below. Which of the following describes the relationship between GPA and gender shown by this table?
A)A higher percentage of females have GPAs over 3.5, compared to males.
B)A lower percentage of females have GPAs over 3.5, compared to males.
C)Females and males each have the same percentage of GPAs over 3.5.
D)You cannot compare male and female GPAs because the total number in each group is not the same.
A higher percentage of females have GPAs over 3.5, compared to males.
4
NARRBEGIN: Internet Classes
Internet Classes
A survey of 25 students was conducted to determine how they rate the quality of Internet classes. Students were asked to rate the overall quality from 0 (no quality at all) to 100 (extremely good quality). The stem-and-leaf display of the data is shown below. NARREND
-When studying the responses to two nominal questions, we should develop a
A)cross-classification table.
B)frequency distribution table.
C)cumulative percentage distribution table.
D)scatter diagram.
فتح الحزمة
افتح القفل للوصول البطاقات البالغ عددها 93 في هذه المجموعة.
فتح الحزمة
k this deck
5
NARRBEGIN: Internet Classes
Internet Classes
A survey of 25 students was conducted to determine how they rate the quality of Internet classes. Students were asked to rate the overall quality from 0 (no quality at all) to 100 (extremely good quality). The stem-and-leaf display of the data is shown below. NARREND
A cross-classification table is used to describe the relationship between two ____________________ variables.
Internet Classes
A survey of 25 students was conducted to determine how they rate the quality of Internet classes. Students were asked to rate the overall quality from 0 (no quality at all) to 100 (extremely good quality). The stem-and-leaf display of the data is shown below.
NARRENDA cross-classification table is used to describe the relationship between two ____________________ variables.
فتح الحزمة
افتح القفل للوصول البطاقات البالغ عددها 93 في هذه المجموعة.
فتح الحزمة
k this deck
6
NARRBEGIN: Internet Classes
Internet Classes
A survey of 25 students was conducted to determine how they rate the quality of Internet classes. Students were asked to rate the overall quality from 0 (no quality at all) to 100 (extremely good quality). The stem-and-leaf display of the data is shown below. NARREND
-Which of the following techniques can be used to explore relationships between two nominal variables?
A)Comparing the relative frequencies within a cross-classification table.
B)Comparing pie charts, one for each column (or row).
C)Comparing bar charts, one for each column (or row).
D)All of these choices are true.
فتح الحزمة
افتح القفل للوصول البطاقات البالغ عددها 93 في هذه المجموعة.
فتح الحزمة
k this deck
7
NARRBEGIN: Internet Classes
Internet Classes
A survey of 25 students was conducted to determine how they rate the quality of Internet classes. Students were asked to rate the overall quality from 0 (no quality at all) to 100 (extremely good quality). The stem-and-leaf display of the data is shown below. NARREND
-The bar charts below summarize data collected on 100 adults regarding gender and pet ownership. Which of the following statements is (are) true based on this chart?
A)Gender and pet ownership are related; a higher percentage of males own pets than females.
B)Gender and pet ownership are related; a higher percentage of females own pets than males.
C)Gender and pet ownership are related; males and females own the same percentage of pets.
D)Gender and pet ownership are not related.
فتح الحزمة
افتح القفل للوصول البطاقات البالغ عددها 93 في هذه المجموعة.
فتح الحزمة
k this deck
8
NARRBEGIN: Internet Classes
Internet Classes
A survey of 25 students was conducted to determine how they rate the quality of Internet classes. Students were asked to rate the overall quality from 0 (no quality at all) to 100 (extremely good quality). The stem-and-leaf display of the data is shown below. NARREND
-A college professor classifies his students according to their grade point average (GPA) and their gender. The resulting cross-classification table is shown below. If you made a pie chart for male GPAs and a pie chart for female GPAs, those pie charts would look the same.
فتح الحزمة
افتح القفل للوصول البطاقات البالغ عددها 93 في هذه المجموعة.
فتح الحزمة
k this deck
9
NARRBEGIN: Internet Classes
Internet Classes
A survey of 25 students was conducted to determine how they rate the quality of Internet classes. Students were asked to rate the overall quality from 0 (no quality at all) to 100 (extremely good quality). The stem-and-leaf display of the data is shown below. NARREND
-To describe the relationship between two nominal variables you make a scatter diagram and look for a correlation.
فتح الحزمة
افتح القفل للوصول البطاقات البالغ عددها 93 في هذه المجموعة.
فتح الحزمة
k this deck
10
NARRBEGIN: Internet Classes
Internet Classes
A survey of 25 students was conducted to determine how they rate the quality of Internet classes. Students were asked to rate the overall quality from 0 (no quality at all) to 100 (extremely good quality). The stem-and-leaf display of the data is shown below. NARREND
-If two nominal variables are unrelated, the patterns exhibited in their corresponding pie charts should be approximately the same. If a relationship exists, then some pie charts will differ from others.
فتح الحزمة
افتح القفل للوصول البطاقات البالغ عددها 93 في هذه المجموعة.
فتح الحزمة
k this deck
11
NARRBEGIN: Internet Classes
Internet Classes
A survey of 25 students was conducted to determine how they rate the quality of Internet classes. Students were asked to rate the overall quality from 0 (no quality at all) to 100 (extremely good quality). The stem-and-leaf display of the data is shown below. NARREND
-If two nominal variables are unrelated, the patterns exhibited in their corresponding bar charts should be approximately the same. If a relationship exists, then some bar charts will differ from others.
فتح الحزمة
افتح القفل للوصول البطاقات البالغ عددها 93 في هذه المجموعة.
فتح الحزمة
k this deck
12
NARRBEGIN: Internet Classes
Internet Classes
A survey of 25 students was conducted to determine how they rate the quality of Internet classes. Students were asked to rate the overall quality from 0 (no quality at all) to 100 (extremely good quality). The stem-and-leaf display of the data is shown below. NARREND
-If the relative frequencies in the rows of a cross-classification table are similar, then the two variables shown in the table are not related.
فتح الحزمة
افتح القفل للوصول البطاقات البالغ عددها 93 في هذه المجموعة.
فتح الحزمة
k this deck
13
NARRBEGIN: Internet Classes
Internet Classes
A survey of 25 students was conducted to determine how they rate the quality of Internet classes. Students were asked to rate the overall quality from 0 (no quality at all) to 100 (extremely good quality). The stem-and-leaf display of the data is shown below. NARREND
-In the following cross-classification table, gender and car ownership are related.
فتح الحزمة
افتح القفل للوصول البطاقات البالغ عددها 93 في هذه المجموعة.
فتح الحزمة
k this deck
14
NARRBEGIN: Internet Classes
Internet Classes
A survey of 25 students was conducted to determine how they rate the quality of Internet classes. Students were asked to rate the overall quality from 0 (no quality at all) to 100 (extremely good quality). The stem-and-leaf display of the data is shown below. NARREND
To evaluate two nominal variables at the same time, a(n) ____________________ table should be created from the data.
Internet Classes
A survey of 25 students was conducted to determine how they rate the quality of Internet classes. Students were asked to rate the overall quality from 0 (no quality at all) to 100 (extremely good quality). The stem-and-leaf display of the data is shown below.
NARRENDTo evaluate two nominal variables at the same time, a(n) ____________________ table should be created from the data.
فتح الحزمة
افتح القفل للوصول البطاقات البالغ عددها 93 في هذه المجموعة.
فتح الحزمة
k this deck
15
NARRBEGIN: Internet Classes
Internet Classes
A survey of 25 students was conducted to determine how they rate the quality of Internet classes. Students were asked to rate the overall quality from 0 (no quality at all) to 100 (extremely good quality). The stem-and-leaf display of the data is shown below. NARREND
-A cross-classification table summarizes data from two nominal variables.
فتح الحزمة
افتح القفل للوصول البطاقات البالغ عددها 93 في هذه المجموعة.
فتح الحزمة
k this deck
16
NARRBEGIN: Internet Classes
Internet Classes
A survey of 25 students was conducted to determine how they rate the quality of Internet classes. Students were asked to rate the overall quality from 0 (no quality at all) to 100 (extremely good quality). The stem-and-leaf display of the data is shown below. NARREND
-A cross-classification table is the same thing as two frequency distribution tables, one for each variable.
فتح الحزمة
افتح القفل للوصول البطاقات البالغ عددها 93 في هذه المجموعة.
فتح الحزمة
k this deck
17
NARRBEGIN: Internet Classes
Internet Classes
A survey of 25 students was conducted to determine how they rate the quality of Internet classes. Students were asked to rate the overall quality from 0 (no quality at all) to 100 (extremely good quality). The stem-and-leaf display of the data is shown below. NARREND
Data that contains information on two variables is called ____________________ data.
Internet Classes
A survey of 25 students was conducted to determine how they rate the quality of Internet classes. Students were asked to rate the overall quality from 0 (no quality at all) to 100 (extremely good quality). The stem-and-leaf display of the data is shown below.
NARRENDData that contains information on two variables is called ____________________ data.
فتح الحزمة
افتح القفل للوصول البطاقات البالغ عددها 93 في هذه المجموعة.
فتح الحزمة
k this deck
18
NARRBEGIN: Internet Classes
Internet Classes
A survey of 25 students was conducted to determine how they rate the quality of Internet classes. Students were asked to rate the overall quality from 0 (no quality at all) to 100 (extremely good quality). The stem-and-leaf display of the data is shown below. NARREND
-Two hundred males and two hundred females were asked whether or not college baseball should have a playoff system (yes/no/undecided). Pie charts of the responses for males vs. females are shown below. Which of the following describes the relationship between gender and opinion?
A)A higher percentage of males want a playoff system compared to females.
B)More males than females are undecided on this issue.
C)Gender and opinion on a playoff system are related.
D)All of these choices are true.
فتح الحزمة
افتح القفل للوصول البطاقات البالغ عددها 93 في هذه المجموعة.
فتح الحزمة
k this deck
19
NARRBEGIN: Internet Classes
Internet Classes
A survey of 25 students was conducted to determine how they rate the quality of Internet classes. Students were asked to rate the overall quality from 0 (no quality at all) to 100 (extremely good quality). The stem-and-leaf display of the data is shown below. NARREND
-In the following cross-classification table, gender and fantasy baseball participation are related.
فتح الحزمة
افتح القفل للوصول البطاقات البالغ عددها 93 في هذه المجموعة.
فتح الحزمة
k this deck
20
NARRBEGIN: Internet Classes
Internet Classes
A survey of 25 students was conducted to determine how they rate the quality of Internet classes. Students were asked to rate the overall quality from 0 (no quality at all) to 100 (extremely good quality). The stem-and-leaf display of the data is shown below. NARREND
-The percentage of observations in each combination of the cross-classification table must be equal in order to show two nominal variables are not related.
فتح الحزمة
افتح القفل للوصول البطاقات البالغ عددها 93 في هذه المجموعة.
فتح الحزمة
k this deck
21
Using the following cross-classification table, draw two bar charts that compare pet ownership for males vs. females. Are gender and pet ownership related?
فتح الحزمة
افتح القفل للوصول البطاقات البالغ عددها 93 في هذه المجموعة.
فتح الحزمة
k this deck
22
NARRBEGIN: All-Nighters
All-Nighters
A sample of 400 students at a certain university was taken after the midterm; 200 students reported staying up all night before the midterm and the other 200 students did not. Researchers recorded whether each student did well or poorly on the midterm. The following table contains the results. NARREND
{All-Nighter Narrative} Of those who stayed up all night before the midterm, what percentage did well on the midterm?
All-Nighters
A sample of 400 students at a certain university was taken after the midterm; 200 students reported staying up all night before the midterm and the other 200 students did not. Researchers recorded whether each student did well or poorly on the midterm. The following table contains the results.
NARREND{All-Nighter Narrative} Of those who stayed up all night before the midterm, what percentage did well on the midterm?
فتح الحزمة
افتح القفل للوصول البطاقات البالغ عددها 93 في هذه المجموعة.
فتح الحزمة
k this deck
23
NARRBEGIN: Internet Classes
Internet Classes
A survey of 25 students was conducted to determine how they rate the quality of Internet classes. Students were asked to rate the overall quality from 0 (no quality at all) to 100 (extremely good quality). The stem-and-leaf display of the data is shown below. NARREND
If two bar charts made from the rows of a cross-classification table look the same, then the two nominal variables ____________________ (are/are not) related.
Internet Classes
A survey of 25 students was conducted to determine how they rate the quality of Internet classes. Students were asked to rate the overall quality from 0 (no quality at all) to 100 (extremely good quality). The stem-and-leaf display of the data is shown below.
NARRENDIf two bar charts made from the rows of a cross-classification table look the same, then the two nominal variables ____________________ (are/are not) related.
فتح الحزمة
افتح القفل للوصول البطاقات البالغ عددها 93 في هذه المجموعة.
فتح الحزمة
k this deck
24
NARRBEGIN: All-Nighters
All-Nighters
A sample of 400 students at a certain university was taken after the midterm; 200 students reported staying up all night before the midterm and the other 200 students did not. Researchers recorded whether each student did well or poorly on the midterm. The following table contains the results. NARREND
{All-Nighters Narrative} Briefly explain (using percentages) whether staying up all night before this midterm is related to a student doing poorly.
All-Nighters
A sample of 400 students at a certain university was taken after the midterm; 200 students reported staying up all night before the midterm and the other 200 students did not. Researchers recorded whether each student did well or poorly on the midterm. The following table contains the results.
NARREND{All-Nighters Narrative} Briefly explain (using percentages) whether staying up all night before this midterm is related to a student doing poorly.
فتح الحزمة
افتح القفل للوصول البطاقات البالغ عددها 93 في هذه المجموعة.
فتح الحزمة
k this deck
25
One of the advantages of a pie chart is that it clearly shows that the total percentages of all the categories add to 100%.
فتح الحزمة
افتح القفل للوصول البطاقات البالغ عددها 93 في هذه المجموعة.
فتح الحزمة
k this deck
26
NARRBEGIN: All-Nighters
All-Nighters
A sample of 400 students at a certain university was taken after the midterm; 200 students reported staying up all night before the midterm and the other 200 students did not. Researchers recorded whether each student did well or poorly on the midterm. The following table contains the results. NARREND
{All-Nighters Narrative} There is a relationship between whether or not a student stayed up all night before the midterm, and how well they did on the midterm. Describe this relationship using percentages.
All-Nighters
A sample of 400 students at a certain university was taken after the midterm; 200 students reported staying up all night before the midterm and the other 200 students did not. Researchers recorded whether each student did well or poorly on the midterm. The following table contains the results.
NARREND{All-Nighters Narrative} There is a relationship between whether or not a student stayed up all night before the midterm, and how well they did on the midterm. Describe this relationship using percentages.
فتح الحزمة
افتح القفل للوصول البطاقات البالغ عددها 93 في هذه المجموعة.
فتح الحزمة
k this deck
27
NARRBEGIN: All-Nighters
All-Nighters
A sample of 400 students at a certain university was taken after the midterm; 200 students reported staying up all night before the midterm and the other 200 students did not. Researchers recorded whether each student did well or poorly on the midterm. The following table contains the results. NARREND
{All-Nighters Narrative} Of those who did well on the midterm, what percentage stayed up all night before the midterm?
All-Nighters
A sample of 400 students at a certain university was taken after the midterm; 200 students reported staying up all night before the midterm and the other 200 students did not. Researchers recorded whether each student did well or poorly on the midterm. The following table contains the results.
NARREND{All-Nighters Narrative} Of those who did well on the midterm, what percentage stayed up all night before the midterm?
فتح الحزمة
افتح القفل للوصول البطاقات البالغ عددها 93 في هذه المجموعة.
فتح الحزمة
k this deck
28
Which of the following statements about pie charts is false?
A)A pie chart is a graphical representation of a relative frequency distribution.
B)You can always determine frequencies for each category by looking at a pie chart.
C)The total percentage of all the slices of a pie chart is 100%.
D)The area of a slice of a pie chart is the proportion of all the individuals that fall into that particular category.
فتح الحزمة
افتح القفل للوصول البطاقات البالغ عددها 93 في هذه المجموعة.
فتح الحزمة
k this deck
29
From a pie chart you are able to find the frequency for each category.
فتح الحزمة
افتح القفل للوصول البطاقات البالغ عددها 93 في هذه المجموعة.
فتح الحزمة
k this deck
30
Bar and pie charts are graphical techniques for nominal data. The former focus the attention on the frequency of the occurrences of each category, and the later emphasizes the proportion of occurrences of each category.
فتح الحزمة
افتح القفل للوصول البطاقات البالغ عددها 93 في هذه المجموعة.
فتح الحزمة
k this deck
31
Which situation identifies when to use pie charts and/or bar charts?
A)You want to describe a single set of data.
B)Your data is nominal.
C)You want to show the number or the percentage of individuals in each category.
D)All of these choices are true.
A)You want to describe a single set of data.
B)Your data is nominal.
C)You want to show the number or the percentage of individuals in each category.
D)All of these choices are true.
فتح الحزمة
افتح القفل للوصول البطاقات البالغ عددها 93 في هذه المجموعة.
فتح الحزمة
k this deck
32
A frequency distribution lists the categories and the proportion with which each occurs.
فتح الحزمة
افتح القفل للوصول البطاقات البالغ عددها 93 في هذه المجموعة.
فتح الحزمة
k this deck
33
Suppose you measure the number of minutes it takes an employee to complete a task, where the maximum allowed time is 5 minutes, and each time is rounded to the nearest minute. Data from 130 employees is summarized below. How long did it take most employees to complete the task?
A)5 minutes
B)3 minutes
C)30 minutes
D)50 minutes
A)5 minutes
B)3 minutes
C)30 minutes
D)50 minutes
فتح الحزمة
افتح القفل للوصول البطاقات البالغ عددها 93 في هذه المجموعة.
فتح الحزمة
k this deck
34
Which of the following situations is best suited for a pie chart?
A)The number of dollars spent this year on each type of legal gambling.
B)The percentage of a charitable donation that goes to administrative costs vs. directly to the charity.
C)The number of students in your class who received an A, B, C, D, F on their exam.
D)All of these choices are true.
A)The number of dollars spent this year on each type of legal gambling.
B)The percentage of a charitable donation that goes to administrative costs vs. directly to the charity.
C)The number of students in your class who received an A, B, C, D, F on their exam.
D)All of these choices are true.
فتح الحزمة
افتح القفل للوصول البطاقات البالغ عددها 93 في هذه المجموعة.
فتح الحزمة
k this deck
35
A bar chart is used to represent interval data.
فتح الحزمة
افتح القفل للوصول البطاقات البالغ عددها 93 في هذه المجموعة.
فتح الحزمة
k this deck
36
NARRBEGIN: Internet Classes
Internet Classes
A survey of 25 students was conducted to determine how they rate the quality of Internet classes. Students were asked to rate the overall quality from 0 (no quality at all) to 100 (extremely good quality). The stem-and-leaf display of the data is shown below. NARREND
If two pie charts made from the rows of a cross-classification table look the same, then the two nominal variables ____________________ (are/are not) related.
Internet Classes
A survey of 25 students was conducted to determine how they rate the quality of Internet classes. Students were asked to rate the overall quality from 0 (no quality at all) to 100 (extremely good quality). The stem-and-leaf display of the data is shown below.
NARRENDIf two pie charts made from the rows of a cross-classification table look the same, then the two nominal variables ____________________ (are/are not) related.
فتح الحزمة
افتح القفل للوصول البطاقات البالغ عددها 93 في هذه المجموعة.
فتح الحزمة
k this deck
37
Using the following cross-classification table, draw two pie charts that compare pet ownership for males vs. females. Are gender and pet ownership related?
فتح الحزمة
افتح القفل للوصول البطاقات البالغ عددها 93 في هذه المجموعة.
فتح الحزمة
k this deck
38
NARRBEGIN: Internet Classes
Internet Classes
A survey of 25 students was conducted to determine how they rate the quality of Internet classes. Students were asked to rate the overall quality from 0 (no quality at all) to 100 (extremely good quality). The stem-and-leaf display of the data is shown below. NARREND
Data that contains information on a single variable is called ____________________ data.
Internet Classes
A survey of 25 students was conducted to determine how they rate the quality of Internet classes. Students were asked to rate the overall quality from 0 (no quality at all) to 100 (extremely good quality). The stem-and-leaf display of the data is shown below.
NARRENDData that contains information on a single variable is called ____________________ data.
فتح الحزمة
افتح القفل للوصول البطاقات البالغ عددها 93 في هذه المجموعة.
فتح الحزمة
k this deck
39
NARRBEGIN: Internet Classes
Internet Classes
A survey of 25 students was conducted to determine how they rate the quality of Internet classes. Students were asked to rate the overall quality from 0 (no quality at all) to 100 (extremely good quality). The stem-and-leaf display of the data is shown below. NARREND
You can graph the relationship between two nominal variables using two ____________________ or two ____________________.
Internet Classes
A survey of 25 students was conducted to determine how they rate the quality of Internet classes. Students were asked to rate the overall quality from 0 (no quality at all) to 100 (extremely good quality). The stem-and-leaf display of the data is shown below.
NARRENDYou can graph the relationship between two nominal variables using two ____________________ or two ____________________.
فتح الحزمة
افتح القفل للوصول البطاقات البالغ عددها 93 في هذه المجموعة.
فتح الحزمة
k this deck
40
A relative frequency distribution lists the categories and their counts.
فتح الحزمة
افتح القفل للوصول البطاقات البالغ عددها 93 في هذه المجموعة.
فتح الحزمة
k this deck
41
A(n) ____________________ chart is not able to show frequencies. It can only show relative frequencies.
فتح الحزمة
افتح القفل للوصول البطاقات البالغ عددها 93 في هذه المجموعة.
فتح الحزمة
k this deck
42
A bar chart is used to represent ____________________ data.
فتح الحزمة
افتح القفل للوصول البطاقات البالغ عددها 93 في هذه المجموعة.
فتح الحزمة
k this deck
43
NARRBEGIN: Business Graduates
Business School Graduates
A sample of business school graduates were asked what their major was. The results are shown in the following frequency distribution. NARREND
{Business School Graduates Narrative} Draw a pie chart of this data. Are you able to reconstruct the original data from this pie chart alone?
Business School Graduates
A sample of business school graduates were asked what their major was. The results are shown in the following frequency distribution.
NARREND{Business School Graduates Narrative} Draw a pie chart of this data. Are you able to reconstruct the original data from this pie chart alone?
فتح الحزمة
افتح القفل للوصول البطاقات البالغ عددها 93 في هذه المجموعة.
فتح الحزمة
k this deck
44
NARRBEGIN: Business Graduates
Business School Graduates
A sample of business school graduates were asked what their major was. The results are shown in the following frequency distribution. NARREND
{Business School Graduates Narrative} How many graduates were surveyed?
Business School Graduates
A sample of business school graduates were asked what their major was. The results are shown in the following frequency distribution.
NARREND{Business School Graduates Narrative} How many graduates were surveyed?
فتح الحزمة
افتح القفل للوصول البطاقات البالغ عددها 93 في هذه المجموعة.
فتح الحزمة
k this deck
45
A category in a pie chart that contains 50% of the observations is represented by a slice of the pie that is equal to ____________________ degrees.
فتح الحزمة
افتح القفل للوصول البطاقات البالغ عددها 93 في هذه المجموعة.
فتح الحزمة
k this deck
46
NARRBEGIN: Business Graduates
Business School Graduates
A sample of business school graduates were asked what their major was. The results are shown in the following frequency distribution. NARREND
{Business School Graduates Narrative} If you were only given the frequency bar chart below, would you able to reconstruct the original observations in the data set?
Business School Graduates
A sample of business school graduates were asked what their major was. The results are shown in the following frequency distribution.
NARREND{Business School Graduates Narrative} If you were only given the frequency bar chart below, would you able to reconstruct the original observations in the data set?
فتح الحزمة
افتح القفل للوصول البطاقات البالغ عددها 93 في هذه المجموعة.
فتح الحزمة
k this deck
47
NARRBEGIN: Car Buyers
Car Buyers
Forty car buyers were asked to indicate which car dealer offered the best overall service. The four choices were Contour Motors (C), Modern Chrysler (M), Tonneau Auto (T), and Uncanny Chevrolet (U). The following data were obtained:
NARREND
{Car Buyers Narrative} Construct a pie chart of this data. Which car dealer offered the best overall service?
Car Buyers
Forty car buyers were asked to indicate which car dealer offered the best overall service. The four choices were Contour Motors (C), Modern Chrysler (M), Tonneau Auto (T), and Uncanny Chevrolet (U). The following data were obtained:
NARREND{Car Buyers Narrative} Construct a pie chart of this data. Which car dealer offered the best overall service?
فتح الحزمة
افتح القفل للوصول البطاقات البالغ عددها 93 في هذه المجموعة.
فتح الحزمة
k this deck
48
In a pie chart, each slice is proportional to the ____________________ of individuals in that category.
فتح الحزمة
افتح القفل للوصول البطاقات البالغ عددها 93 في هذه المجموعة.
فتح الحزمة
k this deck
49
NARRBEGIN: Business Graduates
Business School Graduates
A sample of business school graduates were asked what their major was. The results are shown in the following frequency distribution. NARREND
{Business School Graduates Narrative} Draw a pie chart to summarize this data. Which major was the most popular?
Business School Graduates
A sample of business school graduates were asked what their major was. The results are shown in the following frequency distribution.
NARREND{Business School Graduates Narrative} Draw a pie chart to summarize this data. Which major was the most popular?
فتح الحزمة
افتح القفل للوصول البطاقات البالغ عددها 93 في هذه المجموعة.
فتح الحزمة
k this deck
50
NARRBEGIN: Car Buyers
Car Buyers
Forty car buyers were asked to indicate which car dealer offered the best overall service. The four choices were Contour Motors (C), Modern Chrysler (M), Tonneau Auto (T), and Uncanny Chevrolet (U). The following data were obtained:
NARREND
{Car Buyers Narrative} Construct a frequency bar chart of this data. Which car dealer came in last place in terms of overall service?
Car Buyers
Forty car buyers were asked to indicate which car dealer offered the best overall service. The four choices were Contour Motors (C), Modern Chrysler (M), Tonneau Auto (T), and Uncanny Chevrolet (U). The following data were obtained:
NARREND{Car Buyers Narrative} Construct a frequency bar chart of this data. Which car dealer came in last place in terms of overall service?
فتح الحزمة
افتح القفل للوصول البطاقات البالغ عددها 93 في هذه المجموعة.
فتح الحزمة
k this deck
51
Car buyers were asked to indicate the car dealer they believed offered the best overall service. The four choices were Convoy Motors (C), Mako Chrysler (M), Torrent Auto (T), and Unequaled Chevrolet (U). The following data were obtained: What percentage of car buyers identified Convoy Motors as having the best overall service?
A)1/4 = 0.25 or 25%
B)14/40 = 0.35 or 35%
C)14%
D)None of these choices.
A)1/4 = 0.25 or 25%
B)14/40 = 0.35 or 35%
C)14%
D)None of these choices.
فتح الحزمة
افتح القفل للوصول البطاقات البالغ عددها 93 في هذه المجموعة.
فتح الحزمة
k this deck
52
A(n) ____________________ chart is often used to display frequencies; a(n) ____________________ chart graphically shows relative frequencies.
فتح الحزمة
افتح القفل للوصول البطاقات البالغ عددها 93 في هذه المجموعة.
فتح الحزمة
k this deck
53
Twenty-five voters participating in a recent election exit poll in Minnesota were asked to state their political party affiliation. Coding the data as R for Republican, D for Democrat, and I for Independent, the data collected were as follows: I, R, D, I, R, I, I, D, R, I, I, D, R, R, I, D, I, R, I, D, I, D, R, R, and I. Construct a frequency bar chart from this data. What does the bar chart tell you about the political affiliations of those in this sample?
فتح الحزمة
افتح القفل للوصول البطاقات البالغ عددها 93 في هذه المجموعة.
فتح الحزمة
k this deck
54
Identify the type of data for which each of the following graphs is appropriate.
a.Pie chart
b.Bar chart
a.Pie chart
b.Bar chart
فتح الحزمة
افتح القفل للوصول البطاقات البالغ عددها 93 في هذه المجموعة.
فتح الحزمة
k this deck
55
A pie chart shows the ____________________ of individuals that fall into each category.
فتح الحزمة
افتح القفل للوصول البطاقات البالغ عددها 93 في هذه المجموعة.
فتح الحزمة
k this deck
56
NARRBEGIN: Business Graduates
Business School Graduates
A sample of business school graduates were asked what their major was. The results are shown in the following frequency distribution. NARREND
Suppose you measure the number of minutes it takes an employee to complete a task, where the maximum allowed time is 5 minutes, and each time is rounded to the nearest minute. Data from 130 employees is summarized below. Construct a frequency bar chart and a pie chart from this data. How long did it take most employees to complete the task?
Business School Graduates
A sample of business school graduates were asked what their major was. The results are shown in the following frequency distribution.
NARRENDSuppose you measure the number of minutes it takes an employee to complete a task, where the maximum allowed time is 5 minutes, and each time is rounded to the nearest minute. Data from 130 employees is summarized below. Construct a frequency bar chart and a pie chart from this data. How long did it take most employees to complete the task?
فتح الحزمة
افتح القفل للوصول البطاقات البالغ عددها 93 في هذه المجموعة.
فتح الحزمة
k this deck
57
A(n) ____________________ distribution lists the categories of a nominal variable and the proportion with which each occurs.
فتح الحزمة
افتح القفل للوصول البطاقات البالغ عددها 93 في هذه المجموعة.
فتح الحزمة
k this deck
58
Two types of graphs that organize nominal data are ____________________ and ____________________.
فتح الحزمة
افتح القفل للوصول البطاقات البالغ عددها 93 في هذه المجموعة.
فتح الحزمة
k this deck
59
We can summarize nominal data in a table that presents the categories and their counts. This table is called a(n) ____________________ distribution.
فتح الحزمة
افتح القفل للوصول البطاقات البالغ عددها 93 في هذه المجموعة.
فتح الحزمة
k this deck
60
A pie chart is used to represent ____________________ data.
فتح الحزمة
افتح القفل للوصول البطاقات البالغ عددها 93 في هذه المجموعة.
فتح الحزمة
k this deck
61
The values of quantitative data are categories.
فتح الحزمة
افتح القفل للوصول البطاقات البالغ عددها 93 في هذه المجموعة.
فتح الحزمة
k this deck
62
All calculations are permitted on what type of data?
A)Interval data
B)Nominal data
C)Ordinal data
D)All of these choices are true.
A)Interval data
B)Nominal data
C)Ordinal data
D)All of these choices are true.
فتح الحزمة
افتح القفل للوصول البطاقات البالغ عددها 93 في هذه المجموعة.
فتح الحزمة
k this deck
63
Your gender is a nominal variable.
فتح الحزمة
افتح القفل للوصول البطاقات البالغ عددها 93 في هذه المجموعة.
فتح الحزمة
k this deck
64
A variable is some characteristic of a population or sample.
فتح الحزمة
افتح القفل للوصول البطاقات البالغ عددها 93 في هذه المجموعة.
فتح الحزمة
k this deck
65
Interval data may be treated as ordinal or nominal.
فتح الحزمة
افتح القفل للوصول البطاقات البالغ عددها 93 في هذه المجموعة.
فتح الحزمة
k this deck
66
The classification of student major (accounting, economics, management, marketing, other) is an example of a(n)
A)nominal random variable.
B)interval random variable.
C)continuous random variable.
D)parameter.
A)nominal random variable.
B)interval random variable.
C)continuous random variable.
D)parameter.
فتح الحزمة
افتح القفل للوصول البطاقات البالغ عددها 93 في هذه المجموعة.
فتح الحزمة
k this deck
67
Nominal data are also called qualitative or categorical data.
فتح الحزمة
افتح القفل للوصول البطاقات البالغ عددها 93 في هذه المجموعة.
فتح الحزمة
k this deck
68
A researcher wishes to estimate the textbook costs of first-year students at Barry University. To do so, he recorded the textbook cost of 300 first-year students and found that their average textbook cost was $195 per semester. The variable of interest to the researcher is
A)textbook cost.
B)class rank.
C)number of students.
D)name of university.
A)textbook cost.
B)class rank.
C)number of students.
D)name of university.
فتح الحزمة
افتح القفل للوصول البطاقات البالغ عددها 93 في هذه المجموعة.
فتح الحزمة
k this deck
69
Whether or not you are over the age of 21 is a nominal variable.
فتح الحزمة
افتح القفل للوصول البطاقات البالغ عددها 93 في هذه المجموعة.
فتح الحزمة
k this deck
70
Your final grade in a course (A, B, C, D, E) is a nominal variable.
فتح الحزمة
افتح القفل للوصول البطاقات البالغ عددها 93 في هذه المجموعة.
فتح الحزمة
k this deck
71
Your age is an interval variable.
فتح الحزمة
افتح القفل للوصول البطاقات البالغ عددها 93 في هذه المجموعة.
فتح الحزمة
k this deck
72
With nominal data, there is one and only one way the possible values can be ordered.
فتح الحزمة
افتح القفل للوصول البطاقات البالغ عددها 93 في هذه المجموعة.
فتح الحزمة
k this deck
73
For which type of data are the values arbitrary numbers?
A)Interval data
B)Nominal data
C)Ordinal data
D)None of these choices.
A)Interval data
B)Nominal data
C)Ordinal data
D)None of these choices.
فتح الحزمة
افتح القفل للوصول البطاقات البالغ عددها 93 في هذه المجموعة.
فتح الحزمة
k this deck
74
Values must represent ordered rankings for what type of data?
A)Interval data
B)Nominal data
C)Ordinal data
D)None of these choices.
A)Interval data
B)Nominal data
C)Ordinal data
D)None of these choices.
فتح الحزمة
افتح القفل للوصول البطاقات البالغ عددها 93 في هذه المجموعة.
فتح الحزمة
k this deck
75
Your age group (1-9; 10-19; 20-29; 30-39; etc.) is an interval variable.
فتح الحزمة
افتح القفل للوصول البطاقات البالغ عددها 93 في هذه المجموعة.
فتح الحزمة
k this deck
76
All calculations are permitted on interval data.
فتح الحزمة
افتح القفل للوصول البطاقات البالغ عددها 93 في هذه المجموعة.
فتح الحزمة
k this deck
77
The classification of student class designation (freshman, sophomore, junior, senior) is an example of a(n)
A)nominal random variable.
B)interval random variable.
C)ordinal random variable.
D)a parameter.
A)nominal random variable.
B)interval random variable.
C)ordinal random variable.
D)a parameter.
فتح الحزمة
افتح القفل للوصول البطاقات البالغ عددها 93 في هذه المجموعة.
فتح الحزمة
k this deck
78
For what type of data are frequencies the only calculations that can be done?
A)Interval data
B)Nominal data
C)Ordinal data
D)None of these choices.
A)Interval data
B)Nominal data
C)Ordinal data
D)None of these choices.
فتح الحزمة
افتح القفل للوصول البطاقات البالغ عددها 93 في هذه المجموعة.
فتح الحزمة
k this deck
79
You cannot calculate and interpret differences between numbers assigned to nominal data.
فتح الحزمة
افتح القفل للوصول البطاقات البالغ عددها 93 في هذه المجموعة.
فتح الحزمة
k this deck
80
Interval data, such as heights, weights, and incomes, are also referred to as quantitative or numerical data.
فتح الحزمة
افتح القفل للوصول البطاقات البالغ عددها 93 في هذه المجموعة.
فتح الحزمة
k this deck
فتح الحزمة
افتح القفل للوصول البطاقات البالغ عددها 93 في هذه المجموعة.


