Deck 2: Data
ملء الشاشة (f)
سؤال
سؤال
سؤال
سؤال
سؤال
سؤال
سؤال
سؤال
سؤال
سؤال
سؤال
سؤال
سؤال
سؤال
سؤال
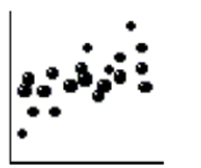
If the point in the upper right corner of this scatterplot is removed from the data set, then what will happen to the slope of the line of best fit (b) and to the correlation (r)? 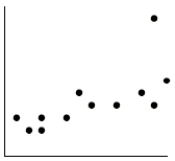
A) both will decrease.
B) both will remain the same.
C) both will increase.
D) b will decrease, and r will increase.
E) b will increase, and r will decrease.
A) both will decrease.
B) both will remain the same.
C) both will increase.
D) b will decrease, and r will increase.
E) b will increase, and r will decrease.
سؤال
سؤال
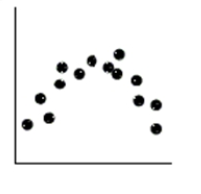
The residuals plot for a linear model is shown. Which is true? 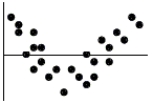
A) The linear model is no good because of the curve in the residuals.
B) The linear model is okay because approximately the same number of points are above the line as below it.
C) The linear model is no good because some residuals are large.
D) The linear model is no good because the correlation is near 0.
E) The linear model is okay because the association between the two variables is fairly strong.
سؤال
سؤال
سؤال
سؤال
سؤال
سؤال
سؤال
سؤال
Which scatterplot shows a strong association between two variables even though the correlation is probably near zero?
A)
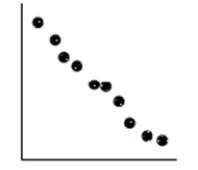
B)
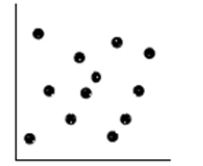
C)
D)
E)
A)
B)
C)
D)
E)
سؤال
سؤال
سؤال
سؤال
سؤال
سؤال
سؤال
سؤال
سؤال
سؤال
سؤال
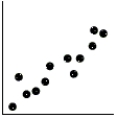
A least squares line of regression has been fitted to a scatterplot; the model's residuals plot is shown. Which is true? 
A) The linear model is poor because the correlation is near 0.
B) None of these.
C) The linear model is appropriate.
D) The linear model is poor because some residuals are large.
E) A curved model would be better.
A) The linear model is poor because the correlation is near 0.
B) None of these.
C) The linear model is appropriate.
D) The linear model is poor because some residuals are large.
E) A curved model would be better.
سؤال
سؤال
سؤال
سؤال
سؤال
سؤال
During a science lab, students heated water, allowed it to cool, and recorded the temperature over time. They computed the difference between the water temperature and the room temperature. The results are in the table.
-Newton's Law of Cooling suggests an exponential function is appropriate. Re-express the data using logarithms and sketch a new scatterplot.
-Newton's Law of Cooling suggests an exponential function is appropriate. Re-express the data using logarithms and sketch a new scatterplot.
سؤال
سؤال
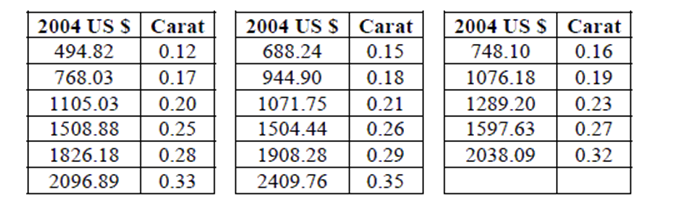
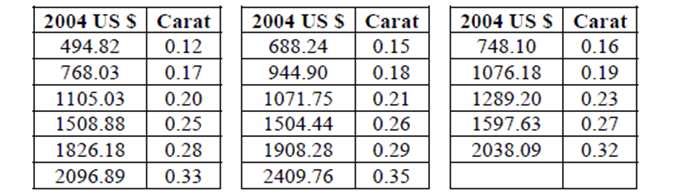
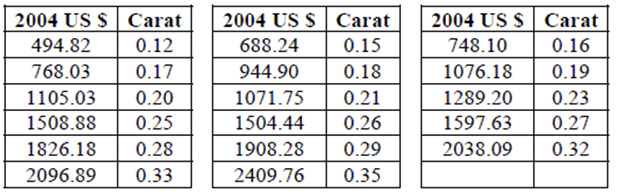
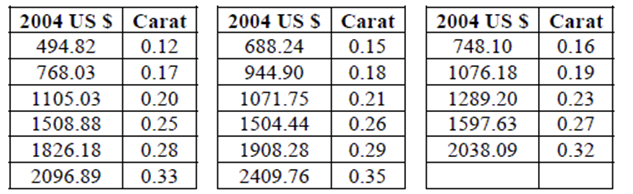
An article in the Journal of Statistics Education reported the price of diamonds of different sizes in Singapore dollars
(SGD). The following table contains a data set that is consistent with this data, adjusted to US dollars in 2004:
-Would it be better for a customer buying a diamond to have a negative residual or a positive residual from this model? Explain.
(SGD). The following table contains a data set that is consistent with this data, adjusted to US dollars in 2004:
-Would it be better for a customer buying a diamond to have a negative residual or a positive residual from this model? Explain.
سؤال
سؤال
سؤال
سؤال
Maple trees A forester would like to know how big a maple tree might be at age 50 years.
She gathers data from some trees that have been cut down, and plots the diameters (in
inches) of the trees against their ages (in years). First she makes a linear model. The scatterplot and residuals plot are shown.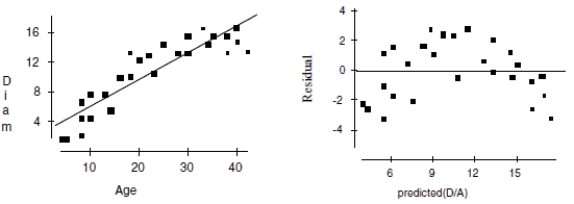
a. Describe the association shown in the scatterplot.
b. Do you think the linear model is appropriate? Explain.
c. If she uses this model to try to predict the diameter of a 50-year old maple tree, would you expect that estimate to be fairly accurate, too low, or too high? Explain.
Now she re-expresses the data, using the logarithm of age to try to predict the diameter of the tree. Here are the regression analysis and the residuals plot.
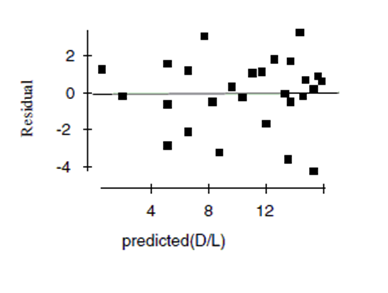
d. Explain why you think this is a better model.
e. Using this model, predict the diameter of a maple tree at age 50 years.
She gathers data from some trees that have been cut down, and plots the diameters (in
inches) of the trees against their ages (in years). First she makes a linear model. The scatterplot and residuals plot are shown.
a. Describe the association shown in the scatterplot.
b. Do you think the linear model is appropriate? Explain.
c. If she uses this model to try to predict the diameter of a 50-year old maple tree, would you expect that estimate to be fairly accurate, too low, or too high? Explain.
Now she re-expresses the data, using the logarithm of age to try to predict the diameter of the tree. Here are the regression analysis and the residuals plot.
d. Explain why you think this is a better model.
e. Using this model, predict the diameter of a maple tree at age 50 years.
سؤال
سؤال
سؤال
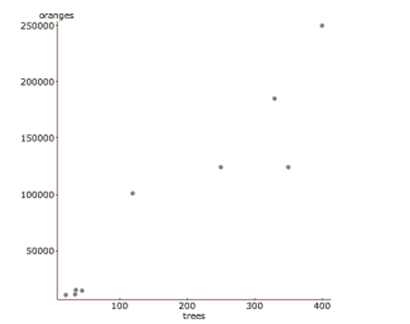
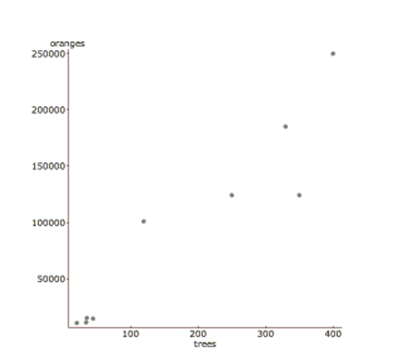
A study examined the number of trees in a variety of orange groves and the corresponding number of oranges that each grove produces in a given harvest year. Linear regression was calculated and the results are below.
linear regression results:
Dependent Variable:
oranges
Independent Variable: trees
Sample size: 9
R-sq = 0.886 s = 31394.7
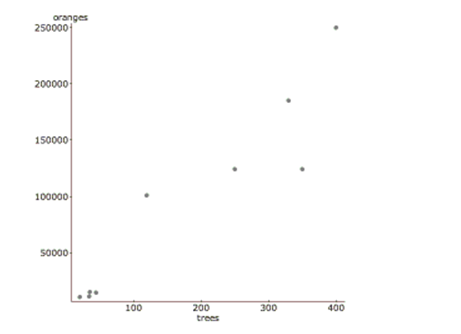
-Write the regression equation. Define all variables used in your equation.
linear regression results:
Dependent Variable:
oranges
Independent Variable: trees
Sample size: 9
R-sq = 0.886 s = 31394.7
-Write the regression equation. Define all variables used in your equation.
سؤال
The following is a scatterplot of the average final exam score versus midterm score for 11 sections of an introductory statistics class:
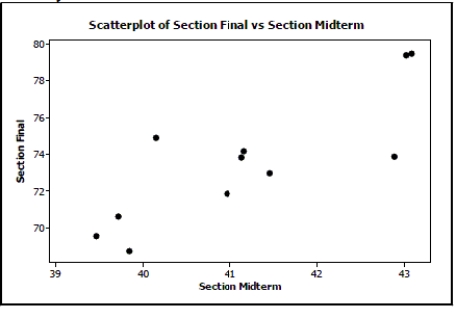
The correlation coefficient for these data is r = 0.829. If you had a scatterplot of the final exam score versus midterm score for all individual students in this introductory statistics course, would the correlation coefficient be weaker, stronger, or about the same? Explain.
The correlation coefficient for these data is r = 0.829. If you had a scatterplot of the final exam score versus midterm score for all individual students in this introductory statistics course, would the correlation coefficient be weaker, stronger, or about the same? Explain.
سؤال
سؤال
Subaru costs Data collected from internet ads for 1999 Subarus were used to create a model to estimate
the asking price of the car based on the number of miles it had been driven. The model has
=0.47
and equation = 15,327 - 0.11(Miles). The plot of residuals versus the predicted price is
shown.
a. Do you think you could make accurate estimates of Subaru prices with this model? Explain.
b. Interpret the slope of the line.
c. One of the cars in the data set had been driven 42,000 miles. How much was the owner
asking for it? (Show work.)
سؤال
سؤال
If the point in the upper left corner of the scatterplot is removed, what will happen to the correlation (r) and the slope of the line of best fit (b)? 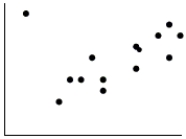
A) r will decrease and b will increase.
B) Both will decrease.
C) r will increase and b will decrease.
D) They will not change.
E) Both will increase.
A) r will decrease and b will increase.
B) Both will decrease.
C) r will increase and b will decrease.
D) They will not change.
E) Both will increase.
سؤال
Current research states that a good diet should contain 20-35 grams of dietary fiber. Research also states that each day should start with a healthy breakfast. The nutritional information for 77 breakfast cereals was reviewed to find the grams of fiber and the number of calories per serving. The scatterplot below shows the relationship between fiber and calories for the cereals.
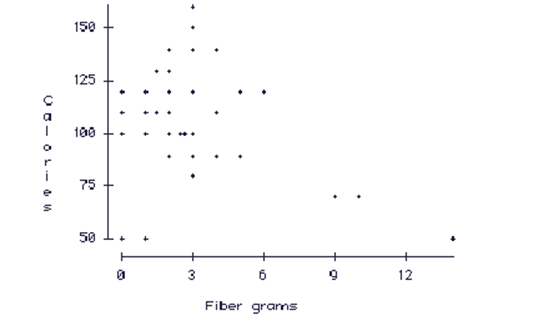
-Do you think there is a clear pattern? Describe the association between fiber and calories.
-Do you think there is a clear pattern? Describe the association between fiber and calories.
سؤال
Baseball coaches use a radar gun to measure the speed of pitcher’s fastball. They also record outcomes such as hits and strikeouts. The scatterplot below shows the relationship between the average speed of a fastball and the average number of strikeouts per nine innings for each pitcher on the Bulldogs, based on the past season.
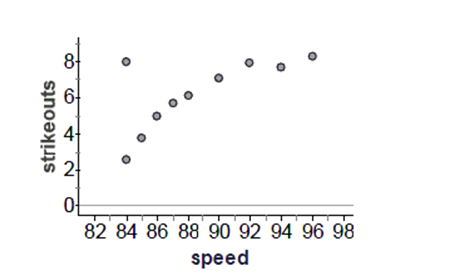
-Do you think the association would be stronger or weaker if we used data from one month of the season?
-Do you think the association would be stronger or weaker if we used data from one month of the season?
سؤال
If you have a puppy who you are feeding Hill's Science Diet® original puppy food, the feeding guidelines for puppies who are 10 to 12 months old are as follows (Source: Hill's feeding guidelines):
A scatterplot of the data is: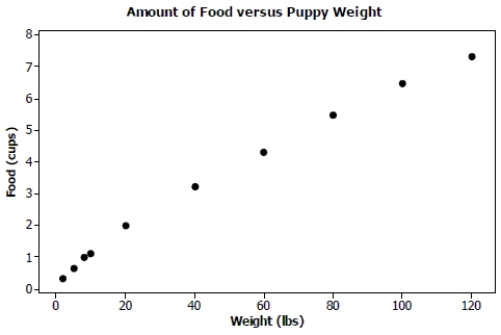
Does it seem reasonable to perform a linear regression to predict amount of food from the puppy's weight based on this data set? Explain.
A scatterplot of the data is:
Does it seem reasonable to perform a linear regression to predict amount of food from the puppy's weight based on this data set? Explain.
سؤال
سؤال
سؤال
سؤال
A study examined the number of trees in a variety of orange groves and the corresponding number of oranges that each grove produces in a given harvest year. Linear regression was calculated and the results are below.
linear regression results:
Dependent Variable: oranges
Independent Variable: trees
Sample size: 9
R-sq = 0.886 s = 31394.7
-Interpret s in context.
linear regression results:
Dependent Variable: oranges
Independent Variable: trees
Sample size: 9
R-sq = 0.886 s = 31394.7
-Interpret s in context.
سؤال
An article in the Journal of Statistics Education reported the price of diamonds of different sizes in Singapore dollars (SGD). The following table contains a data set that is consistent with this data, adjusted to US dollars in 2004:
-Create a model to predict diamond costs from the size of the diamond.
-Create a model to predict diamond costs from the size of the diamond.
سؤال
A study examined the number of trees in a variety of orange groves and the corresponding number of oranges that each
grove produces in a given harvest year. Linear regression was calculated and the results are below.
linear regression results:
Dependent Variable: oranges
Independent Variable: trees
Sample size: 9
R-sq = 0.886
s = 31394.7
-
Since is not 100%, there must be other factors in influencing the number of oranges harvested. What percentage is that and what is another factor you think might be involved?
سؤال
سؤال
An article in the Journal of Statistics Education reported the price of diamonds of different sizes in Singapore dollars
(SGD). The following table contains a data set that is consistent with this data, adjusted to US dollars in 2004:
-Interpret the intercept of your model in context.
(SGD). The following table contains a data set that is consistent with this data, adjusted to US dollars in 2004:
-Interpret the intercept of your model in context.
سؤال
Baseball coaches use a radar gun to measure the speed of pitcher’s fastball. They also record outcomes such as hits and strikeouts. The scatterplot below shows the relationship between the average speed of a fastball and the average number of strikeouts per nine innings for each pitcher on the Bulldogs, based on the past season.
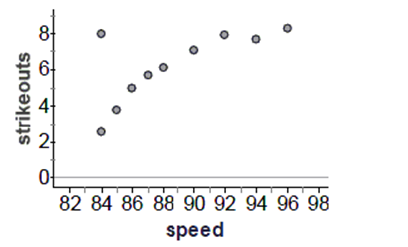
-Do you think there is a pattern? Describe the association between speed and the number of strikeouts.
-Do you think there is a pattern? Describe the association between speed and the number of strikeouts.
سؤال
Time Wasted A group of students decide to see if there is link between wasting time on the internet and GPA. They don't expect to find an extremely strong association, but they're hoping for at least a weak relationship. Here are the findings.
a. How strong is the relationship the students found? Describe in context with statistical justification.
One student is concerned that the relationship is so weak, there may not actually be any relationship at all. To test this concern, he runs a simulation where the 10 GPA's are randomly matched with the 10 hours/week. After each random assignment, the correlation is calculated. This process is repeated 100 times. Here is a histogram of the 100 correlations. The correlation coefficient of -0.371 is indicated with a vertical line.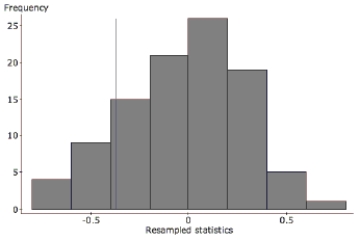
b. Do the results of this simulation confirm the suspicion that there may not be any relationship? Refer specifically to the graph in your explanation.
سؤال
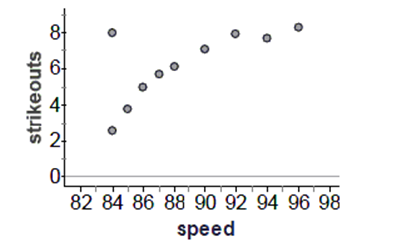
Baseball coaches use a radar gun to measure the speed of pitcher’s fastball. They also record outcomes such as hits and strikeouts. The scatterplot below shows the relationship between the average speed of a fastball and the average number of strikeouts per nine innings for each pitcher on the Bulldogs, based on the past season.
-Comment on any unusual data point or points in the data set. Explain.
-Comment on any unusual data point or points in the data set. Explain.
سؤال
The bigger the stop sign, the more expensive it is. Here is a graph of the height of a sign in inches versus its cost in dollars.
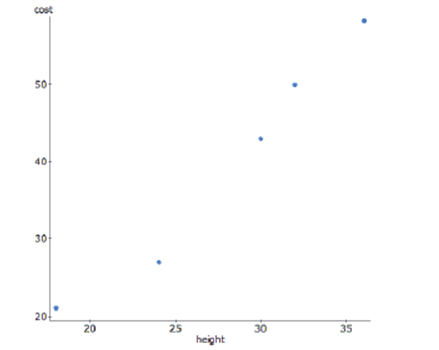
-Describe why performing linear regression with these data is not a good decision.
-Describe why performing linear regression with these data is not a good decision.
سؤال
Baseball coaches use a radar gun to measure the speed of pitcher’s fastball. They also record outcomes such as hits and strikeouts. The scatterplot below shows the relationship between the average speed of a fastball and the average number of strikeouts per nine innings for each pitcher on the Bulldogs, based on the past season.
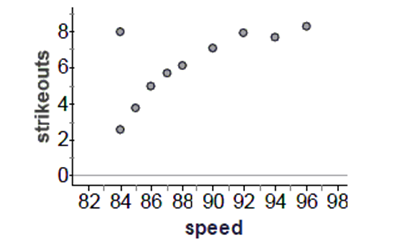
-Do you think a model based on these data could accurately predict the average number of strikeouts for a pitcher with an average fastball speed of 70 mph.? Explain.
-Do you think a model based on these data could accurately predict the average number of strikeouts for a pitcher with an average fastball speed of 70 mph.? Explain.
سؤال
An article in the Journal of Statistics Education reported the price of diamonds of different sizes in Singapore dollars
(SGD). The following table contains a data set that is consistent with this data, adjusted to US dollars in 2004:
-Do you think a linear model is appropriate here? Explain.
(SGD). The following table contains a data set that is consistent with this data, adjusted to US dollars in 2004:
-Do you think a linear model is appropriate here? Explain.
سؤال
Crawling Researchers at the University of Denver Infant Study Center investigated whether babies take longer to learn to crawl in cold months (when they are often bundled in clothes that restrict their movement) than in warmer months. The study sought an association between babies' first crawling age (in weeks) and the average temperature during the month they first try to crawl (about 6 months after birth). Between 1988 and
1991 parents reported the birth month and age at which their child was first able to creep
or crawl a distance of four feet in one minute. Data were collected on 208 boys and 206 girls. The graph below plots average crawling ages (in weeks) against the mean temperatures when the babies were 6 months old. The researchers found a correlation of r
= -0.70 and the their line of best fit was
= 36 - 0.08AvTemp.
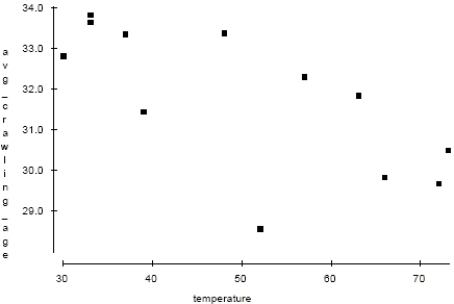
a. Draw the line of best fit on the graph. (Show your method clearly.)
b. Describe the association in context.
c. Explain (in context) what the slope of the line means.
d. Explain (in context) what the y-intercept of the line means. e. Explain (in context) what means.
f. In this context, what does a negative residual indicate?
1991 parents reported the birth month and age at which their child was first able to creep
or crawl a distance of four feet in one minute. Data were collected on 208 boys and 206 girls. The graph below plots average crawling ages (in weeks) against the mean temperatures when the babies were 6 months old. The researchers found a correlation of r
= -0.70 and the their line of best fit was
= 36 - 0.08AvTemp.
a. Draw the line of best fit on the graph. (Show your method clearly.)
b. Describe the association in context.
c. Explain (in context) what the slope of the line means.
d. Explain (in context) what the y-intercept of the line means. e. Explain (in context) what means.
f. In this context, what does a negative residual indicate?
سؤال
سؤال
سؤال
Current research states that a good diet should contain 20-35 grams of dietary fiber. Research also states that each day should start with a healthy breakfast. The nutritional information for 77 breakfast cereals was reviewed to find the grams of fiber and the number of calories per serving. The scatterplot below shows the relationship between fiber and calories for the cereals.
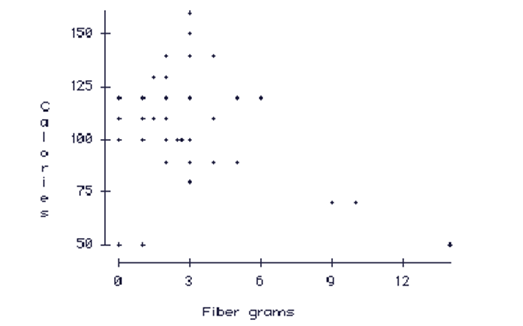
-Do you think a model could accurately predict the number of calories in a serving of cereal that has 22 grams of fiber? Explain.
-Do you think a model could accurately predict the number of calories in a serving of cereal that has 22 grams of fiber? Explain.
سؤال
A study examined the number of trees in a variety of orange groves and the corresponding number of oranges that each grove produces in a given harvest year. Linear regression was calculated and the results are below.
linear regression results:
Dependent Variable: oranges
Independent Variable: trees
Sample size: 9
R-sq = 0.886 s = 31394.7
-Does the value of s concern you? How might you deal with this data differently to address this problem?
linear regression results:
Dependent Variable: oranges
Independent Variable: trees
Sample size: 9
R-sq = 0.886 s = 31394.7
-Does the value of s concern you? How might you deal with this data differently to address this problem?
سؤال
سؤال
An article in the Journal of Statistics Education reported the price of diamonds of different sizes in Singapore dollars
(SGD). The following table contains a data set that is consistent with this data, adjusted to US dollars in 2004:
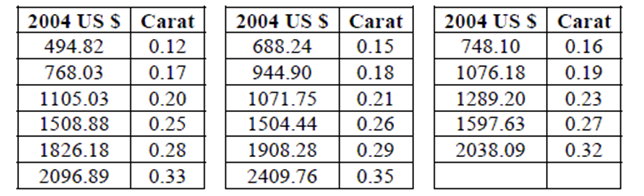
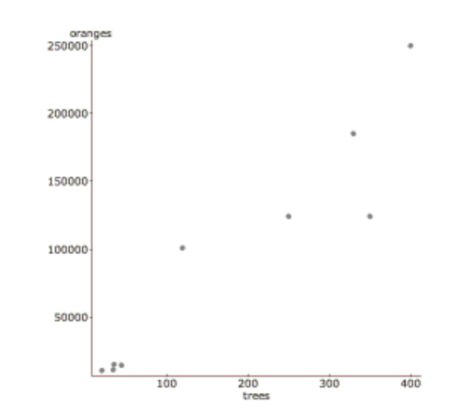
-Make a scatterplot and describe the association between the size of the diamond (carat) and the cost (in US dollars).
(SGD). The following table contains a data set that is consistent with this data, adjusted to US dollars in 2004:
-Make a scatterplot and describe the association between the size of the diamond (carat) and the cost (in US dollars).

فتح الحزمة
قم بالتسجيل لفتح البطاقات في هذه المجموعة!
Unlock Deck
Unlock Deck
1/150
العب
ملء الشاشة (f)
Deck 2: Data
1
All but one of the statements below contain a mistake. Which one could be true?
A) There is a strong correlation between type of preferred pet and income level.
B) The correlation between the height of a bean plant and the day is 0.78 in/day.
C) The correlation between your golf score and the number of hours you practice is -0.36.
D) The correlation between the time it takes to get ready in the morning and gender is 0.78.
E) The number of apricots on a tree and the amount of fertilizer have a 1.12 correlation.
C
2
A correlation of zero between two quantitative variables means that
A) re-expressing the data will guarantee a linear association between the two variables.
B) we have done something wrong in our calculation of r.
C) there is no linear association between the two variables.
D) none of these
E) there is no association between the two variables.
A) re-expressing the data will guarantee a linear association between the two variables.
B) we have done something wrong in our calculation of r.
C) there is no linear association between the two variables.
D) none of these
E) there is no association between the two variables.
C
3
It takes a while for new factory workers to master a complex assembly process. During the first month new employees work, the company tracks the number of days they have been on the job and the length of time it takes them to complete an assembly. The correlation is most likely to be
A) near 0
B) exactly -1.0
C) exactly +1.0
D) near -0.6
E) near +0.6
A) near 0
B) exactly -1.0
C) exactly +1.0
D) near -0.6
E) near +0.6
D
4
All but one of the statements below contain a mistake. Which one could be true?
A) The correlation between a person's age and vision (20/20?) is r = -1.04.
B) The correlation between blood alcohol level and reaction time is r = 0.73.
C) There is a high correlation between cigarette smoking and gender.
D) The correlation between the species of tree and its height is r = 0.56.
E) The correlation between age and weight of a newborn baby is r = 0.83 ounces per day.
فتح الحزمة
افتح القفل للوصول البطاقات البالغ عددها 150 في هذه المجموعة.
فتح الحزمة
k this deck
5
Researchers studying growth patterns of children collect data on the heights of fathers and sons.
The correlation between the fathers' heights and the heights of their 16 year-old sons is most likely to be...
A) near +0.7
B) near -1.0
C) exactly +1.0
D) somewhat greater than 1.0
E) near 0
The correlation between the fathers' heights and the heights of their 16 year-old sons is most likely to be...
A) near +0.7
B) near -1.0
C) exactly +1.0
D) somewhat greater than 1.0
E) near 0
فتح الحزمة
افتح القفل للوصول البطاقات البالغ عددها 150 في هذه المجموعة.
فتح الحزمة
k this deck
6
All but one of these statements contain a mistake. Which could be true?
A) The correlation between a football player's weight and the position he plays is 0.54.
B) There is a correlation of 0.63 between gender and political party.
C) There is a high correlation (1.09) between height of a corn stalk and its age in weeks.
D) The correlation between a car's length and its fuel efficiency is 0.71 miles per gallon.
E) The correlation between the amount of fertilizer used and the yield of beans is 0.42.
فتح الحزمة
افتح القفل للوصول البطاقات البالغ عددها 150 في هذه المجموعة.
فتح الحزمة
k this deck
7
A business owner notes that for every extra hour his store is open, his total sales increase by a fixed amount. His most useful predictive model is probably……
A) exponential
B) power
C) quadratic
D) logarithmic
E) linear
A) exponential
B) power
C) quadratic
D) logarithmic
E) linear
فتح الحزمة
افتح القفل للوصول البطاقات البالغ عددها 150 في هذه المجموعة.
فتح الحزمة
k this deck
8
Which of the following is not a source of caution in regression analysis between two variables?
A) an outlier.
B) All of these are potential problems.
C) subgroups with different characteristics.
D) extrapolation.
E) a lurking variable.
A) an outlier.
B) All of these are potential problems.
C) subgroups with different characteristics.
D) extrapolation.
E) a lurking variable.
فتح الحزمة
افتح القفل للوصول البطاقات البالغ عددها 150 في هذه المجموعة.
فتح الحزمة
k this deck
9
Two variables that are actually not related to each other may nonetheless have a very high correlation because they both result from some other, possibly hidden, factor. This is an example of
A) a lurking variable.
B) leverage.
C) an outlier.
D) regression.
E) extrapolation.
A) a lurking variable.
B) leverage.
C) an outlier.
D) regression.
E) extrapolation.
فتح الحزمة
افتح القفل للوصول البطاقات البالغ عددها 150 في هذه المجموعة.
فتح الحزمة
k this deck
10
A residual plot that has no pattern is a sign that……
A) the original data is straight and the regression line is a good model.
B) the original data is straight and the regression line is not a good model.
C) the model is not a good one, because there is no pattern.
D) the original data is curved and the regression line is a good model.
E) the original data is curved and the regression line is not a good model.
فتح الحزمة
افتح القفل للوصول البطاقات البالغ عددها 150 في هذه المجموعة.
فتح الحزمة
k this deck
11
The auto insurance industry crashed some test vehicles into a cement barrier at speeds of 5 to 25 mph to investigate the amount of damage to the cars. They found a correlation of r = 0.60 between speed (MPH) and damage ($). If the speed at which a car hit the barrier is 1.5 standard deviations above the mean speed, we expect the damage to be_______ the mean damage.
A) 0.36 SD above
B) equal to
C) 0.90 SD above
D) 1.5 SD above
E) 0.60 SD above
A) 0.36 SD above
B) equal to
C) 0.90 SD above
D) 1.5 SD above
E) 0.60 SD above
فتح الحزمة
افتح القفل للوصول البطاقات البالغ عددها 150 في هذه المجموعة.
فتح الحزمة
k this deck
12
An 8th grade class develops a linear model that predicts the number of cheerios (a small round cereal) that fit on the circumference of a plate by using the diameter in inches. Their model is cheerios = 0.56 + 5.11(diameter).
-The slope of this model is best interpreted in context as……
A) For every 5.11 inches of diameter, the circumference is about 1 cheerio bigger.
B) It takes 5.11 cheerios to fill a plate's circumference.
C) For every 1 inch of diameter, the circumference holds about 0.56 more cheerios.
D) A mistake, because n is about 3.14 and that should be the slope.
E) For every 1 inch of diameter, the circumference holds about 5.11 more cheerios.
فتح الحزمة
افتح القفل للوصول البطاقات البالغ عددها 150 في هذه المجموعة.
فتح الحزمة
k this deck
13
Another farmer has increased his wheat production by about the same percentage each year. His most useful predictive model is probably…
A) exponential
B) linear
C) quadratic
D) power
E) logarithmic
A) exponential
B) linear
C) quadratic
D) power
E) logarithmic
فتح الحزمة
افتح القفل للوصول البطاقات البالغ عددها 150 في هذه المجموعة.
فتح الحزمة
k this deck
14
If a data point is influential it……
A) is guaranteed to be extreme in the horizontal direction.
B) none of these
C) is guaranteed to be extreme in the vertical direction.
D) has a small residual.
E) will change the slope of the regression equation.
A) is guaranteed to be extreme in the horizontal direction.
B) none of these
C) is guaranteed to be extreme in the vertical direction.
D) has a small residual.
E) will change the slope of the regression equation.
فتح الحزمة
افتح القفل للوصول البطاقات البالغ عددها 150 في هذه المجموعة.
فتح الحزمة
k this deck
15
If the point in the upper right corner of this scatterplot is removed from the data set, then what will happen to the slope of the line of best fit (b) and to the correlation (r)?
A) both will decrease.
B) both will remain the same.
C) both will increase.
D) b will decrease, and r will increase.
E) b will increase, and r will decrease.
A) both will decrease.
B) both will remain the same.
C) both will increase.
D) b will decrease, and r will increase.
E) b will increase, and r will decrease.
فتح الحزمة
افتح القفل للوصول البطاقات البالغ عددها 150 في هذه المجموعة.
فتح الحزمة
k this deck
16
A consumer group collected information on HDTVs. They created a linear model to estimate the cost of an HDTV (in $) based on the screen size (in inches). Which is the most likely value of the slope of the line of best fit?
A) 7
B) 0.70
C) 700
D) 7000
E) 70
A) 7
B) 0.70
C) 700
D) 7000
E) 70
فتح الحزمة
افتح القفل للوصول البطاقات البالغ عددها 150 في هذه المجموعة.
فتح الحزمة
k this deck
17
The residuals plot for a linear model is shown. Which is true?
A) The linear model is no good because of the curve in the residuals.
B) The linear model is okay because approximately the same number of points are above the line as below it.
C) The linear model is no good because some residuals are large.
D) The linear model is no good because the correlation is near 0.
E) The linear model is okay because the association between the two variables is fairly strong.
فتح الحزمة
افتح القفل للوصول البطاقات البالغ عددها 150 في هذه المجموعة.
فتح الحزمة
k this deck
18
R-sq is a measure of ……
A) the percentage of the accuracy of the regression equation.
B) the proportion of the variability in the response variable that is explained by the explanatory variable.
C) the initial predicted starting point of the response variable when x is zero.
D) the probability that the regression line makes a correct prediction.
E) the change in the y-variable that corresponds with the change in the x-variable.
فتح الحزمة
افتح القفل للوصول البطاقات البالغ عددها 150 في هذه المجموعة.
فتح الحزمة
k this deck
19
The correlation between X and Y is r = 0.35. If we double each X value, decrease each Y by 0.20, and interchange the variables (put X on the Y-axis and vice versa), the new correlation
A) is 0.50
B) is 0.90
C) is 0.35
D) is 0.70
E) cannot be determined.
A) is 0.50
B) is 0.90
C) is 0.35
D) is 0.70
E) cannot be determined.
فتح الحزمة
افتح القفل للوصول البطاقات البالغ عددها 150 في هذه المجموعة.
فتح الحزمة
k this deck
20
When using midterm exam scores to predict a student's final grade in a class, the student would prefer to have a
A) residual equal to zero, because that means the student's final grade is exactly what we would predict with the model.
B) negative residual, because that means the student's final grade is lower than we would predict with the model.
C) negative residual, because that means the student's final grade is higher than we would predict with the model.
D) positive residual, because that means the student's final grade is higher than we would predict with the model.
E) positive residual, because that means the student's final grade is lower than we would predict with the model.
فتح الحزمة
افتح القفل للوصول البطاقات البالغ عددها 150 في هذه المجموعة.
فتح الحزمة
k this deck
21
Suppose we collect data hoping to be able to estimate the prices of commonly owned new cars (in
$) from their lengths (in feet). Of these possibilities, the slope of the line of best fit is most likely to
Be
A) 3000
B) 30,000
C) 3
D) 300
E) 30
$) from their lengths (in feet). Of these possibilities, the slope of the line of best fit is most likely to
Be
A) 3000
B) 30,000
C) 3
D) 300
E) 30
فتح الحزمة
افتح القفل للوصول البطاقات البالغ عددها 150 في هذه المجموعة.
فتح الحزمة
k this deck
22
A lakeside restaurant found the correlation between the daily temperature and the number of meals they served to be 0.40. On a day when the temperature is two standard deviations above the mean, the number of meals they should plan on serving is __________the mean.
A) 0.4 SD above
B) 2.0 SD above
C) 0.16 SD above
D) 0.8 SD above
E) equal to
A) 0.4 SD above
B) 2.0 SD above
C) 0.16 SD above
D) 0.8 SD above
E) equal to
فتح الحزمة
افتح القفل للوصول البطاقات البالغ عددها 150 في هذه المجموعة.
فتح الحزمة
k this deck
23
The relationship between the longevity of an animal's life and its gestation time is 0.70. If an animal is one standard deviation below average in life expectancy, the gestation time is predicted to _____below average.
A) 1 SD
B) none of these
C) 1.4 SD
D) 0.7 SD
E) 0.49 SD
A) 1 SD
B) none of these
C) 1.4 SD
D) 0.7 SD
E) 0.49 SD
فتح الحزمة
افتح القفل للوصول البطاقات البالغ عددها 150 في هذه المجموعة.
فتح الحزمة
k this deck
24
A regression model examining the amount of distance a long distance runner runs (in miles) to predict the amount of fluid the runner drinks (ounces) has a slope of 4.6. Which interpretation is appropriate?
A) Each mile adds 4.6 more ounces.
B) We predict 4.6 miles for every ounce that is drunk.
C) We predict for every mile run, the runner drinks 4.6 more ounces.
D) The correlation is needed to interpret this value.
E) A runner drinks a minimum of 4.6 oz.
A) Each mile adds 4.6 more ounces.
B) We predict 4.6 miles for every ounce that is drunk.
C) We predict for every mile run, the runner drinks 4.6 more ounces.
D) The correlation is needed to interpret this value.
E) A runner drinks a minimum of 4.6 oz.
فتح الحزمة
افتح القفل للوصول البطاقات البالغ عددها 150 في هذه المجموعة.
فتح الحزمة
k this deck
25
Which scatterplot shows a strong association between two variables even though the correlation is probably near zero?
A)
B)
C)
D)
E)
A)
B)
C)
D)
E)
فتح الحزمة
افتح القفل للوصول البطاقات البالغ عددها 150 في هذه المجموعة.
فتح الحزمة
k this deck
26
Over the past decade a farmer has been able to increase his wheat production by about the same number of bushels each year. His most useful predictive model is probably…
A) exponential
B) linear
C) power
D) quadratic
E) logarithmic
A) exponential
B) linear
C) power
D) quadratic
E) logarithmic
فتح الحزمة
افتح القفل للوصول البطاقات البالغ عددها 150 في هذه المجموعة.
فتح الحزمة
k this deck
27
All but one of the statements below contain a mistake. Which one could be true?
A) The correlation between gender and age is -0.171.
B) The correlation between weight and length of foot is 0.488.
C) The correlation between the breed of a dog and its weight is 0.435.
D) The correlation between height and weight is 0.568 inches per pound.
E) If the correlation between blood alcohol level and reaction time is 0.73, then the correlation between reaction time and blood alcohol level is -0.73.
فتح الحزمة
افتح القفل للوصول البطاقات البالغ عددها 150 في هذه المجموعة.
فتح الحزمة
k this deck
28
A regression equation is found that predicts the increased cost of a home owner's electricity bill Given the number of holiday lights they put on the outside of their house. The equation is dollars =2.5 + 0.02(light) . If a house has 400 lights and a $15 increase in their electricity cost, find their residual.
A) $20
B) $5
C) -$15
D) $15
E) -$5
A) $20
B) $5
C) -$15
D) $15
E) -$5
فتح الحزمة
افتح القفل للوصول البطاقات البالغ عددها 150 في هذه المجموعة.
فتح الحزمة
k this deck
29
An 8th grade class develops a linear model that predicts the number of cheerios (a small round cereal) that fit on the
circumference of a plate by using the diameter in inches. Their model is = 0.56 + 5.11(diameter).
-If the diameter is increased from 4 inches to 14 inches, the predicted number of cheerios will Increase by about……
A) 21
B) 72
C) none of these
D) 51
E) 10
circumference of a plate by using the diameter in inches. Their model is = 0.56 + 5.11(diameter).
-If the diameter is increased from 4 inches to 14 inches, the predicted number of cheerios will Increase by about……
A) 21
B) 72
C) none of these
D) 51
E) 10
فتح الحزمة
افتح القفل للوصول البطاقات البالغ عددها 150 في هذه المجموعة.
فتح الحزمة
k this deck
30
The price of first class stamp has followed inflation over time and has increased at a constant percentage over time. The most useful predictive model is probably……
A) quadratic
B) exponential
C) linear
D) power
E) logarithmic
A) quadratic
B) exponential
C) linear
D) power
E) logarithmic
فتح الحزمة
افتح القفل للوصول البطاقات البالغ عددها 150 في هذه المجموعة.
فتح الحزمة
k this deck
31
The relationship between the number of hours a person practices a task and the time it takes them to complete the task is calculated to have R-sq = 56.7%. The value of the correlation coefficient is
A) 0.753
B) -0.238
C) 0.238
D) -0.753
E) 2.38
A) 0.753
B) -0.238
C) 0.238
D) -0.753
E) 2.38
فتح الحزمة
افتح القفل للوصول البطاقات البالغ عددها 150 في هذه المجموعة.
فتح الحزمة
k this deck
32
This regression analysis examines the relationship between the number of years of formal education a person has and their annual income. According to this model, about how much more money do people who finish a 4-year college program earn each year, on average, than those with only a 2-year degree?
Dependent variable is Income
-squared
with 57 degrees of freedom
A) $2710
B) $2006
C) $9321
D) $5337
E) $7968
Dependent variable is Income
-squared
with 57 degrees of freedom
A) $2710
B) $2006
C) $9321
D) $5337
E) $7968
فتح الحزمة
افتح القفل للوصول البطاقات البالغ عددها 150 في هذه المجموعة.
فتح الحزمة
k this deck
33
Residuals are...
A) possible models not explored by the researcher.
B) variation in the data that is explained by the model.
C) data collected from individuals that is not consistent with the rest of the group.
D) none of these
E) the difference between observed responses and values predicted by the model.
A) possible models not explored by the researcher.
B) variation in the data that is explained by the model.
C) data collected from individuals that is not consistent with the rest of the group.
D) none of these
E) the difference between observed responses and values predicted by the model.
فتح الحزمة
افتح القفل للوصول البطاقات البالغ عددها 150 في هذه المجموعة.
فتح الحزمة
k this deck
34
Another company's sales increase by the same percent each year. This growth is...
A) quadratic
B) linear
C) power
D) exponential
E) logarithmic
A) quadratic
B) linear
C) power
D) exponential
E) logarithmic
فتح الحزمة
افتح القفل للوصول البطاقات البالغ عددها 150 في هذه المجموعة.
فتح الحزمة
k this deck
35
A researcher studied the relationship between family income and amount of money spent on an automobile. She calculated that = 45%. Which is the correct interpretation?
A) None of these
B) 45% of the price of the car can be predicted by using income.
C) The probability of predicting the correct price of a car is 45%.
D) 45% of the variability in car price can be explained by using income.
E) The car price fluctuates 45% more than income.
A) None of these
B) 45% of the price of the car can be predicted by using income.
C) The probability of predicting the correct price of a car is 45%.
D) 45% of the variability in car price can be explained by using income.
E) The car price fluctuates 45% more than income.
فتح الحزمة
افتح القفل للوصول البطاقات البالغ عددها 150 في هذه المجموعة.
فتح الحزمة
k this deck
36
A least squares line of regression has been fitted to a scatterplot; the model's residuals plot is shown. Which is true?
A) The linear model is poor because the correlation is near 0.
B) None of these.
C) The linear model is appropriate.
D) The linear model is poor because some residuals are large.
E) A curved model would be better.
A) The linear model is poor because the correlation is near 0.
B) None of these.
C) The linear model is appropriate.
D) The linear model is poor because some residuals are large.
E) A curved model would be better.
فتح الحزمة
افتح القفل للوصول البطاقات البالغ عددها 150 في هذه المجموعة.
فتح الحزمة
k this deck
37
A company's sales increase by the same amount each year. This growth is...
A) linear
B) power
C) logarithmic
D) exponential
E) quadratic
A) linear
B) power
C) logarithmic
D) exponential
E) quadratic
فتح الحزمة
افتح القفل للوصول البطاقات البالغ عددها 150 في هذه المجموعة.
فتح الحزمة
k this deck
38
If a data set has a relationship that is best described by a linear model, than the residual plot will
A) have no pattern with a correlation near 0.
B) also have a linear pattern with a similar correlation.
C) have a curved pattern, like a parabola.
D) be an unknown shape.
E) none of these
A) have no pattern with a correlation near 0.
B) also have a linear pattern with a similar correlation.
C) have a curved pattern, like a parabola.
D) be an unknown shape.
E) none of these
فتح الحزمة
افتح القفل للوصول البطاقات البالغ عددها 150 في هذه المجموعة.
فتح الحزمة
k this deck
39
Which of the following is not a goal of re-expressing data?
A) Make the form of a scatterplot more nearly linear.
B) Make the distribution of a variable more symmetric.
C) Make the scatter in a scatterplot spread out evenly rather than following a fan shape.
D) All of these are goals of re-expressing data.
E) Make the spread of several groups more alike.
A) Make the form of a scatterplot more nearly linear.
B) Make the distribution of a variable more symmetric.
C) Make the scatter in a scatterplot spread out evenly rather than following a fan shape.
D) All of these are goals of re-expressing data.
E) Make the spread of several groups more alike.
فتح الحزمة
افتح القفل للوصول البطاقات البالغ عددها 150 في هذه المجموعة.
فتح الحزمة
k this deck
40
Computer output in the scenario described in problem #8 reports that s = 2.3. Which is the correct interpretation of this value?
A) The slope of the regression line is $2.30 per light.
B) The initial cost, even with no lights is $2.30.
C) The slope of the regression line is 2.3 lights per dollar.
D) The average prediction error of the regression line is $2.30.
E) The correlation is 2.3.
A) The slope of the regression line is $2.30 per light.
B) The initial cost, even with no lights is $2.30.
C) The slope of the regression line is 2.3 lights per dollar.
D) The average prediction error of the regression line is $2.30.
E) The correlation is 2.3.
فتح الحزمة
افتح القفل للوصول البطاقات البالغ عددها 150 في هذه المجموعة.
فتح الحزمة
k this deck
41
Penicillin assimilation Doctors studying how the human body assimilates medication inject a patient with penicillin, and then monitor the concentration of the drug in the patient's blood for several hours. The data are shown in the table.
a. Straighten the scatterplot by re-expressing these data and create an appropriate model for predicting the concentration of penicillin.
b. Use your model to estimate what the concentration of penicillin will be after 8 hours.
a. Straighten the scatterplot by re-expressing these data and create an appropriate model for predicting the concentration of penicillin.
b. Use your model to estimate what the concentration of penicillin will be after 8 hours.
فتح الحزمة
افتح القفل للوصول البطاقات البالغ عددها 150 في هذه المجموعة.
فتح الحزمة
k this deck
42
During a science lab, students heated water, allowed it to cool, and recorded the temperature over time. They computed the difference between the water temperature and the room temperature. The results are in the table.
-Newton's Law of Cooling suggests an exponential function is appropriate. Re-express the data using logarithms and sketch a new scatterplot.
-Newton's Law of Cooling suggests an exponential function is appropriate. Re-express the data using logarithms and sketch a new scatterplot.
فتح الحزمة
افتح القفل للوصول البطاقات البالغ عددها 150 في هذه المجموعة.
فتح الحزمة
k this deck
43
After conducting a marketing study to see what consumers thought about a new tinted contact lens they were developing, an eyewear company reported, "Consumer satisfaction is strongly correlated with eye color." Comment on this observation.
فتح الحزمة
افتح القفل للوصول البطاقات البالغ عددها 150 في هذه المجموعة.
فتح الحزمة
k this deck
44
An article in the Journal of Statistics Education reported the price of diamonds of different sizes in Singapore dollars
(SGD). The following table contains a data set that is consistent with this data, adjusted to US dollars in 2004:
-Would it be better for a customer buying a diamond to have a negative residual or a positive residual from this model? Explain.
(SGD). The following table contains a data set that is consistent with this data, adjusted to US dollars in 2004:
-Would it be better for a customer buying a diamond to have a negative residual or a positive residual from this model? Explain.
فتح الحزمة
افتح القفل للوصول البطاقات البالغ عددها 150 في هذه المجموعة.
فتح الحزمة
k this deck
45
A scatterplot of log(Y) vs. log(X) reveals a linear pattern with very little scatter. It is probably true that…
A) the correlation between X and Y is near +1.
B) the residuals plot for regression of Y on X shows a curved pattern.
C) the calculator's LnReg function will model the association between X and Y.
D) the correlation between X and Y is near 0.
E) the scatterplot of Y vs X shows a linear association.
A) the correlation between X and Y is near +1.
B) the residuals plot for regression of Y on X shows a curved pattern.
C) the calculator's LnReg function will model the association between X and Y.
D) the correlation between X and Y is near 0.
E) the scatterplot of Y vs X shows a linear association.
فتح الحزمة
افتح القفل للوصول البطاقات البالغ عددها 150 في هذه المجموعة.
فتح الحزمة
k this deck
46
Using the equation in number #8 again, if a homeowner doubles the number of lights he uses from 500 to 1000, how much do we predict he will increase his electric bill by?
A) $12.50
B) $10
C) $22.50
D) $2
E) $35
A) $12.50
B) $10
C) $22.50
D) $2
E) $35
فتح الحزمة
افتح القفل للوصول البطاقات البالغ عددها 150 في هذه المجموعة.
فتح الحزمة
k this deck
47
Breaking strength A company manufactures polypropylene rope in six different sizes. To assess the strength of the ropes they test two samples of each size to see how much force (in kilograms) the ropes will hold without breaking. The table shows the results of the tests. We want to create a model for predicting the breaking strength from the diameter of the rope.
a. Find a model that uses re-expressed data to straighten the scatterplot.
b. The company is thinking of introducing a new 25mm rope. How strong should it be?
(Write a sentence in context based on one of your models.)
a. Find a model that uses re-expressed data to straighten the scatterplot.
b. The company is thinking of introducing a new 25mm rope. How strong should it be?
(Write a sentence in context based on one of your models.)
فتح الحزمة
افتح القفل للوصول البطاقات البالغ عددها 150 في هذه المجموعة.
فتح الحزمة
k this deck
48
Maple trees A forester would like to know how big a maple tree might be at age 50 years.
She gathers data from some trees that have been cut down, and plots the diameters (in
inches) of the trees against their ages (in years). First she makes a linear model. The scatterplot and residuals plot are shown.
a. Describe the association shown in the scatterplot.
b. Do you think the linear model is appropriate? Explain.
c. If she uses this model to try to predict the diameter of a 50-year old maple tree, would you expect that estimate to be fairly accurate, too low, or too high? Explain.
Now she re-expresses the data, using the logarithm of age to try to predict the diameter of the tree. Here are the regression analysis and the residuals plot.
d. Explain why you think this is a better model.
e. Using this model, predict the diameter of a maple tree at age 50 years.
فتح الحزمة
افتح القفل للوصول البطاقات البالغ عددها 150 في هذه المجموعة.
فتح الحزمة
k this deck
49
A silly psychology student gathers data on the shoe size of 30 of his classmates and their GPA's.
The correlation coefficient between these two variables is most likely to be
A) near 0
B) exactly +1.0
C) near -0.6
D) exactly -1.0
E) near +0.6
The correlation coefficient between these two variables is most likely to be
A) near 0
B) exactly +1.0
C) near -0.6
D) exactly -1.0
E) near +0.6
فتح الحزمة
افتح القفل للوصول البطاقات البالغ عددها 150 في هذه المجموعة.
فتح الحزمة
k this deck
50
High Score The longer you play a video game, the higher score you can usually achieve.
An analysis of a popular game found the following relationship between the hours a
player has played a game and their corresponding high score on that game.
Dependent variable is High Score
with 89 degrees of freedom
a. Write the regression equation and define the variables of your equation in context.
b. Interpret the slope in context.
c. Interpret the y-intercept in context.
d. Interpret s in context.
e. What is the correlation coefficient? Interpret this value in context.
فتح الحزمة
افتح القفل للوصول البطاقات البالغ عددها 150 في هذه المجموعة.
فتح الحزمة
k this deck
51
A study examined the number of trees in a variety of orange groves and the corresponding number of oranges that each grove produces in a given harvest year. Linear regression was calculated and the results are below.
linear regression results:
Dependent Variable:
oranges
Independent Variable: trees
Sample size: 9
R-sq = 0.886 s = 31394.7
-Write the regression equation. Define all variables used in your equation.
linear regression results:
Dependent Variable:
oranges
Independent Variable: trees
Sample size: 9
R-sq = 0.886 s = 31394.7
-Write the regression equation. Define all variables used in your equation.
فتح الحزمة
افتح القفل للوصول البطاقات البالغ عددها 150 في هذه المجموعة.
فتح الحزمة
k this deck
52
The following is a scatterplot of the average final exam score versus midterm score for 11 sections of an introductory statistics class:
The correlation coefficient for these data is r = 0.829. If you had a scatterplot of the final exam score versus midterm score for all individual students in this introductory statistics course, would the correlation coefficient be weaker, stronger, or about the same? Explain.
The correlation coefficient for these data is r = 0.829. If you had a scatterplot of the final exam score versus midterm score for all individual students in this introductory statistics course, would the correlation coefficient be weaker, stronger, or about the same? Explain.
فتح الحزمة
افتح القفل للوصول البطاقات البالغ عددها 150 في هذه المجموعة.
فتح الحزمة
k this deck
53
During a science lab, students heated water, allowed it to cool, and recorded the temperature over time. They computed the difference between the water temperature and the room temperature. The results are in the table.
-Use the equation to predict the difference in temperature at time 0 minutes. What does this value represent?
-Use the equation to predict the difference in temperature at time 0 minutes. What does this value represent?
فتح الحزمة
افتح القفل للوصول البطاقات البالغ عددها 150 في هذه المجموعة.
فتح الحزمة
k this deck
54
Subaru costs Data collected from internet ads for 1999 Subarus were used to create a model to estimate
the asking price of the car based on the number of miles it had been driven. The model has
=0.47
and equation = 15,327 - 0.11(Miles). The plot of residuals versus the predicted price is
shown.
a. Do you think you could make accurate estimates of Subaru prices with this model? Explain.
b. Interpret the slope of the line.
c. One of the cars in the data set had been driven 42,000 miles. How much was the owner
asking for it? (Show work.)
the asking price of the car based on the number of miles it had been driven. The model has
=0.47
and equation = 15,327 - 0.11(Miles). The plot of residuals versus the predicted price is
shown.
a. Do you think you could make accurate estimates of Subaru prices with this model? Explain.
b. Interpret the slope of the line.
c. One of the cars in the data set had been driven 42,000 miles. How much was the owner
asking for it? (Show work.)
فتح الحزمة
افتح القفل للوصول البطاقات البالغ عددها 150 في هذه المجموعة.
فتح الحزمة
k this deck
55
Identify what is wrong with each of the following statements:
a. The correlation between Olympic gold medal times for the 800m hurdles and year is -0.66 seconds per year.
b. The correlation between Olympic gold medal times for the 100m dash and year is -1.37. c. Since the correlation between Olympic gold medal times for the 800m hurdles and 100m dash is -0.41, the correlation between times for the 100m dash and the 800m hurdles is +0.41.
d. If we were to measure Olympic gold medal times for the 800m hurdles in minutes instead of seconds, the correlation would be -0.66/60 = -0.011.
فتح الحزمة
افتح القفل للوصول البطاقات البالغ عددها 150 في هذه المجموعة.
فتح الحزمة
k this deck
56
If the point in the upper left corner of the scatterplot is removed, what will happen to the correlation (r) and the slope of the line of best fit (b)?
A) r will decrease and b will increase.
B) Both will decrease.
C) r will increase and b will decrease.
D) They will not change.
E) Both will increase.
A) r will decrease and b will increase.
B) Both will decrease.
C) r will increase and b will decrease.
D) They will not change.
E) Both will increase.
فتح الحزمة
افتح القفل للوصول البطاقات البالغ عددها 150 في هذه المجموعة.
فتح الحزمة
k this deck
57
Current research states that a good diet should contain 20-35 grams of dietary fiber. Research also states that each day should start with a healthy breakfast. The nutritional information for 77 breakfast cereals was reviewed to find the grams of fiber and the number of calories per serving. The scatterplot below shows the relationship between fiber and calories for the cereals.
-Do you think there is a clear pattern? Describe the association between fiber and calories.
-Do you think there is a clear pattern? Describe the association between fiber and calories.
فتح الحزمة
افتح القفل للوصول البطاقات البالغ عددها 150 في هذه المجموعة.
فتح الحزمة
k this deck
58
Baseball coaches use a radar gun to measure the speed of pitcher’s fastball. They also record outcomes such as hits and strikeouts. The scatterplot below shows the relationship between the average speed of a fastball and the average number of strikeouts per nine innings for each pitcher on the Bulldogs, based on the past season.
-Do you think the association would be stronger or weaker if we used data from one month of the season?
-Do you think the association would be stronger or weaker if we used data from one month of the season?
فتح الحزمة
افتح القفل للوصول البطاقات البالغ عددها 150 في هذه المجموعة.
فتح الحزمة
k this deck
59
If you have a puppy who you are feeding Hill's Science Diet® original puppy food, the feeding guidelines for puppies who are 10 to 12 months old are as follows (Source: Hill's feeding guidelines):
A scatterplot of the data is:
Does it seem reasonable to perform a linear regression to predict amount of food from the puppy's weight based on this data set? Explain.
A scatterplot of the data is:
Does it seem reasonable to perform a linear regression to predict amount of food from the puppy's weight based on this data set? Explain.
فتح الحزمة
افتح القفل للوصول البطاقات البالغ عددها 150 في هذه المجموعة.
فتح الحزمة
k this deck
60
After conducting a survey at a pet store to see what impact having a pet had on the condition of the yard, a news reporter stated "There appears to be a strong correlation between owning a pet and the condition of the yard." Comment on this observation.
فتح الحزمة
افتح القفل للوصول البطاقات البالغ عددها 150 في هذه المجموعة.
فتح الحزمة
k this deck
61
Car commercials A car dealer investigated the association between the number of TV commercials he ran each week and the number of cars he sold the following weekend. He found the correlation to be r = 0.56. During the time he collected the data he ran an average of 12.4 commercials a week with a standard deviation of 1.8, and sold an average
of 30.5 cars with a standard deviation of 4.2. Next weekend he is planning a sale, hoping to sell 40 cars. Create a linear model to estimate the number of commercials he should run
this week. Write a sentence explaining your recommendation.
of 30.5 cars with a standard deviation of 4.2. Next weekend he is planning a sale, hoping to sell 40 cars. Create a linear model to estimate the number of commercials he should run
this week. Write a sentence explaining your recommendation.
فتح الحزمة
افتح القفل للوصول البطاقات البالغ عددها 150 في هذه المجموعة.
فتح الحزمة
k this deck
62
A school board study found a moderately strong negative association between the number of hours high school seniors worked at part-time jobs after school hours and the students' grade point averages.
a. Explain in this context what "negative association" means.
b. Hoping to improve student performance, the school board passed a resolution urging
parents to limit the number of hours students be allowed to work. Do you agree or disagree with the school board's reasoning? Explain.
a. Explain in this context what "negative association" means.
b. Hoping to improve student performance, the school board passed a resolution urging
parents to limit the number of hours students be allowed to work. Do you agree or disagree with the school board's reasoning? Explain.
فتح الحزمة
افتح القفل للوصول البطاقات البالغ عددها 150 في هذه المجموعة.
فتح الحزمة
k this deck
63
A study examined the number of trees in a variety of orange groves and the corresponding number of oranges that each grove produces in a given harvest year. Linear regression was calculated and the results are below.
linear regression results:
Dependent Variable: oranges
Independent Variable: trees
Sample size: 9
R-sq = 0.886 s = 31394.7
-Interpret s in context.
linear regression results:
Dependent Variable: oranges
Independent Variable: trees
Sample size: 9
R-sq = 0.886 s = 31394.7
-Interpret s in context.
فتح الحزمة
افتح القفل للوصول البطاقات البالغ عددها 150 في هذه المجموعة.
فتح الحزمة
k this deck
64
An article in the Journal of Statistics Education reported the price of diamonds of different sizes in Singapore dollars (SGD). The following table contains a data set that is consistent with this data, adjusted to US dollars in 2004:
-Create a model to predict diamond costs from the size of the diamond.
-Create a model to predict diamond costs from the size of the diamond.
فتح الحزمة
افتح القفل للوصول البطاقات البالغ عددها 150 في هذه المجموعة.
فتح الحزمة
k this deck
65
A study examined the number of trees in a variety of orange groves and the corresponding number of oranges that each
grove produces in a given harvest year. Linear regression was calculated and the results are below.
linear regression results:
Dependent Variable: oranges
Independent Variable: trees
Sample size: 9
R-sq = 0.886
s = 31394.7
-
Since is not 100%, there must be other factors in influencing the number of oranges harvested. What percentage is that and what is another factor you think might be involved?
grove produces in a given harvest year. Linear regression was calculated and the results are below.
linear regression results:
Dependent Variable: oranges
Independent Variable: trees
Sample size: 9
R-sq = 0.886
s = 31394.7
-
Since is not 100%, there must be other factors in influencing the number of oranges harvested. What percentage is that and what is another factor you think might be involved?
فتح الحزمة
افتح القفل للوصول البطاقات البالغ عددها 150 في هذه المجموعة.
فتح الحزمة
k this deck
66
Math and Verbal Suppose the correlation between SAT Verbal scores and Math scores is0.57 and that these scores are normally distributed. If a student's Verbal score places her atthe 90th percentile, at what percentile would you predict her Math score to be? (Show your work.)
فتح الحزمة
افتح القفل للوصول البطاقات البالغ عددها 150 في هذه المجموعة.
فتح الحزمة
k this deck
67
An article in the Journal of Statistics Education reported the price of diamonds of different sizes in Singapore dollars
(SGD). The following table contains a data set that is consistent with this data, adjusted to US dollars in 2004:
-Interpret the intercept of your model in context.
(SGD). The following table contains a data set that is consistent with this data, adjusted to US dollars in 2004:
-Interpret the intercept of your model in context.
فتح الحزمة
افتح القفل للوصول البطاقات البالغ عددها 150 في هذه المجموعة.
فتح الحزمة
k this deck
68
Baseball coaches use a radar gun to measure the speed of pitcher’s fastball. They also record outcomes such as hits and strikeouts. The scatterplot below shows the relationship between the average speed of a fastball and the average number of strikeouts per nine innings for each pitcher on the Bulldogs, based on the past season.
-Do you think there is a pattern? Describe the association between speed and the number of strikeouts.
-Do you think there is a pattern? Describe the association between speed and the number of strikeouts.
فتح الحزمة
افتح القفل للوصول البطاقات البالغ عددها 150 في هذه المجموعة.
فتح الحزمة
k this deck
69
Time Wasted A group of students decide to see if there is link between wasting time on the internet and GPA. They don't expect to find an extremely strong association, but they're hoping for at least a weak relationship. Here are the findings.
a. How strong is the relationship the students found? Describe in context with statistical justification.
One student is concerned that the relationship is so weak, there may not actually be any relationship at all. To test this concern, he runs a simulation where the 10 GPA's are randomly matched with the 10 hours/week. After each random assignment, the correlation is calculated. This process is repeated 100 times. Here is a histogram of the 100 correlations. The correlation coefficient of -0.371 is indicated with a vertical line.
b. Do the results of this simulation confirm the suspicion that there may not be any relationship? Refer specifically to the graph in your explanation.
a. How strong is the relationship the students found? Describe in context with statistical justification.
One student is concerned that the relationship is so weak, there may not actually be any relationship at all. To test this concern, he runs a simulation where the 10 GPA's are randomly matched with the 10 hours/week. After each random assignment, the correlation is calculated. This process is repeated 100 times. Here is a histogram of the 100 correlations. The correlation coefficient of -0.371 is indicated with a vertical line.
b. Do the results of this simulation confirm the suspicion that there may not be any relationship? Refer specifically to the graph in your explanation.
فتح الحزمة
افتح القفل للوصول البطاقات البالغ عددها 150 في هذه المجموعة.
فتح الحزمة
k this deck
70
Baseball coaches use a radar gun to measure the speed of pitcher’s fastball. They also record outcomes such as hits and strikeouts. The scatterplot below shows the relationship between the average speed of a fastball and the average number of strikeouts per nine innings for each pitcher on the Bulldogs, based on the past season.
-Comment on any unusual data point or points in the data set. Explain.
-Comment on any unusual data point or points in the data set. Explain.
فتح الحزمة
افتح القفل للوصول البطاقات البالغ عددها 150 في هذه المجموعة.
فتح الحزمة
k this deck
71
The bigger the stop sign, the more expensive it is. Here is a graph of the height of a sign in inches versus its cost in dollars.
-Describe why performing linear regression with these data is not a good decision.
-Describe why performing linear regression with these data is not a good decision.
فتح الحزمة
افتح القفل للوصول البطاقات البالغ عددها 150 في هذه المجموعة.
فتح الحزمة
k this deck
72
Baseball coaches use a radar gun to measure the speed of pitcher’s fastball. They also record outcomes such as hits and strikeouts. The scatterplot below shows the relationship between the average speed of a fastball and the average number of strikeouts per nine innings for each pitcher on the Bulldogs, based on the past season.
-Do you think a model based on these data could accurately predict the average number of strikeouts for a pitcher with an average fastball speed of 70 mph.? Explain.
-Do you think a model based on these data could accurately predict the average number of strikeouts for a pitcher with an average fastball speed of 70 mph.? Explain.
فتح الحزمة
افتح القفل للوصول البطاقات البالغ عددها 150 في هذه المجموعة.
فتح الحزمة
k this deck
73
An article in the Journal of Statistics Education reported the price of diamonds of different sizes in Singapore dollars
(SGD). The following table contains a data set that is consistent with this data, adjusted to US dollars in 2004:
-Do you think a linear model is appropriate here? Explain.
(SGD). The following table contains a data set that is consistent with this data, adjusted to US dollars in 2004:
-Do you think a linear model is appropriate here? Explain.
فتح الحزمة
افتح القفل للوصول البطاقات البالغ عددها 150 في هذه المجموعة.
فتح الحزمة
k this deck
74
Crawling Researchers at the University of Denver Infant Study Center investigated whether babies take longer to learn to crawl in cold months (when they are often bundled in clothes that restrict their movement) than in warmer months. The study sought an association between babies' first crawling age (in weeks) and the average temperature during the month they first try to crawl (about 6 months after birth). Between 1988 and
1991 parents reported the birth month and age at which their child was first able to creep
or crawl a distance of four feet in one minute. Data were collected on 208 boys and 206 girls. The graph below plots average crawling ages (in weeks) against the mean temperatures when the babies were 6 months old. The researchers found a correlation of r
= -0.70 and the their line of best fit was
= 36 - 0.08AvTemp.
a. Draw the line of best fit on the graph. (Show your method clearly.)
b. Describe the association in context.
c. Explain (in context) what the slope of the line means.
d. Explain (in context) what the y-intercept of the line means. e. Explain (in context) what means.
f. In this context, what does a negative residual indicate?
فتح الحزمة
افتح القفل للوصول البطاقات البالغ عددها 150 في هذه المجموعة.
فتح الحزمة
k this deck
75
Music and grades (True Story) A couple of years ago a local newspaper published research results claiming a positive association between the number of years high school children had taken instrumental music lessons and their performances in school (GPA).
a. What does "positive association" mean in this context?
b. A group of parents then went to the School Board demanding more funding for music
programs as a way to improve student chances for academic success in high school. As a statistician, do you agree or disagree with their reasoning? Explain briefly.
فتح الحزمة
افتح القفل للوصول البطاقات البالغ عددها 150 في هذه المجموعة.
فتح الحزمة
k this deck
76
Gas mileage An important factor in the amount of gasoline a car uses is the size of the engine. Called "displacement", engine size measures the volume of the cylinders in cubic inches. The regression analysis is shown.
Dependent variable is: MPG
89 total cases of which 0 are missing
squared squared (adjusted)
with degrees of freedom
a. How many cars were included in this analysis?
b. What is the correlation between engine size and fuel economy?
c. A car you are thinking of buying is available with two different size engines, 190 cubic inches or 240 cubic inches. How much difference might this make in your gas mileage? (Show your work.)
فتح الحزمة
افتح القفل للوصول البطاقات البالغ عددها 150 في هذه المجموعة.
فتح الحزمة
k this deck
77
Current research states that a good diet should contain 20-35 grams of dietary fiber. Research also states that each day should start with a healthy breakfast. The nutritional information for 77 breakfast cereals was reviewed to find the grams of fiber and the number of calories per serving. The scatterplot below shows the relationship between fiber and calories for the cereals.
-Do you think a model could accurately predict the number of calories in a serving of cereal that has 22 grams of fiber? Explain.
-Do you think a model could accurately predict the number of calories in a serving of cereal that has 22 grams of fiber? Explain.
فتح الحزمة
افتح القفل للوصول البطاقات البالغ عددها 150 في هذه المجموعة.
فتح الحزمة
k this deck
78
A study examined the number of trees in a variety of orange groves and the corresponding number of oranges that each grove produces in a given harvest year. Linear regression was calculated and the results are below.
linear regression results:
Dependent Variable: oranges
Independent Variable: trees
Sample size: 9
R-sq = 0.886 s = 31394.7
-Does the value of s concern you? How might you deal with this data differently to address this problem?
linear regression results:
Dependent Variable: oranges
Independent Variable: trees
Sample size: 9
R-sq = 0.886 s = 31394.7
-Does the value of s concern you? How might you deal with this data differently to address this problem?
فتح الحزمة
افتح القفل للوصول البطاقات البالغ عددها 150 في هذه المجموعة.
فتح الحزمة
k this deck
79
Earning power A college's job placement office collected data about students' GPAs and the salaries they earned in their first jobs after graduation. The mean GPA was 2.9 with a standard deviation of 0.4. Starting salaries had a mean of $47,200 with a SD of $8500. The correlation between the two variables was r = 0.72. The association appeared to be linear in the scatterplot. (Show work.)
a. Write an equation of the model that can predict salary based on GPA. b. Do you think these predictions will be reliable? Explain.
c. Your brother just graduated from that college with a GPA of 3.30. He tells you that based on this model the residual for his pay is -$1880. What salary is he earning?
فتح الحزمة
افتح القفل للوصول البطاقات البالغ عددها 150 في هذه المجموعة.
فتح الحزمة
k this deck
80
An article in the Journal of Statistics Education reported the price of diamonds of different sizes in Singapore dollars
(SGD). The following table contains a data set that is consistent with this data, adjusted to US dollars in 2004:
-Make a scatterplot and describe the association between the size of the diamond (carat) and the cost (in US dollars).
(SGD). The following table contains a data set that is consistent with this data, adjusted to US dollars in 2004:
-Make a scatterplot and describe the association between the size of the diamond (carat) and the cost (in US dollars).
فتح الحزمة
افتح القفل للوصول البطاقات البالغ عددها 150 في هذه المجموعة.
فتح الحزمة
k this deck
فتح الحزمة
افتح القفل للوصول البطاقات البالغ عددها 150 في هذه المجموعة.


