Deck 1: Stats Start Here
ملء الشاشة (f)
سؤال
سؤال
سؤال
سؤال
The distribution below is the number of family members reported by 25 people in the 2010 Census. 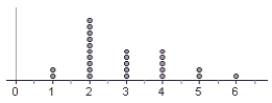 The best description for the shape of this distribution is
A) skewed right
B) normal
C) bimodal
D) approximately normal
E) skewed left
The best description for the shape of this distribution isA) skewed right
B) normal
C) bimodal
D) approximately normal
E) skewed left
سؤال
سؤال
The standard deviation of the data displayed in this dotplot is closest to… 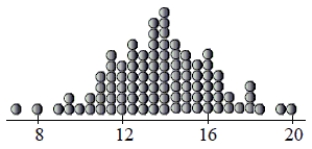
A) 4
B) 2
C) 0.5
D) 1
E) 3.5
A) 4
B) 2
C) 0.5
D) 1
E) 3.5
سؤال
The average scores for Wisconsin schools on the ACT are summarized in the ogive shown. Estimate the IQR of the average scores. 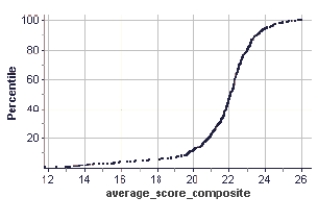
A) 7
B) 50
C) 6
D) 2.8
E) 1.6
A) 7
B) 50
C) 6
D) 2.8
E) 1.6
سؤال
سؤال
سؤال
سؤال
سؤال
سؤال
سؤال
The standard deviation of the data displayed in this dotplot is most likely to be… 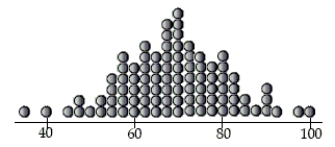
A) 5
B) 20
C) 12
D) 18
E) 8
A) 5
B) 20
C) 12
D) 18
E) 8
سؤال
سؤال
سؤال
سؤال
سؤال
سؤال
سؤال
In order to plan transportation and parking needs at a private high school, administrators asked students how they get to school. Some rode a school bus, some rode in with parents or friends, and others used "personal" transportation - bikes, skateboards, or just walked. The table summarizes the responses from boys and girls.
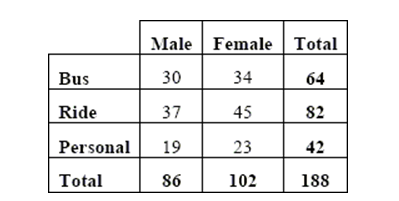
-What is the marginal distribution of gender?
-What is the marginal distribution of gender?
سؤال
Nickels minted in the United States are supposed to weigh 5.000 grams. Of course there is some variation in that. The actual weights are pretty well represented by a normal model with a mean of 5.000 g and a standard deviation of about 0.08 g. Draw and clearly label this model. 
سؤال
The best estimate of the standard deviation of the mens' weights displayed in this dotplot is 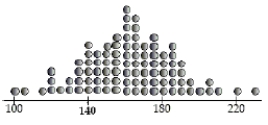
A) 35
B) 40
C) 15
D) 10
E) 25
A) 35
B) 40
C) 15
D) 10
E) 25
سؤال
The boxplots show fuel economy of 2011 model cars for the classes shown. 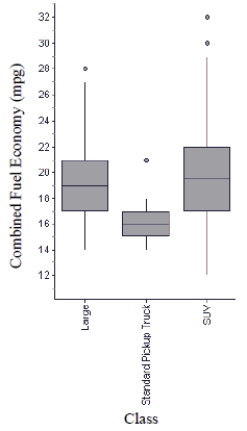
a. Which class offers the car with the best gas mileage, and what is the mileage of that car?
b. Which class has the highest median gas mileage, and how much is it?
c. Which class of car has the smallest range of fuel economy, and what is it?
d. Which class of car has the smallest IQR, and what is it?
e. Which class of car generally gets the best mileage? Explain.
سؤال
One thousand students from a local university were sampled to gather information such as gender, high school GPA, college GPA, and total SAT scores. The results were used to create histograms displaying high school grade point averages (GPA's) for both males and females. Compare the grade distribution of males and females. 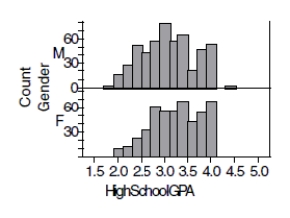
سؤال
سؤال
سؤال
سؤال
سؤال
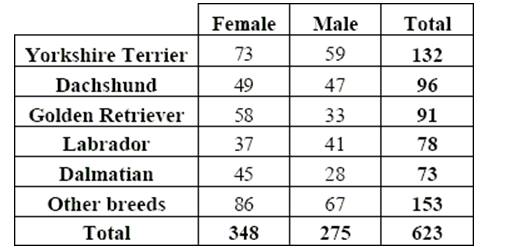
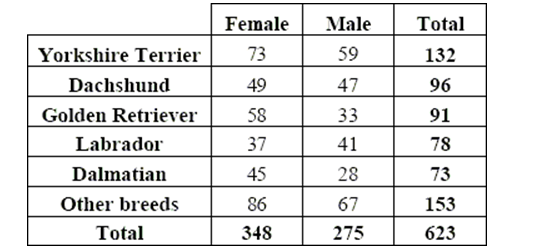
To determine if people's preference in dogs had changed in the recent years, organizers of a local dog show asked people who attended the show to indicate which breed was their favorite. This information was compiled by dog breed and gender of the people who responded. The table summarizes the responses.
-Which of the W's are unknown for these data?
-Which of the W's are unknown for these data?
سؤال
سؤال
Owners of an exercise gym believe that a Normal model is useful in projecting the number of clients who will exercise in their gym each week. They use a mean of 800 clients and a standard deviation of 90 clients.
a. Draw and clearly label this model.
![Owners of an exercise gym believe that a Normal model is useful in projecting the number of clients who will exercise in their gym each week. They use a mean of 800 clients and a standard deviation of 90 clients. a. Draw and clearly label this model. b. What is the first quartile of the weekly number of clients? [Show work] c. An owner of another gym reports that 5% of the time their gym has fewer than 450 clients, and 40% of the time the gym has more than 1085 clients. What parameters should that owner use for his Normal model? N( \underline{\quad\quad} , \underline{\quad\quad} ) <div style=padding-top: 35px>](https://d2lvgg3v3hfg70.cloudfront.net/TB1710/11eb0de6_73d8_5a71_9790_e50789c92011_TB1710_00.jpg)
b. What is the first quartile of the weekly number of clients? [Show work]
c. An owner of another gym reports that 5% of the time their gym has fewer than 450 clients, and 40% of the time the gym has more than 1085 clients. What parameters should that owner use for his Normal model? N( , )
a. Draw and clearly label this model.
b. What is the first quartile of the weekly number of clients? [Show work]
c. An owner of another gym reports that 5% of the time their gym has fewer than 450 clients, and 40% of the time the gym has more than 1085 clients. What parameters should that owner use for his Normal model? N( , )
سؤال
سؤال
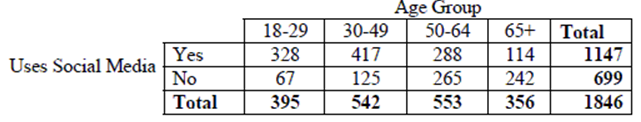
A research company frequently monitors trends in the use of social media by American Adults. The results of one survey of 1846 randomly selected adults looked at social media use versus age group. The table summarizes the survey results.
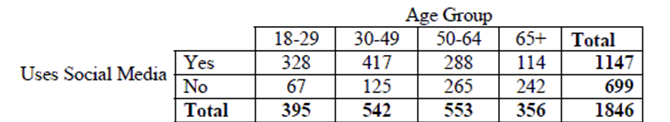
-Find each percent.
a) What percent of adults surveyed are social media users aged 30-49?
b) What percent of the social media users are aged 30-49?
c) What percent of adults aged 30-49 are social media users?
-Find each percent.
a) What percent of adults surveyed are social media users aged 30-49?
b) What percent of the social media users are aged 30-49?
c) What percent of adults aged 30-49 are social media users?
سؤال
سؤال
سؤال
Owners of a minor league baseball team believe that a Normal model is useful in projecting the number of fans who will attend home games. They use a mean of 8500 fans and a standard deviation of 1500 fans. Draw and clearly label this model. 
سؤال
سؤال
The Wechsler Adult Intelligence Scale - Revised (WAIS-R) follow a Normal model with mean 100 and
standard deviation 15. Draw and clearly label this model.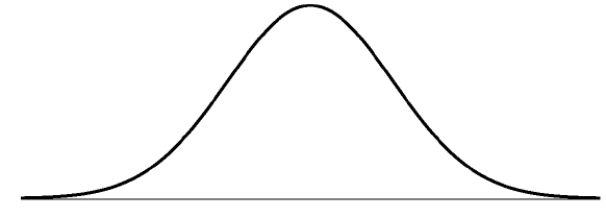
standard deviation 15. Draw and clearly label this model.
سؤال
To determine if people's preference in dogs had changed in the recent years, organizers of a local dog show asked people who attended the show to indicate which breed was their favorite. This information was compiled by dog breed and gender of the people who responded. The table summarizes the responses.
-Find each percent.
a. What percent of the responses were from males who favor Labradors?
b. What percent of the male responses favor Labradors?
c. What percent of the people who choose Labradors were males?
-Find each percent.
a. What percent of the responses were from males who favor Labradors?
b. What percent of the male responses favor Labradors?
c. What percent of the people who choose Labradors were males?
سؤال
سؤال
سؤال
سؤال
Soft drinks A restaurant owner wanted to improve the efficiency of his employees. One way he tried to do this was to buy a machine that will automatically dispense 16 oz. of soda into a glass rather than have the employee hold the button on the dispenser. The actual amount dispensed by the machine can be represented by the model N(16.2, 0.3)
a. Draw and clearly label the model.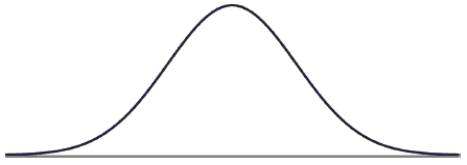
b. The sales representative who sold him the machine said, "95% of the glasses you fill with soda will fall between and ." Fill in the blanks based on the normal model, then comment on this claim.
c. What is the 3rd quartile of amounts dispensed?
d. If a glass will actually hold 16.7 oz. of soda, what percent of the time would you expect the glass to overflow?
e. The manufacturer wants to reduce the overflow rate to only 1%. Assuming the mean amount dispensed will stay the same, what standard deviation must they achieve?
f. Briefly explain what that change in standard deviation means in this context.
g. A competing manufacturer says that not only will 98% of their glasses be safe from overflowing, but 70% will have more than 16 oz., reducing customer complaints. What Normal model parameters is that manufacturer claiming? Show your work. N( , )
سؤال
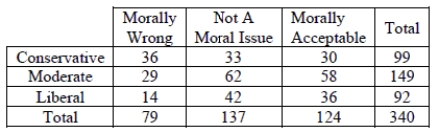
Embryonic stem cells A Pew Research survey asked Americans their feelings on medical use of embryonic stem cells. Say they surveyed 340 people and got the results summarized in the table.
a. What percent of the moderates said it is morally acceptable?
b. What is the conditional relative frequency distribution of belief for for conservatives?
c. If you wanted to show the association between political affiliation and feelings toward medical use of embryonic stem cells, what kind of graph would you make? (Just name it.)
d. Is there evidence of an association between political affiliation and feelings toward medical use of embryonic stem cells? Explain briefly.
سؤال
In order to plan transportation and parking needs at a private high school, administrators asked students how they get to school. Some rode a school bus, some rode in with parents or friends, and others used "personal" transportation - bikes, skateboards, or just walked. The table summarizes the responses from boys and girls.
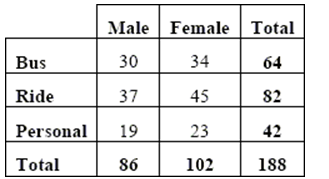
-Do you think mode of transportation is independent of gender? Give statistical evidence to support your conclusion.
-Do you think mode of transportation is independent of gender? Give statistical evidence to support your conclusion.
سؤال
The boxplots show prices of used cars (in thousands of dollars) advertised for sale at three different car dealers. 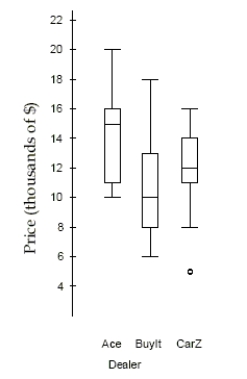
a. Which dealer offers the cheapest car offered, and at what price? b. Which dealer has the lowest median price, and how much is it? c. Which dealer has the smallest price range, and what is it?
d. Which dealer's prices have the smallest IQR, and what is it?
e. Which dealer generally sells cars cheapest? Explain.
سؤال
سؤال
Commuting to work The table shows how a company's employees commute to work. 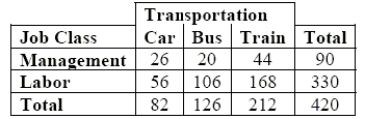
a. What is the marginal distribution (in %) of mode of transportation? Car Bus _ Train
b. What is the conditional distribution (in %) of mode of transportation for management? Car Bus Train
c. What kind of display would you use to show the association between job class and mode of transportation? (Just name a graph.)
d. Do job classification and mode of transportation appear to be independent? Give statistical evidence to support your conclusion.
سؤال
Auto insurance The Insurance Institute for Highway Safety publishes ratings for all models of vehicles to compare the relative risk of payouts. 100 is the mean rating for all vehicles. A rating of 122 means the vehicle is 22% worse than average. The table shows the summary statistics for the collision ratings of 27 midsize cars.
a. Were any of the ratings outliers? Show how you made your decision.
b. A histogram of the data is shown. Is it more appropriate to use the mean and standard
deviation, or the median and IQR to describe these data? Explain.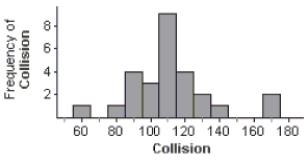
a. Were any of the ratings outliers? Show how you made your decision.
b. A histogram of the data is shown. Is it more appropriate to use the mean and standard
deviation, or the median and IQR to describe these data? Explain.
سؤال
سؤال
سؤال
سؤال
سؤال
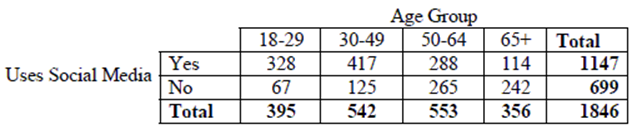
A research company frequently monitors trends in the use of social media by American Adults. The results of one survey of 1846 randomly selected adults looked at social media use versus age group. The table summarizes the survey results.
-What is the marginal distribution of age groups?
-What is the marginal distribution of age groups?
سؤال
سؤال
Copy machines A manufacturer claims that lifespans for their copy machines (in months)can be described by a Normal model N(42, 7). Show your work.
a. Draw and clearly label the model.
b. A company with several large office buildings buys 200 of these copiers. The salesman tells the boss "190 (95%) of your new copiers will last between and months." Comment on this claim.
c. What is the 3rd quartile of copier lifespans?
d. What percent of the copiers are expected to fail before 36 months?
e. The manufacturer wants to reduce the 36-month failure rate to only 10%. Assuming the mean lifespan will stay the same, what standard deviation must they achieve?
f. Briefly explain what that change in standard deviation means in this context.
g. A competing manufacturer says that not only will 90% of their copiers last at least 36 months, 65% will last at least 42 months. What Normal model parameters is that manufacturer claiming? Show your work. N( , )
سؤال
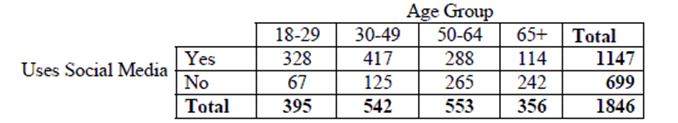
A research company frequently monitors trends in the use of social media by American Adults. The results of one survey of 1846 randomly selected adults looked at social media use versus age group. The table summarizes the survey results.
-Write a sentence or two about the conditional relative frequency distribution of ages of social media users.
-Write a sentence or two about the conditional relative frequency distribution of ages of social media users.
سؤال
سؤال
سؤال
A research company frequently monitors trends in the use of social media by American Adults. The results of one survey of 1846 randomly selected adults looked at social media use versus age group. The table summarizes the survey results.
-Identify the variables and tell whether each is categorical or quantitative.
-Identify the variables and tell whether each is categorical or quantitative.
سؤال
سؤال
سؤال
سؤال
سؤال
سؤال
سؤال
Cats and dogs The table shows whether students in an introductory statistics class like dogs and/or cats. 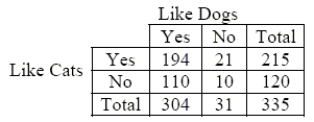
a. What is the marginal distribution (in %) of "liking dogs"?
b. What is the conditional distribution (in %) of "liking dogs" for students who like cats?
c. What kind of display(s) would you use to examine the association between "liking dogs"and "liking cats"? (Just name a graph.)
d. Do "liking dogs" and "liking cats" appear to be independent? Give statistical evidence to support your conclusion.
سؤال
سؤال
To determine if people's preference in dogs had changed in the recent years, organizers of a local dog show asked people who attended the show to indicate which breed was their favorite. This information was compiled by dog breed and gender of the people who responded. The table summarizes the responses.
-Do you think the breed selection is independent of gender? Give statistical evidence to support your conclusion.
-Do you think the breed selection is independent of gender? Give statistical evidence to support your conclusion.
سؤال
The boxplots show the age of people involved in accidents according to their role in the accident. 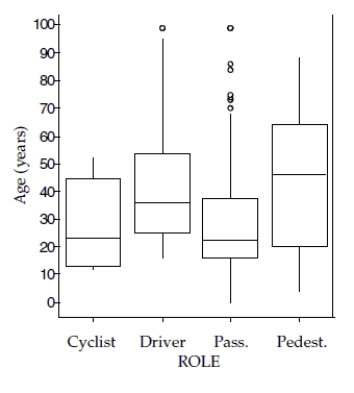
a. Which role involved the youngest person, and what is the age?
b. Which role had the lowest median age, and what is the age?
c. Which role had smallest range of ages, and what is it?
d. Which role had the largest IQR of ages, and what is it?
e. Which role generally involved the oldest people? Explain.
سؤال
سؤال
سؤال
سؤال
The side-by-side boxplots show the cumulative college GPAs for sophomores, juniors, and seniors taking an intro stats course in Autumn 2003. 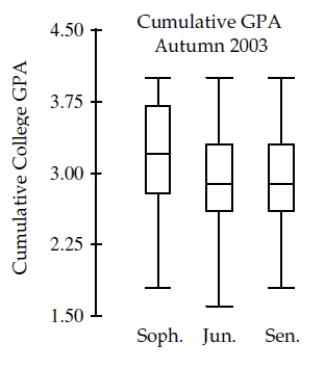
a. Which class (sophomore, junior, or senior) had the lowest cumulative college GPA? What is the approximate value of that GPA?
b. Which class had the highest median GPA, and what is that GPA?
c. Which class had the largest range for GPA, and what is it?
d. Which class had the most symmetric set of GPAs? The most skewed set of GPAs?
سؤال
The Postmaster of a city's Post Office believes that a Normal model is useful in projecting the number of letters which will be mailed during the day. They use a mean of 20,000 letters and a standard deviation of 250 letters. Draw and clearly label this model. 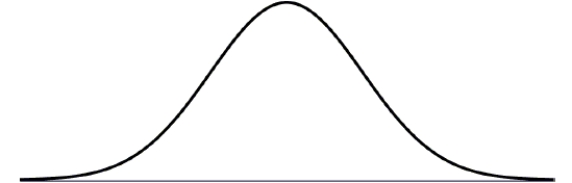
سؤال
سؤال
سؤال
A research company frequently monitors trends in the use of social media by American Adults. The results of one survey of 1846 randomly selected adults looked at social media use versus age group. The table summarizes the survey results.
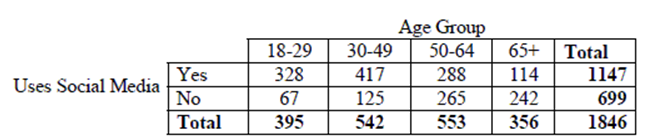
-Do you think social media use is independent of age? Give statistical evidence to support your conclusion.
-Do you think social media use is independent of age? Give statistical evidence to support your conclusion.
سؤال

فتح الحزمة
قم بالتسجيل لفتح البطاقات في هذه المجموعة!
Unlock Deck
Unlock Deck
1/115
العب
ملء الشاشة (f)
Deck 1: Stats Start Here
1
The United States Census collects data on many variables about individuals and households.
Which variable is categorical?
A) family size
B) hours worked per week
C) annual electricity cost
D) type of residence
E) monthly mortgage
Which variable is categorical?
A) family size
B) hours worked per week
C) annual electricity cost
D) type of residence
E) monthly mortgage
D
2
Which of the following variables would most likely follow a Normal model?
A) all of these
B) weights of adult male elephants
C) heights of singers in a co-ed choir
D) scores on an easy test
E) family income
A) all of these
B) weights of adult male elephants
C) heights of singers in a co-ed choir
D) scores on an easy test
E) family income
B
3
Which of these variables is most likely to be bimodal?
A) hours of homework last week
B) number of TV sets at home
C) eye color
D) number of cigarettes smoked daily
E) head circumference
A) hours of homework last week
B) number of TV sets at home
C) eye color
D) number of cigarettes smoked daily
E) head circumference
D
4
The distribution below is the number of family members reported by 25 people in the 2010 Census. The best description for the shape of this distribution is
A) skewed right
B) normal
C) bimodal
D) approximately normal
E) skewed left
The best description for the shape of this distribution isA) skewed right
B) normal
C) bimodal
D) approximately normal
E) skewed left
فتح الحزمة
افتح القفل للوصول البطاقات البالغ عددها 115 في هذه المجموعة.
فتح الحزمة
k this deck
5
We collect these data from 50 male students. Which variable is categorical?
A) hours of homework last week
B) head circumference
C) number of cigarettes smoked daily
D) eye color
E) number of TV sets at home
A) hours of homework last week
B) head circumference
C) number of cigarettes smoked daily
D) eye color
E) number of TV sets at home
فتح الحزمة
افتح القفل للوصول البطاقات البالغ عددها 115 في هذه المجموعة.
فتح الحزمة
k this deck
6
The standard deviation of the data displayed in this dotplot is closest to…
A) 4
B) 2
C) 0.5
D) 1
E) 3.5
A) 4
B) 2
C) 0.5
D) 1
E) 3.5
فتح الحزمة
افتح القفل للوصول البطاقات البالغ عددها 115 في هذه المجموعة.
فتح الحزمة
k this deck
7
The average scores for Wisconsin schools on the ACT are summarized in the ogive shown. Estimate the IQR of the average scores.
A) 7
B) 50
C) 6
D) 2.8
E) 1.6
A) 7
B) 50
C) 6
D) 2.8
E) 1.6
فتح الحزمة
افتح القفل للوصول البطاقات البالغ عددها 115 في هذه المجموعة.
فتح الحزمة
k this deck
8
To see if your school's ACT scores are improving since implementing a new program, the ACT
Scores for the past several years should be displayed in a
A) contingency table
B) timeplot
C) histogram
D) bar graph
E) boxplot
Scores for the past several years should be displayed in a
A) contingency table
B) timeplot
C) histogram
D) bar graph
E) boxplot
فتح الحزمة
افتح القفل للوصول البطاقات البالغ عددها 115 في هذه المجموعة.
فتح الحزمة
k this deck
9
The SPCA collects the following data about the dogs they house. Which is categorical?
A) weight
B) number of days housed
C) veterinary costs
D) age
E) breed
A) weight
B) number of days housed
C) veterinary costs
D) age
E) breed
فتح الحزمة
افتح القفل للوصول البطاقات البالغ عددها 115 في هذه المجموعة.
فتح الحزمة
k this deck
10
Which type of plot would be least likely to reveal that a distribution is bimodal?
A) dotplot
B) histogram
C) boxplot
D) ogive
E) stemplot
A) dotplot
B) histogram
C) boxplot
D) ogive
E) stemplot
فتح الحزمة
افتح القفل للوصول البطاقات البالغ عددها 115 في هذه المجموعة.
فتح الحزمة
k this deck
11
Suppose that a Normal model described student scores in a history class. Parker has a standardized score (z-score) of +2.5. This means that Parker
A) is 2.5 standard deviations above average for the class.
B) has a standard deviation of 2.5.
C) has a score that is 2.5 times the average for the class.
D) is 2.5 points above average for the class.
E) none of these
A) is 2.5 standard deviations above average for the class.
B) has a standard deviation of 2.5.
C) has a score that is 2.5 times the average for the class.
D) is 2.5 points above average for the class.
E) none of these
فتح الحزمة
افتح القفل للوصول البطاقات البالغ عددها 115 في هذه المجموعة.
فتح الحزمة
k this deck
12
If we want to discuss any gaps and clusters in a data set, which of the following should not be chosen to display the data set?
A) boxplot
B) dotplot
C) any of these would work
D) histogram
E) stem-and-leaf plot
A) boxplot
B) dotplot
C) any of these would work
D) histogram
E) stem-and-leaf plot
فتح الحزمة
افتح القفل للوصول البطاقات البالغ عددها 115 في هذه المجموعة.
فتح الحزمة
k this deck
13
Suppose that a Normal model describes fuel economy (miles per gallon) for automobiles and that a
Saturn has a standardized score (z-score) of +2.2. This means that Saturns . . .
A) achieve fuel economy that is 2.2 standard deviations better than the average car.
B) get 2.2 mpg more than the average car.
C) have a standard deviation of 2.2 mpg.
D) get 2.2 miles per gallon.
E) get 2.2 times the gas mileage of the average car.
فتح الحزمة
افتح القفل للوصول البطاقات البالغ عددها 115 في هذه المجموعة.
فتح الحزمة
k this deck
14
The standard deviation of the data displayed in this dotplot is most likely to be…
A) 5
B) 20
C) 12
D) 18
E) 8
A) 5
B) 20
C) 12
D) 18
E) 8
فتح الحزمة
افتح القفل للوصول البطاقات البالغ عددها 115 في هذه المجموعة.
فتح الحزمة
k this deck
15
The advantage of making a stem-and-leaf display instead of a dotplot is that a stem-and-leaf display
A) shows the shape of the distribution better than a dotplot.
B) A stem-and-leaf display is for quantitative data, while a dotplot shows categorical data.
C) satisfies the area principle.
D) preserves the individual data values.
E) none of these
A) shows the shape of the distribution better than a dotplot.
B) A stem-and-leaf display is for quantitative data, while a dotplot shows categorical data.
C) satisfies the area principle.
D) preserves the individual data values.
E) none of these
فتح الحزمة
افتح القفل للوصول البطاقات البالغ عددها 115 في هذه المجموعة.
فتح الحزمة
k this deck
16
Which variable about German Shepherds is most likely to be described by a Normal model?
A) age
B) veterinary costs
C) breed
D) number of days housed
E) weight
A) age
B) veterinary costs
C) breed
D) number of days housed
E) weight
فتح الحزمة
افتح القفل للوصول البطاقات البالغ عددها 115 في هذه المجموعة.
فتح الحزمة
k this deck
17
Which of these variables is most likely to follow a Normal model for U.S. adults?
A) ACT scores
B) commuting time
C) monthly mortgage
D) eye color
E) income
A) ACT scores
B) commuting time
C) monthly mortgage
D) eye color
E) income
فتح الحزمة
افتح القفل للوصول البطاقات البالغ عددها 115 في هذه المجموعة.
فتح الحزمة
k this deck
18
Suppose that a Normal model describes the acidity (pH) of rainwater, and that water tested after last week's storm had a z-score of 1.8. This means that the acidity of that rain …
A) had a pH 1.8 standard deviations higher than that of average rainwater.
B) varied with a standard deviation of 1.8.
C) had a pH 1.8 times that of average rainwater.
D) had a pH 1.8 higher than average rainfall.
E) had a pH of 1.8.
A) had a pH 1.8 standard deviations higher than that of average rainwater.
B) varied with a standard deviation of 1.8.
C) had a pH 1.8 times that of average rainwater.
D) had a pH 1.8 higher than average rainfall.
E) had a pH of 1.8.
فتح الحزمة
افتح القفل للوصول البطاقات البالغ عددها 115 في هذه المجموعة.
فتح الحزمة
k this deck
19
The five-number summary of credit hours for 24 students in a statistics class is:
Which statement is true?
A) There is at least one high outlier in the data.
B) There are no outliers in the data.
C) There is at least one low outlier in the data.
D) None of these.
E) There are both low and high outliers in the data.
Which statement is true?
A) There is at least one high outlier in the data.
B) There are no outliers in the data.
C) There is at least one low outlier in the data.
D) None of these.
E) There are both low and high outliers in the data.
فتح الحزمة
افتح القفل للوصول البطاقات البالغ عددها 115 في هذه المجموعة.
فتح الحزمة
k this deck
20
Which type of plot would be most appropriate to display the responses to type of residence?
A) timeplot
B) boxplot
C) dotplot
D) histogram
E) pie chart
A) timeplot
B) boxplot
C) dotplot
D) histogram
E) pie chart
فتح الحزمة
افتح القفل للوصول البطاقات البالغ عددها 115 في هذه المجموعة.
فتح الحزمة
k this deck
21
In order to plan transportation and parking needs at a private high school, administrators asked students how they get to school. Some rode a school bus, some rode in with parents or friends, and others used "personal" transportation - bikes, skateboards, or just walked. The table summarizes the responses from boys and girls.
-What is the marginal distribution of gender?
-What is the marginal distribution of gender?
فتح الحزمة
افتح القفل للوصول البطاقات البالغ عددها 115 في هذه المجموعة.
فتح الحزمة
k this deck
22
Nickels minted in the United States are supposed to weigh 5.000 grams. Of course there is some variation in that. The actual weights are pretty well represented by a normal model with a mean of 5.000 g and a standard deviation of about 0.08 g. Draw and clearly label this model.
فتح الحزمة
افتح القفل للوصول البطاقات البالغ عددها 115 في هذه المجموعة.
فتح الحزمة
k this deck
23
The best estimate of the standard deviation of the mens' weights displayed in this dotplot is
A) 35
B) 40
C) 15
D) 10
E) 25
A) 35
B) 40
C) 15
D) 10
E) 25
فتح الحزمة
افتح القفل للوصول البطاقات البالغ عددها 115 في هذه المجموعة.
فتح الحزمة
k this deck
24
The boxplots show fuel economy of 2011 model cars for the classes shown.
a. Which class offers the car with the best gas mileage, and what is the mileage of that car?
b. Which class has the highest median gas mileage, and how much is it?
c. Which class of car has the smallest range of fuel economy, and what is it?
d. Which class of car has the smallest IQR, and what is it?
e. Which class of car generally gets the best mileage? Explain.
فتح الحزمة
افتح القفل للوصول البطاقات البالغ عددها 115 في هذه المجموعة.
فتح الحزمة
k this deck
25
One thousand students from a local university were sampled to gather information such as gender, high school GPA, college GPA, and total SAT scores. The results were used to create histograms displaying high school grade point averages (GPA's) for both males and females. Compare the grade distribution of males and females.
فتح الحزمة
افتح القفل للوصول البطاقات البالغ عددها 115 في هذه المجموعة.
فتح الحزمة
k this deck
26
The five-number summary for the fuel economy (in miles per gallon) of year 2011 midsize cars is:
a. Would you expect the mean gas mileage of all midsize cars to be higher or lower than the median? Explain.
b. One model of Volkswagon gets 34 mpg, one model of Toyota gets 28 mpg, and one model of Bentley gets 13 mpg. Are any of these cars outliers? Explain.
a. Would you expect the mean gas mileage of all midsize cars to be higher or lower than the median? Explain.
b. One model of Volkswagon gets 34 mpg, one model of Toyota gets 28 mpg, and one model of Bentley gets 13 mpg. Are any of these cars outliers? Explain.
فتح الحزمة
افتح القفل للوصول البطاقات البالغ عددها 115 في هذه المجموعة.
فتح الحزمة
k this deck
27
The lifespans of a particular brand of graphing calculator are approximately normally distributed with a mean of 620 days from the purchase date and a standard deviation of 82 days. They will provide a warranty that guarantees a replacement if the calculator stops working within the specified time frame, and are trying to decide what time frame to use. a. If the company sets the warranty at a year and a half (say 540 days), what proportion of calculators will they have to replace?
b. The company does not want to have to replace more than 1% of the calculators they sell. What length of time should they set for the warranty?
c. The company would like to set the warranty for 540 days, and still replace no more than
1% of the calculators sold. Increasing the average life of the calculators is too expensive, but
they think they reduce the standard deviation of the lifespans. What standard deviation of lifespans would be needed to make this happen?
d. Explain what achieving a smaller standard deviation means in this context.
فتح الحزمة
افتح القفل للوصول البطاقات البالغ عددها 115 في هذه المجموعة.
فتح الحزمة
k this deck
28
Dimes minted in the United States average 2.286 g with a standard deviation of 0.06 g. A couple chemistry students were trying out their teacher's new scale by weighing a bunch of coins. The found a nickel that weighed 5.19 g and a dime that weighed 2.45 g. Which coin was more exceptionally heavy? Explain.
فتح الحزمة
افتح القفل للوصول البطاقات البالغ عددها 115 في هذه المجموعة.
فتح الحزمة
k this deck
29
A professor has kept records on grades that students have earned in his class. If he wants to examine the percentage of students earning the grades A, B, C, D, and F during the most recent term, which kind of plot could he make?
A) pie chart
B) boxplot
C) dotplot
D) timeplot
E) histogram
A) pie chart
B) boxplot
C) dotplot
D) timeplot
E) histogram
فتح الحزمة
افتح القفل للوصول البطاقات البالغ عددها 115 في هذه المجموعة.
فتح الحزمة
k this deck
30
To determine if people's preference in dogs had changed in the recent years, organizers of a local dog show asked people who attended the show to indicate which breed was their favorite. This information was compiled by dog breed and gender of the people who responded. The table summarizes the responses.
-Which of the W's are unknown for these data?
-Which of the W's are unknown for these data?
فتح الحزمة
افتح القفل للوصول البطاقات البالغ عددها 115 في هذه المجموعة.
فتح الحزمة
k this deck
31
In June 2003 Consumer Reports published an article on some sport-utility vehicles they had tested recently. They reported some basic information about each of the vehicles and the results of some tests conducted by their staff. Among other things, the article told the brand of each vehicle, its price, and whether it had a standard or automatic transmission. They reported the vehicle's fuel economy, its acceleration (number of seconds to go from zero to 60 mph), and its braking distance to stop from 60 mph. The article also rated each vehicle’s reliability as much better than average, better than average, average, worse, or much worse than average.
-Describe the W's, if the information is given:
· Who:
· What:
· When:
· Where:
· How:
· Why:
-Describe the W's, if the information is given:
· Who:
· What:
· When:
· Where:
· How:
· Why:
فتح الحزمة
افتح القفل للوصول البطاقات البالغ عددها 115 في هذه المجموعة.
فتح الحزمة
k this deck
32
Owners of an exercise gym believe that a Normal model is useful in projecting the number of clients who will exercise in their gym each week. They use a mean of 800 clients and a standard deviation of 90 clients.
a. Draw and clearly label this model.
b. What is the first quartile of the weekly number of clients? [Show work]
c. An owner of another gym reports that 5% of the time their gym has fewer than 450 clients, and 40% of the time the gym has more than 1085 clients. What parameters should that owner use for his Normal model? N( , )
فتح الحزمة
افتح القفل للوصول البطاقات البالغ عددها 115 في هذه المجموعة.
فتح الحزمة
k this deck
33
School administrators collect data on students attending the school. Which of the following variables is quantitative?
A) whether the student is in AP* classes
B) grade point average
C) whether the student has taken the SAT
D) class (freshman, soph., junior, senior)
E) none of these
A) whether the student is in AP* classes
B) grade point average
C) whether the student has taken the SAT
D) class (freshman, soph., junior, senior)
E) none of these
فتح الحزمة
افتح القفل للوصول البطاقات البالغ عددها 115 في هذه المجموعة.
فتح الحزمة
k this deck
34
A research company frequently monitors trends in the use of social media by American Adults. The results of one survey of 1846 randomly selected adults looked at social media use versus age group. The table summarizes the survey results.
-Find each percent.
a) What percent of adults surveyed are social media users aged 30-49?
b) What percent of the social media users are aged 30-49?
c) What percent of adults aged 30-49 are social media users?
-Find each percent.
a) What percent of adults surveyed are social media users aged 30-49?
b) What percent of the social media users are aged 30-49?
c) What percent of adults aged 30-49 are social media users?
فتح الحزمة
افتح القفل للوصول البطاقات البالغ عددها 115 في هذه المجموعة.
فتح الحزمة
k this deck
35
Which of these variables is most likely to follow a Normal model?
A) hours of homework last week
B) number of cigarettes smoked daily
C) eye color
D) number of TV sets at home
E) head circumference
A) hours of homework last week
B) number of cigarettes smoked daily
C) eye color
D) number of TV sets at home
E) head circumference
فتح الحزمة
افتح القفل للوصول البطاقات البالغ عددها 115 في هذه المجموعة.
فتح الحزمة
k this deck
36
Repair bills An automobile service shop reported the summary statistics shown for repair bills (in $) for their customers last month.
a. Were any of the bills outliers? Show how you made your decision.
b. After checking out a problem with your car the service manager gives you an estimate of
"only $90." Is he right to imply that your bill will be unusually low? Explain briefly.
a. Were any of the bills outliers? Show how you made your decision.
b. After checking out a problem with your car the service manager gives you an estimate of
"only $90." Is he right to imply that your bill will be unusually low? Explain briefly.
فتح الحزمة
افتح القفل للوصول البطاقات البالغ عددها 115 في هذه المجموعة.
فتح الحزمة
k this deck
37
Owners of a minor league baseball team believe that a Normal model is useful in projecting the number of fans who will attend home games. They use a mean of 8500 fans and a standard deviation of 1500 fans. Draw and clearly label this model.
فتح الحزمة
افتح القفل للوصول البطاقات البالغ عددها 115 في هذه المجموعة.
فتح الحزمة
k this deck
38
All students in a physical education class completed a basketball free-throw shooting event and the highest number of shots made was 32. The next day a student who had just transferred into the school completed the event, making 35 shots. Indicate whether adding the new student's score to the rest of the data made each of these summary statistics increase, decrease, or stay about the same.
a. mean
b. median c. range
d. IQR
e. standard deviation
a. mean
b. median c. range
d. IQR
e. standard deviation
فتح الحزمة
افتح القفل للوصول البطاقات البالغ عددها 115 في هذه المجموعة.
فتح الحزمة
k this deck
39
The Wechsler Adult Intelligence Scale - Revised (WAIS-R) follow a Normal model with mean 100 and
standard deviation 15. Draw and clearly label this model.
standard deviation 15. Draw and clearly label this model.
فتح الحزمة
افتح القفل للوصول البطاقات البالغ عددها 115 في هذه المجموعة.
فتح الحزمة
k this deck
40
To determine if people's preference in dogs had changed in the recent years, organizers of a local dog show asked people who attended the show to indicate which breed was their favorite. This information was compiled by dog breed and gender of the people who responded. The table summarizes the responses.
-Find each percent.
a. What percent of the responses were from males who favor Labradors?
b. What percent of the male responses favor Labradors?
c. What percent of the people who choose Labradors were males?
-Find each percent.
a. What percent of the responses were from males who favor Labradors?
b. What percent of the male responses favor Labradors?
c. What percent of the people who choose Labradors were males?
فتح الحزمة
افتح القفل للوصول البطاقات البالغ عددها 115 في هذه المجموعة.
فتح الحزمة
k this deck
41
There are 18 roller coasters in Virginia for which the lengths (in feet) were reported. Those lengths are listed in the table at the right.
a. Sketch a histogram for these data.
b. Find the mean and standard deviation of the roller coaster lengths.
c. Is it appropriate to use the mean and standard deviation to summarize these data?
Explain.
d. Describe the distribution of roller coaster lengths.
a. Sketch a histogram for these data.
b. Find the mean and standard deviation of the roller coaster lengths.
c. Is it appropriate to use the mean and standard deviation to summarize these data?
Explain.
d. Describe the distribution of roller coaster lengths.
فتح الحزمة
افتح القفل للوصول البطاقات البالغ عددها 115 في هذه المجموعة.
فتح الحزمة
k this deck
42
Book sales A publishing company pays its sales staff $600 a week plus a commission of $0.50 per book sold. For example, a salesman who sold 440 books earned 600 + 0.50(440) =$820.
a. The table shows summary statistics for the number of books the large sales staff sold last week. Fill in the table to show the statistics for the pay these people earned.
b. The newest employee had a pretty good week. Among all the salespeople her pay corresponded to a z-score of +1.80. What was the z-score of the number of books she sold?
فتح الحزمة
افتح القفل للوصول البطاقات البالغ عددها 115 في هذه المجموعة.
فتح الحزمة
k this deck
43
One of the reasons that the Monitoring the Future (MTF) project was started was "to study changes in the beliefs, attitudes, and behavior of young people in the United States." Data are collected from 8th, 10th, and 12th graders each year. To get a representative nationwide sample, surveys are given to a randomly selected group of students. In Spring 2004, students were asked about alcohol, illegal drug, and cigarette use. Describe the W's, if the information is given. If the information is not given, state that it is not specified.
· Who:
· What:
· When:
· Where:
· How:
· Why:
· Who:
· What:
· When:
· Where:
· How:
· Why:
فتح الحزمة
افتح القفل للوصول البطاقات البالغ عددها 115 في هذه المجموعة.
فتح الحزمة
k this deck
44
Soft drinks A restaurant owner wanted to improve the efficiency of his employees. One way he tried to do this was to buy a machine that will automatically dispense 16 oz. of soda into a glass rather than have the employee hold the button on the dispenser. The actual amount dispensed by the machine can be represented by the model N(16.2, 0.3)
a. Draw and clearly label the model.
b. The sales representative who sold him the machine said, "95% of the glasses you fill with soda will fall between and ." Fill in the blanks based on the normal model, then comment on this claim.
c. What is the 3rd quartile of amounts dispensed?
d. If a glass will actually hold 16.7 oz. of soda, what percent of the time would you expect the glass to overflow?
e. The manufacturer wants to reduce the overflow rate to only 1%. Assuming the mean amount dispensed will stay the same, what standard deviation must they achieve?
f. Briefly explain what that change in standard deviation means in this context.
g. A competing manufacturer says that not only will 98% of their glasses be safe from overflowing, but 70% will have more than 16 oz., reducing customer complaints. What Normal model parameters is that manufacturer claiming? Show your work. N( , )
a. Draw and clearly label the model.
b. The sales representative who sold him the machine said, "95% of the glasses you fill with soda will fall between and ." Fill in the blanks based on the normal model, then comment on this claim.
c. What is the 3rd quartile of amounts dispensed?
d. If a glass will actually hold 16.7 oz. of soda, what percent of the time would you expect the glass to overflow?
e. The manufacturer wants to reduce the overflow rate to only 1%. Assuming the mean amount dispensed will stay the same, what standard deviation must they achieve?
f. Briefly explain what that change in standard deviation means in this context.
g. A competing manufacturer says that not only will 98% of their glasses be safe from overflowing, but 70% will have more than 16 oz., reducing customer complaints. What Normal model parameters is that manufacturer claiming? Show your work. N( , )
فتح الحزمة
افتح القفل للوصول البطاقات البالغ عددها 115 في هذه المجموعة.
فتح الحزمة
k this deck
45
Embryonic stem cells A Pew Research survey asked Americans their feelings on medical use of embryonic stem cells. Say they surveyed 340 people and got the results summarized in the table.
a. What percent of the moderates said it is morally acceptable?
b. What is the conditional relative frequency distribution of belief for for conservatives?
c. If you wanted to show the association between political affiliation and feelings toward medical use of embryonic stem cells, what kind of graph would you make? (Just name it.)
d. Is there evidence of an association between political affiliation and feelings toward medical use of embryonic stem cells? Explain briefly.
a. What percent of the moderates said it is morally acceptable?
b. What is the conditional relative frequency distribution of belief for for conservatives?
c. If you wanted to show the association between political affiliation and feelings toward medical use of embryonic stem cells, what kind of graph would you make? (Just name it.)
d. Is there evidence of an association between political affiliation and feelings toward medical use of embryonic stem cells? Explain briefly.
فتح الحزمة
افتح القفل للوصول البطاقات البالغ عددها 115 في هذه المجموعة.
فتح الحزمة
k this deck
46
In order to plan transportation and parking needs at a private high school, administrators asked students how they get to school. Some rode a school bus, some rode in with parents or friends, and others used "personal" transportation - bikes, skateboards, or just walked. The table summarizes the responses from boys and girls.
-Do you think mode of transportation is independent of gender? Give statistical evidence to support your conclusion.
-Do you think mode of transportation is independent of gender? Give statistical evidence to support your conclusion.
فتح الحزمة
افتح القفل للوصول البطاقات البالغ عددها 115 في هذه المجموعة.
فتح الحزمة
k this deck
47
The boxplots show prices of used cars (in thousands of dollars) advertised for sale at three different car dealers.
a. Which dealer offers the cheapest car offered, and at what price? b. Which dealer has the lowest median price, and how much is it? c. Which dealer has the smallest price range, and what is it?
d. Which dealer's prices have the smallest IQR, and what is it?
e. Which dealer generally sells cars cheapest? Explain.
فتح الحزمة
افتح القفل للوصول البطاقات البالغ عددها 115 في هذه المجموعة.
فتح الحزمة
k this deck
48
A survey conducted in a college intro stats class asked students about the number of credit hours they were taking that quarter. The number of credit hours for a random sample of 16 students is given in the table.
a. Sketch a histogram of these data.
b. Find the mean and standard deviation for the number of credit hours. c. Find the median and IQR for the number of credit hours.
d. Is it more appropriate to use the mean and standard deviation or the median and IQR to summarize these data? Explain.
a. Sketch a histogram of these data.
b. Find the mean and standard deviation for the number of credit hours. c. Find the median and IQR for the number of credit hours.
d. Is it more appropriate to use the mean and standard deviation or the median and IQR to summarize these data? Explain.
فتح الحزمة
افتح القفل للوصول البطاقات البالغ عددها 115 في هذه المجموعة.
فتح الحزمة
k this deck
49
Commuting to work The table shows how a company's employees commute to work.
a. What is the marginal distribution (in %) of mode of transportation? Car Bus _ Train
b. What is the conditional distribution (in %) of mode of transportation for management? Car Bus Train
c. What kind of display would you use to show the association between job class and mode of transportation? (Just name a graph.)
d. Do job classification and mode of transportation appear to be independent? Give statistical evidence to support your conclusion.
فتح الحزمة
افتح القفل للوصول البطاقات البالغ عددها 115 في هذه المجموعة.
فتح الحزمة
k this deck
50
Auto insurance The Insurance Institute for Highway Safety publishes ratings for all models of vehicles to compare the relative risk of payouts. 100 is the mean rating for all vehicles. A rating of 122 means the vehicle is 22% worse than average. The table shows the summary statistics for the collision ratings of 27 midsize cars.
a. Were any of the ratings outliers? Show how you made your decision.
b. A histogram of the data is shown. Is it more appropriate to use the mean and standard
deviation, or the median and IQR to describe these data? Explain.
a. Were any of the ratings outliers? Show how you made your decision.
b. A histogram of the data is shown. Is it more appropriate to use the mean and standard
deviation, or the median and IQR to describe these data? Explain.
فتح الحزمة
افتح القفل للوصول البطاقات البالغ عددها 115 في هذه المجموعة.
فتح الحزمة
k this deck
51
City planners wanted to know how many people live in a typical housing unit so they compiled data from hundreds of forms that had been submitted in various city offices. Summary statistics are shown in the table.
a. Notice that the minimum occupancy and the first quartile are the same. Explain how this can be.
b. The city classifies residences housing 4 or more people as "high occupancy". Would you consider 4 occupants to be unusually high? Explain.
c. The city bases their garbage disposal fee on the occupancy level of the home or apartment. The annual fee is $40 plus $5 per person, so a single occupant pays $45 and the homes with 10 people pay $40 +$5(10) = $90 a year. What is the median fee paid? And the IQR?
d. What are the mean and standard deviation of the garbage disposal fees?
فتح الحزمة
افتح القفل للوصول البطاقات البالغ عددها 115 في هذه المجموعة.
فتح الحزمة
k this deck
52
During a budget meeting, local school board members decided to review class size information to
determine if budgets were correct. Summary statistics are shown in the table.
a. Notice that the third quartile and maximum class sizes are the same. Explain how this can be.
b. The school district declares that classes with fewer than 20 students are "too small". Would you consider a class of 20 students to be unusually small? Explain.
c. The school district sets the office supply budgets of their high schools on the enrollment of students. The district budgets each class $12 plus $0.75 per student, so a class with one student receives $12.75 and the classes with 40 students receive 12 + 0.75(40) = $42. What is the median class budget for office supplies? And the IQR?
d. What are the mean and standard deviation of the class office supply budgets?
فتح الحزمة
افتح القفل للوصول البطاقات البالغ عددها 115 في هذه المجموعة.
فتح الحزمة
k this deck
53
At a large business, employees must report to work at 7:30 A.M. The arrival times of employees can be described by a Normal model with mean of 7:22 A.M. and a standard deviation of four minutes.
a. What percent of employees are late on a typical work day?
b. A psychological study determined that the typical worker needs five minutes to adjust to their surroundings before beginning their duties. What percent of this business' employees arrive early enough to make this adjustment?
c. Because late employees are a distraction and cost companies money, all employees need to be on time to work. If the mean arrival time of employees does not change, what standard deviation would the arrival times need to ensure virtually all employees are on time to work?
d. Explain what achieving a smaller standard deviation means in the context of this problem.
فتح الحزمة
افتح القفل للوصول البطاقات البالغ عددها 115 في هذه المجموعة.
فتح الحزمة
k this deck
54
In July 2013, the Federal Drug Administration approved a new version of a drug used to treat opium dependence. The old version of the drug had received complaints about a bitter taste, an aftertaste, and that it took a long time to dissolve. The goal of the new version was to get more patients to take the drug as prescribed by addressing these issues. In addition to these improvements, experimenters monitored the existence and types of side effects of the drug.
-Describe the W's, if the information is given:
· Who:
· What:
· When:
· Where:
· How:
· Why:
-Describe the W's, if the information is given:
· Who:
· What:
· When:
· Where:
· How:
· Why:
فتح الحزمة
افتح القفل للوصول البطاقات البالغ عددها 115 في هذه المجموعة.
فتح الحزمة
k this deck
55
A research company frequently monitors trends in the use of social media by American Adults. The results of one survey of 1846 randomly selected adults looked at social media use versus age group. The table summarizes the survey results.
-What is the marginal distribution of age groups?
-What is the marginal distribution of age groups?
فتح الحزمة
افتح القفل للوصول البطاقات البالغ عددها 115 في هذه المجموعة.
فتح الحزمة
k this deck
56
Cellphones ConsumerReports.org evaluated the price and performance of 99 models of cellphones. Computer output gives these summaries for the prices:
a. Were any of the prices outliers? Explain how you made your decision.
b. One of the manufacturers advertises a cellphone "economy-priced at only $31.95". Would you consider that to be a very low price? Explain.
a. Were any of the prices outliers? Explain how you made your decision.
b. One of the manufacturers advertises a cellphone "economy-priced at only $31.95". Would you consider that to be a very low price? Explain.
فتح الحزمة
افتح القفل للوصول البطاقات البالغ عددها 115 في هذه المجموعة.
فتح الحزمة
k this deck
57
Copy machines A manufacturer claims that lifespans for their copy machines (in months)can be described by a Normal model N(42, 7). Show your work.
a. Draw and clearly label the model.
b. A company with several large office buildings buys 200 of these copiers. The salesman tells the boss "190 (95%) of your new copiers will last between and months." Comment on this claim.
c. What is the 3rd quartile of copier lifespans?
d. What percent of the copiers are expected to fail before 36 months?
e. The manufacturer wants to reduce the 36-month failure rate to only 10%. Assuming the mean lifespan will stay the same, what standard deviation must they achieve?
f. Briefly explain what that change in standard deviation means in this context.
g. A competing manufacturer says that not only will 90% of their copiers last at least 36 months, 65% will last at least 42 months. What Normal model parameters is that manufacturer claiming? Show your work. N( , )
a. Draw and clearly label the model.
b. A company with several large office buildings buys 200 of these copiers. The salesman tells the boss "190 (95%) of your new copiers will last between and months." Comment on this claim.
c. What is the 3rd quartile of copier lifespans?
d. What percent of the copiers are expected to fail before 36 months?
e. The manufacturer wants to reduce the 36-month failure rate to only 10%. Assuming the mean lifespan will stay the same, what standard deviation must they achieve?
f. Briefly explain what that change in standard deviation means in this context.
g. A competing manufacturer says that not only will 90% of their copiers last at least 36 months, 65% will last at least 42 months. What Normal model parameters is that manufacturer claiming? Show your work. N( , )
فتح الحزمة
افتح القفل للوصول البطاقات البالغ عددها 115 في هذه المجموعة.
فتح الحزمة
k this deck
58
A research company frequently monitors trends in the use of social media by American Adults. The results of one survey of 1846 randomly selected adults looked at social media use versus age group. The table summarizes the survey results.
-Write a sentence or two about the conditional relative frequency distribution of ages of social media users.
-Write a sentence or two about the conditional relative frequency distribution of ages of social media users.
فتح الحزمة
افتح القفل للوصول البطاقات البالغ عددها 115 في هذه المجموعة.
فتح الحزمة
k this deck
59
The body temperature of students is taken each time a student goes to the nurse's office.
The five-number summary for the temperatures (in degrees Fahrenheit) of students on a particular day is:
a. Would you expect the mean temperature of all students who visited the nurse's office to be higher or lower than the median? Explain.
b. After the data were picked up in the afternoon, three more students visited the nurse's office with temperatures of 96.7°, 98.4°, and 99.2°. Were any of these students outliers? Explain.
فتح الحزمة
افتح القفل للوصول البطاقات البالغ عددها 115 في هذه المجموعة.
فتح الحزمة
k this deck
60
A company's manufacturing process uses 500 gallons of water at a time. A "scrubbing" machine then removes most of a chemical pollutant before pumping the water into a nearby lake. Legally the treated water should contain no more than 80 parts per million of the chemical, but the machine isn't perfect and it is costly to operate. Since there's a fine if the discharged water exceeds the legal maximum, the company sets the machine to attain an average of 75 ppm for the batches of water treated. They believe the machine's output can be described by a Normal model with standard deviation 4.2 ppm. (SHOW WORK.)
a. What percent of the batches of water discharged exceed the 80ppm standard?
b. The company's lawyers insist that they have not more than 2% of the water over the
limit. To what mean value should the company set the scrubbing machine? Assume the standard deviation does not change.
c. Because achieving a mean that low would raise the costs too much, they decide to leave the mean set at 75 ppm and try to reduce the standard deviation to achieve the "only 2% over" goal. Find the new standard deviation needed.
d. Explain what achieving a smaller standard deviation means in this context.
فتح الحزمة
افتح القفل للوصول البطاقات البالغ عددها 115 في هذه المجموعة.
فتح الحزمة
k this deck
61
A research company frequently monitors trends in the use of social media by American Adults. The results of one survey of 1846 randomly selected adults looked at social media use versus age group. The table summarizes the survey results.
-Identify the variables and tell whether each is categorical or quantitative.
-Identify the variables and tell whether each is categorical or quantitative.
فتح الحزمة
افتح القفل للوصول البطاقات البالغ عددها 115 في هذه المجموعة.
فتح الحزمة
k this deck
62
A brake and muffler shop reported the repair bills, in dollars, for their customers yesterday.
a. Sketch a histogram for these data.
b. Find the mean and standard deviation of the repair costs.
c. Is it appropriate to use the mean and standard deviation to summarize these data?Explain.
d. Describe the distribution of repair costs.
a. Sketch a histogram for these data.
b. Find the mean and standard deviation of the repair costs.
c. Is it appropriate to use the mean and standard deviation to summarize these data?Explain.
d. Describe the distribution of repair costs.
فتح الحزمة
افتح القفل للوصول البطاقات البالغ عددها 115 في هذه المجموعة.
فتح الحزمة
k this deck
63
The five-number summary for the weights (in pounds) of fish caught in a bass tournament is:
a. Would you expect the mean weight of all fish caught to be higher or lower than the median? Explain.
b. You caught 3 bass weighing 2.3 pounds, 3.9 pounds, and 4.2 pounds. Were any of your fish outliers? Explain.
a. Would you expect the mean weight of all fish caught to be higher or lower than the median? Explain.
b. You caught 3 bass weighing 2.3 pounds, 3.9 pounds, and 4.2 pounds. Were any of your fish outliers? Explain.
فتح الحزمة
افتح القفل للوصول البطاقات البالغ عددها 115 في هذه المجموعة.
فتح الحزمة
k this deck
64
A statistics teacher gave her class a 15 point quiz. The summary statistics for the students'scores are shown in the table at the right.
a. Notice that the median score and the third quartile are the same. Explain how this can be.
b. One student's parent heaped praise on him for scoring 13, saying it was an amazing score. Comment on whether that praise is deserved using the summary statistics as support.
c. To convert these raw scores to a score out of 100, the teacher multiplies each score by six,then adds 10. (We can debate the wisdom of such a strategy later!). What is the median converted score? And the IQR?
d. What are the mean and standard deviation of the converted test scores?
فتح الحزمة
افتح القفل للوصول البطاقات البالغ عددها 115 في هذه المجموعة.
فتح الحزمة
k this deck
65
The students in a biology class kept a record of the height (in centimeters) of plants for a class experiment.
a. Sketch a histogram for these data.
b. Find the mean and standard deviation of the plant heights.
c. Is it appropriate to use the mean and standard deviation to summarize these data? Explain.
d. Describe the distribution of plant heights.
a. Sketch a histogram for these data.
b. Find the mean and standard deviation of the plant heights.
c. Is it appropriate to use the mean and standard deviation to summarize these data? Explain.
d. Describe the distribution of plant heights.
فتح الحزمة
افتح القفل للوصول البطاقات البالغ عددها 115 في هذه المجموعة.
فتح الحزمة
k this deck
66
Which of the W's are unknown for these data?
فتح الحزمة
افتح القفل للوصول البطاقات البالغ عددها 115 في هذه المجموعة.
فتح الحزمة
k this deck
67
In November 2003 Discover published an article on the colonies of ants. They reported some basic information about many species of ants and the results of some discoveries found by myrmecologist Walter Tschinkel of the University of Florida. Information included the scientific name of the ant species, the geographic location, the depth of the nest (in feet), the number of chambers in the nest, and the number of ants in the colony. The article documented how new ant colonies begin, the ant-nest design, and how nests differ in shape, number, size of chambers, and how they are connected, depending on the species. It reported that nest designs include vertical, horizontal, or inclined tunnels for movement and transport of food and ants.
-Describe the W's, if the information is given:
· Who:
· What:
· When:
· Where:
· How:
· Why:
-Describe the W's, if the information is given:
· Who:
· What:
· When:
· Where:
· How:
· Why:
فتح الحزمة
افتح القفل للوصول البطاقات البالغ عددها 115 في هذه المجموعة.
فتح الحزمة
k this deck
68
Cats and dogs The table shows whether students in an introductory statistics class like dogs and/or cats.
a. What is the marginal distribution (in %) of "liking dogs"?
b. What is the conditional distribution (in %) of "liking dogs" for students who like cats?
c. What kind of display(s) would you use to examine the association between "liking dogs"and "liking cats"? (Just name a graph.)
d. Do "liking dogs" and "liking cats" appear to be independent? Give statistical evidence to support your conclusion.
فتح الحزمة
افتح القفل للوصول البطاقات البالغ عددها 115 في هذه المجموعة.
فتح الحزمة
k this deck
69
Students taking an intro stats class reported the number of credit hours that they were taking that quarter.Summary statistics are shown in the table.
a. Suppose that the college charges $73 per credit hour plus a flat student fee of $35 per quarter. For example, a student taking 12 credit hours would pay $35 + $73(12) = $911 for that quarter.
i. What is the mean fee paid?
ii. What is the standard deviation for the fees paid?
iii. What is the median fee paid?
iv. What is the IQR for the fees paid?
b. Twenty-eight credit hours seems like a lot. Would you consider 28 credit hours to be unusually high? Explain.
فتح الحزمة
افتح القفل للوصول البطاقات البالغ عددها 115 في هذه المجموعة.
فتح الحزمة
k this deck
70
To determine if people's preference in dogs had changed in the recent years, organizers of a local dog show asked people who attended the show to indicate which breed was their favorite. This information was compiled by dog breed and gender of the people who responded. The table summarizes the responses.
-Do you think the breed selection is independent of gender? Give statistical evidence to support your conclusion.
-Do you think the breed selection is independent of gender? Give statistical evidence to support your conclusion.
فتح الحزمة
افتح القفل للوصول البطاقات البالغ عددها 115 في هذه المجموعة.
فتح الحزمة
k this deck
71
The boxplots show the age of people involved in accidents according to their role in the accident.
a. Which role involved the youngest person, and what is the age?
b. Which role had the lowest median age, and what is the age?
c. Which role had smallest range of ages, and what is it?
d. Which role had the largest IQR of ages, and what is it?
e. Which role generally involved the oldest people? Explain.
فتح الحزمة
افتح القفل للوصول البطاقات البالغ عددها 115 في هذه المجموعة.
فتح الحزمة
k this deck
72
Soda cans A machine that fills cans with soda fills according to a Normal model with mean
12.1 ounces and standard deviation 0.05 ounces.
a. If the cans claim to have 12 ounces of soda each, what percent of cans are under-filled?
b. Management wants to ensure that only 1% of cans are under-filled.
i. Scenario 1: If the mean fill of the cans remains at 12.1 ounces, what standard deviation does the filling machine need to have to achieve this goal?
ii. Scenario 2: If the standard deviation is to remain at 0.05 ounces, what mean does the filling machine need to have to achieve this goal?
فتح الحزمة
افتح القفل للوصول البطاقات البالغ عددها 115 في هذه المجموعة.
فتح الحزمة
k this deck
73
Suppose that the student taking 22 credit hours in the data set in the previous question was actually taking 28 credit hours instead of 22 (so we would replace the 22 in the data set
with 28). Indicate whether changing the number of credit hours for that student would make each of the following summary statistics increase, decrease, or stay about the same:
a. mean
b. median
c. range d. IQR
e. standard deviation
with 28). Indicate whether changing the number of credit hours for that student would make each of the following summary statistics increase, decrease, or stay about the same:
a. mean
b. median
c. range d. IQR
e. standard deviation
فتح الحزمة
افتح القفل للوصول البطاقات البالغ عددها 115 في هذه المجموعة.
فتح الحزمة
k this deck
74
There is a proposal to replace the shortest roller coaster above with one that has a length of 1,200 ft. Indicate whether changing that roller coaster's length would make each of these summary statistics increase, decrease, or stay about the same.
a. mean
b. median
c. range
d. IQR
e. standard deviation
a. mean
b. median
c. range
d. IQR
e. standard deviation
فتح الحزمة
افتح القفل للوصول البطاقات البالغ عددها 115 في هذه المجموعة.
فتح الحزمة
k this deck
75
The side-by-side boxplots show the cumulative college GPAs for sophomores, juniors, and seniors taking an intro stats course in Autumn 2003.
a. Which class (sophomore, junior, or senior) had the lowest cumulative college GPA? What is the approximate value of that GPA?
b. Which class had the highest median GPA, and what is that GPA?
c. Which class had the largest range for GPA, and what is it?
d. Which class had the most symmetric set of GPAs? The most skewed set of GPAs?
فتح الحزمة
افتح القفل للوصول البطاقات البالغ عددها 115 في هذه المجموعة.
فتح الحزمة
k this deck
76
The Postmaster of a city's Post Office believes that a Normal model is useful in projecting the number of letters which will be mailed during the day. They use a mean of 20,000 letters and a standard deviation of 250 letters. Draw and clearly label this model.
فتح الحزمة
افتح القفل للوصول البطاقات البالغ عددها 115 في هذه المجموعة.
فتح الحزمة
k this deck
77
While the scales histograms are the same, there is something that could be improved so that we could compare these two distributions better. Identify this improvement and explain why it would be better.
فتح الحزمة
افتح القفل للوصول البطاقات البالغ عددها 115 في هذه المجموعة.
فتح الحزمة
k this deck
78
Although most of us buy milk by the quart or gallon, farmers measure daily production in pounds. Guernsey cows average 39 pounds of milk a day with a standard deviation of 8 pounds. For Jerseys the mean daily production is 43 pounds with a standard deviation of 5 pounds. When being shown at a state fair a champion Guernsey and a champion Jersey each gave 54 pounds of milk. Which cow's milk production was more remarkable?
Explain.
Explain.
فتح الحزمة
افتح القفل للوصول البطاقات البالغ عددها 115 في هذه المجموعة.
فتح الحزمة
k this deck
79
A research company frequently monitors trends in the use of social media by American Adults. The results of one survey of 1846 randomly selected adults looked at social media use versus age group. The table summarizes the survey results.
-Do you think social media use is independent of age? Give statistical evidence to support your conclusion.
-Do you think social media use is independent of age? Give statistical evidence to support your conclusion.
فتح الحزمة
افتح القفل للوصول البطاقات البالغ عددها 115 في هذه المجموعة.
فتح الحزمة
k this deck
80
Hardwood mulch Hardwood mulch is sold by the cubic yard. (But they just call it 'yards' to be confusing.) One lawn and garden store has a truck that they say can carry up to 7 yards for delivery. (It can actually hold a bit more.) Of course, when they fill the truck they don't get exactly 7 yards of mulch. They weigh it to determine the actual amount for billing purposes. They charge $28 per yard for the mulch, plus $25 for delivery.
a. Shown are some summary statistics describing the distribution of the actual amounts of mulch in full loads. Fill in the table to include those statistics for the cost including delivery.
b. Your delivery is among this set of data, and it has a z-score of -0.84 for the distribution of yards of mulch. What is your z-score for the cost including delivery?
فتح الحزمة
افتح القفل للوصول البطاقات البالغ عددها 115 في هذه المجموعة.
فتح الحزمة
k this deck
فتح الحزمة
افتح القفل للوصول البطاقات البالغ عددها 115 في هذه المجموعة.


