Deck 6: The Human Population and Its Impact
ملء الشاشة (f)
سؤال
 Use the figure above to answer the following question(s).
At today's level of consumption,scientists estimate that we would need the equivalent of ____ planet Earths to sustain our use of resources in 2050.
A) 1.0
B) 1.1
C) 1.2
D) 1.3
E) 2.0
سؤال
سؤال
Use the figure above to answer the following question(s).What concept describes the maximum number of people who can live in reasonable comfort and freedom indefinitely?
A) optimization strategy
B) genetic optimization
C) stabilization theorem
D) nil hypothesis
E) cultural carrying capacity
سؤال
Use the figure above to answer the following question(s).Worldwide,how many children under one year of age die each day of preventable causes?
A) 500
B) 1,000
C) 3,000
D) 5,500
E) 11,000
سؤال
Use the figure above to answer the following question(s).The replacement-level fertility rate is ____ for developed countries and ____ for developing countries.
A) 1.6;1.9
B) 2.5;2.0
C) 2.0;2.5
D) 2.1;2.5
E) 1.8;2.1
سؤال
Use the figure above to answer the following question(s).The U.S.population is ____.
A) close to leveling off
B) slowly declining
C) basically stable
D) rapidly declining
E) rapidly growing
سؤال
Use the figure above to answer the following question(s).Which factor is more likely to increase the likelihood of a couple having a child (rather than decrease the likelihood)?
A) need for child to be part of the labor force
B) religious beliefs
C) cost of child's education
D) lack of a pension system
E) employment opportunities for women
سؤال
Use the figure above to answer the following question(s).Currently,how many people on the earth do not have their basic needs met?
A) one out of every two people
B) one out of every three people
C) one out of every five people
D) one out of every ten people
E) one out of every fifteen people
سؤال
Use the figure above to answer the following question(s).About ____% of the children born in 2012 were an addition to the world's more developed countries.
A) 2
B) 5
C) 10
D) 15
E) 20
سؤال
Use the figure above to answer the following question(s).If every woman on the earth had no more than an average of 2.1 children during their reproductive years,the human population would continue to rise for how long?
A) 5,000 years
B) 150 years
C) 50 years
D) 20 years
E) 5 years
سؤال
Use the figure above to answer the following question(s).What circumstance would decrease the likelihood of a couple having a child?
A) The use of children as an essential part of the family labor force
B) Lack of contraceptive availability
C) Opportunities for women to participate in education and employment
D) The lack of a public or private pension system
E) High infant mortality rates
سؤال
Use the figure above to answer the following question(s).According to recent research,how many environmental refugees were there in the year 2008?
A) 100,000
B) 1,000,000
C) 5,000,000
D) 25,000,000
E) 40,000,000
سؤال
Use the figure above to answer the following question(s).Since 1955,the global life expectancy has risen to ____.
A) 48 years
B) 52 years
C) 70 years
D) 72 years
E) 78 years
سؤال
Use the figure above to answer the following question(s).Currently,legal and illegal immigration account for approximately how much of the U.S.annual population growth?
A) 100%
B) 30%
C) 63%
D) 24%
E) 15%
سؤال
Use the figure above to answer the following question(s).Which factor below is least likely to affect birth and fertility rates today?
A) number of people 60 or older
B) cost of raising and educating children
C) religious beliefs
D) educational and employment opportunities for women
E) average age at marriage
سؤال
Use the figure above to answer the following question(s).Infant mortality rate refers to the number of children per 1,000 births that die ____.
A) by their fifth birthday
B) before their first birthday
C) before six months
D) in their first month
E) at birth
سؤال
Use the figure above to answer the following question(s).The exponential rate of growth of the total human population over the past 100 years has been a result of ____.
A) large birth rate increases
B) sharp drop in death rates
C) significant immigration
D) leveling off of death rates
E) fewer epidemics
سؤال
Use the figure above to answer the following question(s).The United States has one of the highest infant mortality rates of developed countries.What is the primary reason for this?
A) educational opportunities for women in the U.S.
B) delayed pregnancy until later in life
C) drug addiction among women
D) urbanization
E) increased childhood obesity
سؤال
Use the figure above to answer the following question(s).The 2012 U.S.population of 314 million is expected to reach what level by 2050?
A) 550 million
B) 500 million
C) 450 million
D) 400 million
E) 350 million
سؤال
Use the figure above to answer the following question(s).Two useful indicators of overall health in a country or region are ____.
A) birth rate and death rate
B) replacement-level fertility rate and total fertility rate
C) life expectancy and death rate
D) life expectancy and infant mortality rate
E) population growth rate and death rate
سؤال
Use the figure above to answer the following question(s).Ninety percent of Indian couples have access to modern birth control methods.What percentage actually use one?
A) 80%
B) 49%
C) 62%.
D) 10%
E) 31%
سؤال
Use the figure above to answer the following question(s).What shape in an age-structure chart would best illustrate the effects of the baby-boom in the United States in 2012?
A) classic pyramid
B) wide base that narrows rapidly
C) narrow base and wide top
D) stable base with a slight bulge near the top
E) stable base with a slight bulge near the bottom
سؤال
Use the figure above to answer the following question(s).About 2.3 million people were added to the U.S.population in 2012.What percentage of this increase was due to immigration?
A) 10%
B) 20%
C) 30%
D) 40%
E) 50%
سؤال
Use the figure above to answer the following question(s).Which country had the world's longest life expectancy in 2012?
A) U.S.
B) Sweden
C) Germany
D) Japan
E) Denmark
سؤال
Use the figure above to answer the following question(s).The U.S.total fertility rate has remained at or below replacement rate since what year?
A) 1942
B) 1952
C) 1962
D) 1972
E) 1982
سؤال
Use the figure above to answer the following question(s).The text suggests that one key demographic statistic is the percentage of people in a region that are under 15 years of age.Why is this statistic important?
A) Young people buy lots of goods and services.
B) Young people will be the leaders of the future.
C) Young people will feel the effects of global warming.
D) Young people are reckless and impulsive.
E) Young people are poised to move into their prime reproductive years.
سؤال
Use the figure above to answer the following question(s).Environmental refugees typically migrate to ____.
A) seek jobs
B) avoid religious persecution
C) escape water or food shortages
D) join family
E) seek educational opportunities
سؤال
Use the figure above to answer the following question(s).Between 1955 and 2012,the global total fertility rate (TFR)dropped from in less-developed countries from 5 to what level?
A) 4.5
B) 3.6
C) 2.4
D) 2.1
E) 1.8
سؤال
Use the figure above to answer the following question(s).The total fertility rate is the ____.
A) number of children born to a woman during her lifetime
B) number of children a couple must bear to replace themselves
C) average number of children born to women in their reproductive years
D) number of live births per 1000 people
E) births and immigrations into a population
سؤال
Use the figure above to answer the following question(s).Worldwide,AIDS is the leading cause of death for people _____ years of age.
A) 1-4
B) 5-14
C) 15-49
D) 50-65
E) 66+
سؤال
Use the figure above to answer the following question(s).Demographers estimate the human population in 2050 to be between 7.8 and 10.8 billion - a range of three billion.Why is the estimated range so wide?
A) More-developed countries routinely inflate their estimates.
B) Projections are made by a variety of organizations.
C) Fertility rates are calculated with a standard formula by country.
D) Ranges include maximum and minimum estimated casualties of war.
E) Statistics regarding drought and famine are constantly shifting.
سؤال
Use the figure above to answer the following question(s).The crude birth rate is the number of live births per ____ persons in a given year.
A) 50
B) 100
C) 500
D) 1,000
E) 100,000
سؤال
Use the figure above to answer the following question(s).An age structure diagram plots the number or percentage of ____.
A) reproductive age females
B) reproductive age males and females
C) non-reproductive age males and females
D) economic status of reproductive males and females
E) males and females among age groups in a population
سؤال
Use the figure above to answer the following question(s).Members of the baby-boom generation make up ____% of all adult Americans.
A) 6
B) 16
C) 26
D) 36
E) 46
سؤال
Use the figure above to answer the following question(s).Rapid population decline is least likely to result in ____.
A) less government revenues with fewer workers
B) less new business formation
C) increased pensions and lowered retirement age
D) less likelihood for new technology development
E) increasing public deficits
سؤال
Use the figure above to answer the following question(s).A high incidence of AIDS in a country is least likely to result in a(n)____.
A) loss of productive young workers
B) increase of orphaned children
C) increase in life expectancy
D) loss of working adults to support the elderly
E) reduction of skilled workers
سؤال
Use the figure above to answer the following question(s).Rapidly growing countries have an age structure diagram that ____.
A) forms an inverted pyramid
B) has a broad-based pyramid
C) shows little variation in population by age
D) has a small pre-reproductive population
E) has a large post reproductive population
سؤال
Use the figure above to answer the following question(s).Which country is currently facing a declining population?
A) Germany
B) United States
C) Australia
D) Nigeria
E) Saudi Arabia
سؤال
Use the figure above to answer the following question(s).A country with a TFR that falls below 1.5 children per couple for a prolonged period will experience all of the following except ____.
A) a sharp rise in proportion of older people
B) an increasing demand on medical care
C) an increasing demand on social security funds or its equivalent
D) labor shortages
E) an increasing number of working taxpayers.
سؤال
Use the figure above to answer the following question(s).Countries that have reached zero population growth have an age structure diagram that ____.
A) forms an inverted pyramid
B) forms a broad-based pyramid
C) has little variation in prereproductive and reproductive age groups
D) has a large pre-reproductive population
E) has a large reproductive population
سؤال
Use the figure above to answer the following question(s).More than half of the world's population now lives in urban areas.
سؤال
Use the figure above to answer the following question(s).The UN Population Fund indicates that less than 20% of all pregnancies in less-developed countries are unplanned,while 10% end with abortion.
سؤال
Use the figure above to answer the following question(s).Which statement about India's resource and environmental problems is false?
A) India has 18% of world's people,but only 2.3 % of world's land resources.
B) About one-half of India's cropland is degraded.
C) About two-thirds of its water is seriously polluted.
D) India has about 15% of the world's forests.
E) Sanitation services are often inadequate.
سؤال
Use the figure above to answer the following question(s).Between 1972 and 2012,the average number of children born to a woman in China declined from 5.7 to 1.5.
سؤال
Use the figure above to answer the following question(s).In 2012,more than one-third of the global population lived in China or India.
سؤال
Use the figure above to answer the following question(s).The world's first national ____ program began in India in 1952.
A) family planning
B) economic transition
C) literacy
D) sterilization
E) urbanization
سؤال
Use the figure above to answer the following question(s).According to the demographic transition model,what trend is true of countries in Stage 2: Transitional?
A) Death rates drop,followed by birth rates.
B) Birth rates drop,followed by death rates.
C) Birth and death rates rise at the same time.
D) Birth and death rates fall at the same time.
E) Total population begins to fall
سؤال
Use the figure above to answer the following question(s).The average number of children born to a woman in China in 2012 is less than the number born to a woman in the United States.
سؤال
Use the figure above to answer the following question(s).Women are least likely to have fewer and healthier children when ____.
A) their individual rights are protected
B) they earn an income of their own
C) they have access to education
D) they control their own fertility
E) they marry at a young age
سؤال
Use the figure above to answer the following question(s).Reaching the replacement-level fertility rate means a quick halt to population growth.
سؤال
Use the figure above to answer the following question(s).In the demographic transition model,death rates fall while birth rates remain high ____.
A) during the preindustrial stage
B) during the industrial stage
C) during the postindustrial stage
D) during the transitional stage
E) following the postindustrial stage
سؤال
Use the figure above to answer the following question(s).Which stage does not belong in the demographic transition model?
A) preindustrial
B) industrial
C) pre-transitional
D) transitional
E) postindustrial
سؤال
Use the figure above to answer the following question(s).Infant mortality rate is one of the best measures of a society's quality of life.
سؤال
Use the figure above to answer the following question(s).In developing countries,demographic transition is least likely to be hindered by ____.
A) environmental degradation
B) extreme poverty
C) resource depletion
D) a drop in economic assistance from developed countries
E) an increase in education opportunities for women
سؤال
Use the figure above to answer the following question(s).Which statement about India is false?
A) Twenty-five percent of people in cities live in slums.
B) India has the fourth largest economy.
C) Eighty percent of rural people have adequate sanitation.
D) Nearly one-half of the people are unemployed or underemployed.
E) Forty percent of the population suffers from extreme poverty.
سؤال
Use the figure above to answer the following question(s).About 70% of the growth in the U.S.population in 2012 resulted from births outnumbering deaths.
سؤال
Use the figure above to answer the following question(s).Which statement about China is false?
A) Between 1972 and 2012,China cut its birth rate in half.
B) China's population is expanding slowly.
C) Eighty-five percent of Chinese couples use some form of birth control.
D) China has very few critical resource and environmental problems.
E) India's population will exceed China's by 2030.
سؤال
Use the figure above to answer the following question(s).Which statistic is not true of women globally?
A) Women have more children if they are educated.
B) Women account for 66% of all hours worked but receive only 10% of world's income.
C) Women own less than 2% of the world's land.
D) Women make up 70% of the world's poor.
E) Women represent 66% of the world's illiterate adults.
سؤال
Use the figure above to answer the following question(s).The population of the United States has stopped growing.
سؤال
Use the figure above to answer the following question(s).In African countries,where 15-26% of the adult population is infected with HIV,life expectancy is expected to drop sharply.
سؤال
Use the figure above to answer the following question(s).Family planning reduces the number of legal and illegal abortions performed each year,and stabilizes the populations.
سؤال
سؤال
Use the figure above to answer the following question(s).Worldwide,the number of school-age girls who do not attend elementary school is more than three times the population of the United States.
سؤال
Use the figure above to answer the following question(s).Globally,women own 40% of the world's land.
سؤال
سؤال
Use the figure above to answer the following question(s).The ____________________ is the number of live births per 1,000 people in a population in a given year.
سؤال
سؤال
سؤال
Use the figure above to answer the following question(s).The rapid growth of the world's population over the past 100 years is primarily the result of a(n)____________________ in the crude ____________________.
سؤال
Use the figure above to answer the following question(s).Worldwide,900 million girls do not attend elementary school.
سؤال
Use the figure above to answer the following question(s).The maximum number people that can be supported by the planet's resources indefinitely is called the ___________________.
سؤال
Use the figure above to answer the following question(s).Family planning is responsible for a majority (55%)of the drop in total fertility rates (TFRs)in less-developed countries..
سؤال
 Use the Figure above to answer the following question(s).
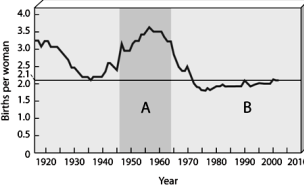
Since 1900,the ____________________ represents the period characterized by the lowest number of immigrants to the U.S.
سؤال
Use the figure above to answer the following question(s).The U.S.generation born between 1946 and 1964 is known as the _______________ generation.
سؤال
سؤال
سؤال
Use the figure above to answer the following question(s).The ____________________ is the number of deaths per 1,000 people in a population in a given year.
سؤال
Use the figure above to answer the following question(s).The United States ranks _______________ in the world in terms of infant mortality rates.
سؤال
Use the Figure above to answer the following question(s).The straight line running through the accompanying graph from left to right represents ____________________.
سؤال

فتح الحزمة
قم بالتسجيل لفتح البطاقات في هذه المجموعة!
Unlock Deck
Unlock Deck
1/89
العب
ملء الشاشة (f)
Deck 6: The Human Population and Its Impact
1
Use the figure above to answer the following question(s).At today's level of consumption,scientists estimate that we would need the equivalent of ____ planet Earths to sustain our use of resources in 2050.
A) 1.0
B) 1.1
C) 1.2
D) 1.3
E) 2.0
E
2
Population change is calculated using which of the following formulas?
A) (deaths + emigration)- (births + immigration)
B) (births + immigration)-(deaths + emigration)
C) (deaths + immigration)-(births + emigration)
D) (births + emigration)-(deaths + immigration)
E) (births + deaths)-(immigration + emigration)
A) (deaths + emigration)- (births + immigration)
B) (births + immigration)-(deaths + emigration)
C) (deaths + immigration)-(births + emigration)
D) (births + emigration)-(deaths + immigration)
E) (births + deaths)-(immigration + emigration)
(births + immigration)-(deaths + emigration)
3
Use the figure above to answer the following question(s).What concept describes the maximum number of people who can live in reasonable comfort and freedom indefinitely?
A) optimization strategy
B) genetic optimization
C) stabilization theorem
D) nil hypothesis
E) cultural carrying capacity
E
4
Use the figure above to answer the following question(s).Worldwide,how many children under one year of age die each day of preventable causes?
A) 500
B) 1,000
C) 3,000
D) 5,500
E) 11,000
فتح الحزمة
افتح القفل للوصول البطاقات البالغ عددها 89 في هذه المجموعة.
فتح الحزمة
k this deck
5
Use the figure above to answer the following question(s).The replacement-level fertility rate is ____ for developed countries and ____ for developing countries.
A) 1.6;1.9
B) 2.5;2.0
C) 2.0;2.5
D) 2.1;2.5
E) 1.8;2.1
فتح الحزمة
افتح القفل للوصول البطاقات البالغ عددها 89 في هذه المجموعة.
فتح الحزمة
k this deck
6
Use the figure above to answer the following question(s).The U.S.population is ____.
A) close to leveling off
B) slowly declining
C) basically stable
D) rapidly declining
E) rapidly growing
فتح الحزمة
افتح القفل للوصول البطاقات البالغ عددها 89 في هذه المجموعة.
فتح الحزمة
k this deck
7
Use the figure above to answer the following question(s).Which factor is more likely to increase the likelihood of a couple having a child (rather than decrease the likelihood)?
A) need for child to be part of the labor force
B) religious beliefs
C) cost of child's education
D) lack of a pension system
E) employment opportunities for women
فتح الحزمة
افتح القفل للوصول البطاقات البالغ عددها 89 في هذه المجموعة.
فتح الحزمة
k this deck
8
Use the figure above to answer the following question(s).Currently,how many people on the earth do not have their basic needs met?
A) one out of every two people
B) one out of every three people
C) one out of every five people
D) one out of every ten people
E) one out of every fifteen people
فتح الحزمة
افتح القفل للوصول البطاقات البالغ عددها 89 في هذه المجموعة.
فتح الحزمة
k this deck
9
Use the figure above to answer the following question(s).About ____% of the children born in 2012 were an addition to the world's more developed countries.
A) 2
B) 5
C) 10
D) 15
E) 20
فتح الحزمة
افتح القفل للوصول البطاقات البالغ عددها 89 في هذه المجموعة.
فتح الحزمة
k this deck
10
Use the figure above to answer the following question(s).If every woman on the earth had no more than an average of 2.1 children during their reproductive years,the human population would continue to rise for how long?
A) 5,000 years
B) 150 years
C) 50 years
D) 20 years
E) 5 years
فتح الحزمة
افتح القفل للوصول البطاقات البالغ عددها 89 في هذه المجموعة.
فتح الحزمة
k this deck
11
Use the figure above to answer the following question(s).What circumstance would decrease the likelihood of a couple having a child?
A) The use of children as an essential part of the family labor force
B) Lack of contraceptive availability
C) Opportunities for women to participate in education and employment
D) The lack of a public or private pension system
E) High infant mortality rates
فتح الحزمة
افتح القفل للوصول البطاقات البالغ عددها 89 في هذه المجموعة.
فتح الحزمة
k this deck
12
Use the figure above to answer the following question(s).According to recent research,how many environmental refugees were there in the year 2008?
A) 100,000
B) 1,000,000
C) 5,000,000
D) 25,000,000
E) 40,000,000
فتح الحزمة
افتح القفل للوصول البطاقات البالغ عددها 89 في هذه المجموعة.
فتح الحزمة
k this deck
13
Use the figure above to answer the following question(s).Since 1955,the global life expectancy has risen to ____.
A) 48 years
B) 52 years
C) 70 years
D) 72 years
E) 78 years
فتح الحزمة
افتح القفل للوصول البطاقات البالغ عددها 89 في هذه المجموعة.
فتح الحزمة
k this deck
14
Use the figure above to answer the following question(s).Currently,legal and illegal immigration account for approximately how much of the U.S.annual population growth?
A) 100%
B) 30%
C) 63%
D) 24%
E) 15%
فتح الحزمة
افتح القفل للوصول البطاقات البالغ عددها 89 في هذه المجموعة.
فتح الحزمة
k this deck
15
Use the figure above to answer the following question(s).Which factor below is least likely to affect birth and fertility rates today?
A) number of people 60 or older
B) cost of raising and educating children
C) religious beliefs
D) educational and employment opportunities for women
E) average age at marriage
فتح الحزمة
افتح القفل للوصول البطاقات البالغ عددها 89 في هذه المجموعة.
فتح الحزمة
k this deck
16
Use the figure above to answer the following question(s).Infant mortality rate refers to the number of children per 1,000 births that die ____.
A) by their fifth birthday
B) before their first birthday
C) before six months
D) in their first month
E) at birth
فتح الحزمة
افتح القفل للوصول البطاقات البالغ عددها 89 في هذه المجموعة.
فتح الحزمة
k this deck
17
Use the figure above to answer the following question(s).The exponential rate of growth of the total human population over the past 100 years has been a result of ____.
A) large birth rate increases
B) sharp drop in death rates
C) significant immigration
D) leveling off of death rates
E) fewer epidemics
فتح الحزمة
افتح القفل للوصول البطاقات البالغ عددها 89 في هذه المجموعة.
فتح الحزمة
k this deck
18
Use the figure above to answer the following question(s).The United States has one of the highest infant mortality rates of developed countries.What is the primary reason for this?
A) educational opportunities for women in the U.S.
B) delayed pregnancy until later in life
C) drug addiction among women
D) urbanization
E) increased childhood obesity
فتح الحزمة
افتح القفل للوصول البطاقات البالغ عددها 89 في هذه المجموعة.
فتح الحزمة
k this deck
19
Use the figure above to answer the following question(s).The 2012 U.S.population of 314 million is expected to reach what level by 2050?
A) 550 million
B) 500 million
C) 450 million
D) 400 million
E) 350 million
فتح الحزمة
افتح القفل للوصول البطاقات البالغ عددها 89 في هذه المجموعة.
فتح الحزمة
k this deck
20
Use the figure above to answer the following question(s).Two useful indicators of overall health in a country or region are ____.
A) birth rate and death rate
B) replacement-level fertility rate and total fertility rate
C) life expectancy and death rate
D) life expectancy and infant mortality rate
E) population growth rate and death rate
فتح الحزمة
افتح القفل للوصول البطاقات البالغ عددها 89 في هذه المجموعة.
فتح الحزمة
k this deck
21
Use the figure above to answer the following question(s).Ninety percent of Indian couples have access to modern birth control methods.What percentage actually use one?
A) 80%
B) 49%
C) 62%.
D) 10%
E) 31%
فتح الحزمة
افتح القفل للوصول البطاقات البالغ عددها 89 في هذه المجموعة.
فتح الحزمة
k this deck
22
Use the figure above to answer the following question(s).What shape in an age-structure chart would best illustrate the effects of the baby-boom in the United States in 2012?
A) classic pyramid
B) wide base that narrows rapidly
C) narrow base and wide top
D) stable base with a slight bulge near the top
E) stable base with a slight bulge near the bottom
فتح الحزمة
افتح القفل للوصول البطاقات البالغ عددها 89 في هذه المجموعة.
فتح الحزمة
k this deck
23
Use the figure above to answer the following question(s).About 2.3 million people were added to the U.S.population in 2012.What percentage of this increase was due to immigration?
A) 10%
B) 20%
C) 30%
D) 40%
E) 50%
فتح الحزمة
افتح القفل للوصول البطاقات البالغ عددها 89 في هذه المجموعة.
فتح الحزمة
k this deck
24
Use the figure above to answer the following question(s).Which country had the world's longest life expectancy in 2012?
A) U.S.
B) Sweden
C) Germany
D) Japan
E) Denmark
فتح الحزمة
افتح القفل للوصول البطاقات البالغ عددها 89 في هذه المجموعة.
فتح الحزمة
k this deck
25
Use the figure above to answer the following question(s).The U.S.total fertility rate has remained at or below replacement rate since what year?
A) 1942
B) 1952
C) 1962
D) 1972
E) 1982
فتح الحزمة
افتح القفل للوصول البطاقات البالغ عددها 89 في هذه المجموعة.
فتح الحزمة
k this deck
26
Use the figure above to answer the following question(s).The text suggests that one key demographic statistic is the percentage of people in a region that are under 15 years of age.Why is this statistic important?
A) Young people buy lots of goods and services.
B) Young people will be the leaders of the future.
C) Young people will feel the effects of global warming.
D) Young people are reckless and impulsive.
E) Young people are poised to move into their prime reproductive years.
فتح الحزمة
افتح القفل للوصول البطاقات البالغ عددها 89 في هذه المجموعة.
فتح الحزمة
k this deck
27
Use the figure above to answer the following question(s).Environmental refugees typically migrate to ____.
A) seek jobs
B) avoid religious persecution
C) escape water or food shortages
D) join family
E) seek educational opportunities
فتح الحزمة
افتح القفل للوصول البطاقات البالغ عددها 89 في هذه المجموعة.
فتح الحزمة
k this deck
28
Use the figure above to answer the following question(s).Between 1955 and 2012,the global total fertility rate (TFR)dropped from in less-developed countries from 5 to what level?
A) 4.5
B) 3.6
C) 2.4
D) 2.1
E) 1.8
فتح الحزمة
افتح القفل للوصول البطاقات البالغ عددها 89 في هذه المجموعة.
فتح الحزمة
k this deck
29
Use the figure above to answer the following question(s).The total fertility rate is the ____.
A) number of children born to a woman during her lifetime
B) number of children a couple must bear to replace themselves
C) average number of children born to women in their reproductive years
D) number of live births per 1000 people
E) births and immigrations into a population
فتح الحزمة
افتح القفل للوصول البطاقات البالغ عددها 89 في هذه المجموعة.
فتح الحزمة
k this deck
30
Use the figure above to answer the following question(s).Worldwide,AIDS is the leading cause of death for people _____ years of age.
A) 1-4
B) 5-14
C) 15-49
D) 50-65
E) 66+
فتح الحزمة
افتح القفل للوصول البطاقات البالغ عددها 89 في هذه المجموعة.
فتح الحزمة
k this deck
31
Use the figure above to answer the following question(s).Demographers estimate the human population in 2050 to be between 7.8 and 10.8 billion - a range of three billion.Why is the estimated range so wide?
A) More-developed countries routinely inflate their estimates.
B) Projections are made by a variety of organizations.
C) Fertility rates are calculated with a standard formula by country.
D) Ranges include maximum and minimum estimated casualties of war.
E) Statistics regarding drought and famine are constantly shifting.
فتح الحزمة
افتح القفل للوصول البطاقات البالغ عددها 89 في هذه المجموعة.
فتح الحزمة
k this deck
32
Use the figure above to answer the following question(s).The crude birth rate is the number of live births per ____ persons in a given year.
A) 50
B) 100
C) 500
D) 1,000
E) 100,000
فتح الحزمة
افتح القفل للوصول البطاقات البالغ عددها 89 في هذه المجموعة.
فتح الحزمة
k this deck
33
Use the figure above to answer the following question(s).An age structure diagram plots the number or percentage of ____.
A) reproductive age females
B) reproductive age males and females
C) non-reproductive age males and females
D) economic status of reproductive males and females
E) males and females among age groups in a population
فتح الحزمة
افتح القفل للوصول البطاقات البالغ عددها 89 في هذه المجموعة.
فتح الحزمة
k this deck
34
Use the figure above to answer the following question(s).Members of the baby-boom generation make up ____% of all adult Americans.
A) 6
B) 16
C) 26
D) 36
E) 46
فتح الحزمة
افتح القفل للوصول البطاقات البالغ عددها 89 في هذه المجموعة.
فتح الحزمة
k this deck
35
Use the figure above to answer the following question(s).Rapid population decline is least likely to result in ____.
A) less government revenues with fewer workers
B) less new business formation
C) increased pensions and lowered retirement age
D) less likelihood for new technology development
E) increasing public deficits
فتح الحزمة
افتح القفل للوصول البطاقات البالغ عددها 89 في هذه المجموعة.
فتح الحزمة
k this deck
36
Use the figure above to answer the following question(s).A high incidence of AIDS in a country is least likely to result in a(n)____.
A) loss of productive young workers
B) increase of orphaned children
C) increase in life expectancy
D) loss of working adults to support the elderly
E) reduction of skilled workers
فتح الحزمة
افتح القفل للوصول البطاقات البالغ عددها 89 في هذه المجموعة.
فتح الحزمة
k this deck
37
Use the figure above to answer the following question(s).Rapidly growing countries have an age structure diagram that ____.
A) forms an inverted pyramid
B) has a broad-based pyramid
C) shows little variation in population by age
D) has a small pre-reproductive population
E) has a large post reproductive population
فتح الحزمة
افتح القفل للوصول البطاقات البالغ عددها 89 في هذه المجموعة.
فتح الحزمة
k this deck
38
Use the figure above to answer the following question(s).Which country is currently facing a declining population?
A) Germany
B) United States
C) Australia
D) Nigeria
E) Saudi Arabia
فتح الحزمة
افتح القفل للوصول البطاقات البالغ عددها 89 في هذه المجموعة.
فتح الحزمة
k this deck
39
Use the figure above to answer the following question(s).A country with a TFR that falls below 1.5 children per couple for a prolonged period will experience all of the following except ____.
A) a sharp rise in proportion of older people
B) an increasing demand on medical care
C) an increasing demand on social security funds or its equivalent
D) labor shortages
E) an increasing number of working taxpayers.
فتح الحزمة
افتح القفل للوصول البطاقات البالغ عددها 89 في هذه المجموعة.
فتح الحزمة
k this deck
40
Use the figure above to answer the following question(s).Countries that have reached zero population growth have an age structure diagram that ____.
A) forms an inverted pyramid
B) forms a broad-based pyramid
C) has little variation in prereproductive and reproductive age groups
D) has a large pre-reproductive population
E) has a large reproductive population
فتح الحزمة
افتح القفل للوصول البطاقات البالغ عددها 89 في هذه المجموعة.
فتح الحزمة
k this deck
41
Use the figure above to answer the following question(s).More than half of the world's population now lives in urban areas.
فتح الحزمة
افتح القفل للوصول البطاقات البالغ عددها 89 في هذه المجموعة.
فتح الحزمة
k this deck
42
Use the figure above to answer the following question(s).The UN Population Fund indicates that less than 20% of all pregnancies in less-developed countries are unplanned,while 10% end with abortion.
فتح الحزمة
افتح القفل للوصول البطاقات البالغ عددها 89 في هذه المجموعة.
فتح الحزمة
k this deck
43
Use the figure above to answer the following question(s).Which statement about India's resource and environmental problems is false?
A) India has 18% of world's people,but only 2.3 % of world's land resources.
B) About one-half of India's cropland is degraded.
C) About two-thirds of its water is seriously polluted.
D) India has about 15% of the world's forests.
E) Sanitation services are often inadequate.
فتح الحزمة
افتح القفل للوصول البطاقات البالغ عددها 89 في هذه المجموعة.
فتح الحزمة
k this deck
44
Use the figure above to answer the following question(s).Between 1972 and 2012,the average number of children born to a woman in China declined from 5.7 to 1.5.
فتح الحزمة
افتح القفل للوصول البطاقات البالغ عددها 89 في هذه المجموعة.
فتح الحزمة
k this deck
45
Use the figure above to answer the following question(s).In 2012,more than one-third of the global population lived in China or India.
فتح الحزمة
افتح القفل للوصول البطاقات البالغ عددها 89 في هذه المجموعة.
فتح الحزمة
k this deck
46
Use the figure above to answer the following question(s).The world's first national ____ program began in India in 1952.
A) family planning
B) economic transition
C) literacy
D) sterilization
E) urbanization
فتح الحزمة
افتح القفل للوصول البطاقات البالغ عددها 89 في هذه المجموعة.
فتح الحزمة
k this deck
47
Use the figure above to answer the following question(s).According to the demographic transition model,what trend is true of countries in Stage 2: Transitional?
A) Death rates drop,followed by birth rates.
B) Birth rates drop,followed by death rates.
C) Birth and death rates rise at the same time.
D) Birth and death rates fall at the same time.
E) Total population begins to fall
فتح الحزمة
افتح القفل للوصول البطاقات البالغ عددها 89 في هذه المجموعة.
فتح الحزمة
k this deck
48
Use the figure above to answer the following question(s).The average number of children born to a woman in China in 2012 is less than the number born to a woman in the United States.
فتح الحزمة
افتح القفل للوصول البطاقات البالغ عددها 89 في هذه المجموعة.
فتح الحزمة
k this deck
49
Use the figure above to answer the following question(s).Women are least likely to have fewer and healthier children when ____.
A) their individual rights are protected
B) they earn an income of their own
C) they have access to education
D) they control their own fertility
E) they marry at a young age
فتح الحزمة
افتح القفل للوصول البطاقات البالغ عددها 89 في هذه المجموعة.
فتح الحزمة
k this deck
50
Use the figure above to answer the following question(s).Reaching the replacement-level fertility rate means a quick halt to population growth.
فتح الحزمة
افتح القفل للوصول البطاقات البالغ عددها 89 في هذه المجموعة.
فتح الحزمة
k this deck
51
Use the figure above to answer the following question(s).In the demographic transition model,death rates fall while birth rates remain high ____.
A) during the preindustrial stage
B) during the industrial stage
C) during the postindustrial stage
D) during the transitional stage
E) following the postindustrial stage
فتح الحزمة
افتح القفل للوصول البطاقات البالغ عددها 89 في هذه المجموعة.
فتح الحزمة
k this deck
52
Use the figure above to answer the following question(s).Which stage does not belong in the demographic transition model?
A) preindustrial
B) industrial
C) pre-transitional
D) transitional
E) postindustrial
فتح الحزمة
افتح القفل للوصول البطاقات البالغ عددها 89 في هذه المجموعة.
فتح الحزمة
k this deck
53
Use the figure above to answer the following question(s).Infant mortality rate is one of the best measures of a society's quality of life.
فتح الحزمة
افتح القفل للوصول البطاقات البالغ عددها 89 في هذه المجموعة.
فتح الحزمة
k this deck
54
Use the figure above to answer the following question(s).In developing countries,demographic transition is least likely to be hindered by ____.
A) environmental degradation
B) extreme poverty
C) resource depletion
D) a drop in economic assistance from developed countries
E) an increase in education opportunities for women
فتح الحزمة
افتح القفل للوصول البطاقات البالغ عددها 89 في هذه المجموعة.
فتح الحزمة
k this deck
55
Use the figure above to answer the following question(s).Which statement about India is false?
A) Twenty-five percent of people in cities live in slums.
B) India has the fourth largest economy.
C) Eighty percent of rural people have adequate sanitation.
D) Nearly one-half of the people are unemployed or underemployed.
E) Forty percent of the population suffers from extreme poverty.
فتح الحزمة
افتح القفل للوصول البطاقات البالغ عددها 89 في هذه المجموعة.
فتح الحزمة
k this deck
56
Use the figure above to answer the following question(s).About 70% of the growth in the U.S.population in 2012 resulted from births outnumbering deaths.
فتح الحزمة
افتح القفل للوصول البطاقات البالغ عددها 89 في هذه المجموعة.
فتح الحزمة
k this deck
57
Use the figure above to answer the following question(s).Which statement about China is false?
A) Between 1972 and 2012,China cut its birth rate in half.
B) China's population is expanding slowly.
C) Eighty-five percent of Chinese couples use some form of birth control.
D) China has very few critical resource and environmental problems.
E) India's population will exceed China's by 2030.
فتح الحزمة
افتح القفل للوصول البطاقات البالغ عددها 89 في هذه المجموعة.
فتح الحزمة
k this deck
58
Use the figure above to answer the following question(s).Which statistic is not true of women globally?
A) Women have more children if they are educated.
B) Women account for 66% of all hours worked but receive only 10% of world's income.
C) Women own less than 2% of the world's land.
D) Women make up 70% of the world's poor.
E) Women represent 66% of the world's illiterate adults.
فتح الحزمة
افتح القفل للوصول البطاقات البالغ عددها 89 في هذه المجموعة.
فتح الحزمة
k this deck
59
Use the figure above to answer the following question(s).The population of the United States has stopped growing.
فتح الحزمة
افتح القفل للوصول البطاقات البالغ عددها 89 في هذه المجموعة.
فتح الحزمة
k this deck
60
Use the figure above to answer the following question(s).In African countries,where 15-26% of the adult population is infected with HIV,life expectancy is expected to drop sharply.
فتح الحزمة
افتح القفل للوصول البطاقات البالغ عددها 89 في هذه المجموعة.
فتح الحزمة
k this deck
61
Use the figure above to answer the following question(s).Family planning reduces the number of legal and illegal abortions performed each year,and stabilizes the populations.
فتح الحزمة
افتح القفل للوصول البطاقات البالغ عددها 89 في هذه المجموعة.
فتح الحزمة
k this deck
62
A country with many people younger than age 15 will experience rapid population growth,unless death rates rise sharply.This phenomenon is called _______________.
فتح الحزمة
افتح القفل للوصول البطاقات البالغ عددها 89 في هذه المجموعة.
فتح الحزمة
k this deck
63
Use the figure above to answer the following question(s).Worldwide,the number of school-age girls who do not attend elementary school is more than three times the population of the United States.
فتح الحزمة
افتح القفل للوصول البطاقات البالغ عددها 89 في هذه المجموعة.
فتح الحزمة
k this deck
64
Use the figure above to answer the following question(s).Globally,women own 40% of the world's land.
فتح الحزمة
افتح القفل للوصول البطاقات البالغ عددها 89 في هذه المجموعة.
فتح الحزمة
k this deck
65
China has cut its total fertility rate from 5.7 to ____________________ over the last 40 years.
فتح الحزمة
افتح القفل للوصول البطاقات البالغ عددها 89 في هذه المجموعة.
فتح الحزمة
k this deck
66
Use the figure above to answer the following question(s).The ____________________ is the number of live births per 1,000 people in a population in a given year.
فتح الحزمة
افتح القفل للوصول البطاقات البالغ عددها 89 في هذه المجموعة.
فتح الحزمة
k this deck
67
Unlike malnutrition,AIDS kills many ____________________.
فتح الحزمة
افتح القفل للوصول البطاقات البالغ عددها 89 في هذه المجموعة.
فتح الحزمة
k this deck
68
________________ is the leading cause of death for people ages 15-49.
فتح الحزمة
افتح القفل للوصول البطاقات البالغ عددها 89 في هذه المجموعة.
فتح الحزمة
k this deck
69
Use the figure above to answer the following question(s).The rapid growth of the world's population over the past 100 years is primarily the result of a(n)____________________ in the crude ____________________.
فتح الحزمة
افتح القفل للوصول البطاقات البالغ عددها 89 في هذه المجموعة.
فتح الحزمة
k this deck
70
Use the figure above to answer the following question(s).Worldwide,900 million girls do not attend elementary school.
فتح الحزمة
افتح القفل للوصول البطاقات البالغ عددها 89 في هذه المجموعة.
فتح الحزمة
k this deck
71
Use the figure above to answer the following question(s).The maximum number people that can be supported by the planet's resources indefinitely is called the ___________________.
فتح الحزمة
افتح القفل للوصول البطاقات البالغ عددها 89 في هذه المجموعة.
فتح الحزمة
k this deck
72
Use the figure above to answer the following question(s).Family planning is responsible for a majority (55%)of the drop in total fertility rates (TFRs)in less-developed countries..
فتح الحزمة
افتح القفل للوصول البطاقات البالغ عددها 89 في هذه المجموعة.
فتح الحزمة
k this deck
73
Use the Figure above to answer the following question(s).Since 1900,the ____________________ represents the period characterized by the lowest number of immigrants to the U.S.
فتح الحزمة
افتح القفل للوصول البطاقات البالغ عددها 89 في هذه المجموعة.
فتح الحزمة
k this deck
74
Use the figure above to answer the following question(s).The U.S.generation born between 1946 and 1964 is known as the _______________ generation.
فتح الحزمة
افتح القفل للوصول البطاقات البالغ عددها 89 في هذه المجموعة.
فتح الحزمة
k this deck
75
In stage ____________________ of demographic transition,birth rates remain high and death rates have begun to drop due to improved food production and health.
فتح الحزمة
افتح القفل للوصول البطاقات البالغ عددها 89 في هذه المجموعة.
فتح الحزمة
k this deck
76
Between 1972 and 2012,China cut its birth rate _______________.
فتح الحزمة
افتح القفل للوصول البطاقات البالغ عددها 89 في هذه المجموعة.
فتح الحزمة
k this deck
77
Use the figure above to answer the following question(s).The ____________________ is the number of deaths per 1,000 people in a population in a given year.
فتح الحزمة
افتح القفل للوصول البطاقات البالغ عددها 89 في هذه المجموعة.
فتح الحزمة
k this deck
78
Use the figure above to answer the following question(s).The United States ranks _______________ in the world in terms of infant mortality rates.
فتح الحزمة
افتح القفل للوصول البطاقات البالغ عددها 89 في هذه المجموعة.
فتح الحزمة
k this deck
79
Use the Figure above to answer the following question(s).The straight line running through the accompanying graph from left to right represents ____________________.
فتح الحزمة
افتح القفل للوصول البطاقات البالغ عددها 89 في هذه المجموعة.
فتح الحزمة
k this deck
80
The global population of people over 65 is projected to _______________ by the year 2050.
فتح الحزمة
افتح القفل للوصول البطاقات البالغ عددها 89 في هذه المجموعة.
فتح الحزمة
k this deck
فتح الحزمة
افتح القفل للوصول البطاقات البالغ عددها 89 في هذه المجموعة.


