Deck 5: Numerical Descriptive Measures
ملء الشاشة (f)
سؤال
What measure of central location is best used with a categorical variable? 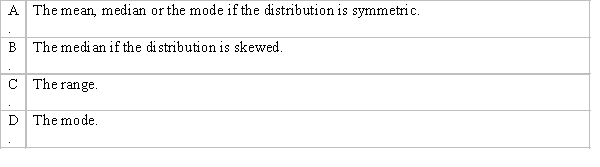
سؤال
Which of the following summary measures is affected by extreme values? 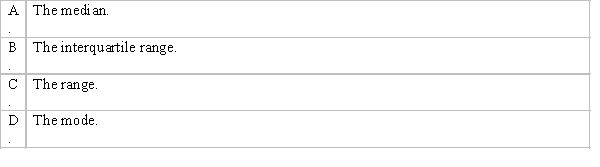
سؤال
According to Chebyshev's theorem, which of the following is the percentage of measurements in a data set that fall within three standard deviations of their mean? 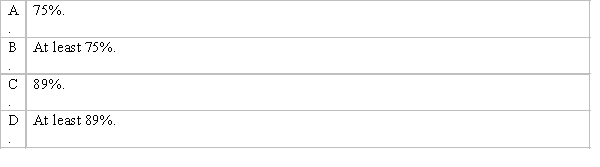
سؤال
The average score for a class of 30 students was 75. The 20 male students in the class averaged 70. The female students in the class averaged: 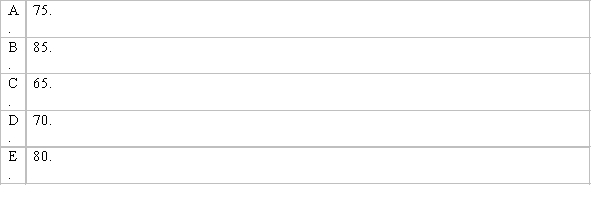
سؤال
Which of the following statements describes when the median is a better measure of centre than the mean? 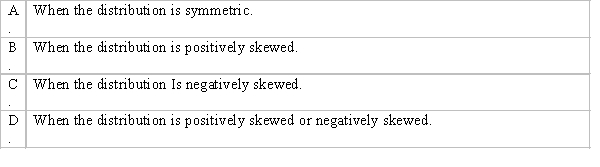
سؤال
Which of the following statements best describes the mean of a data set? 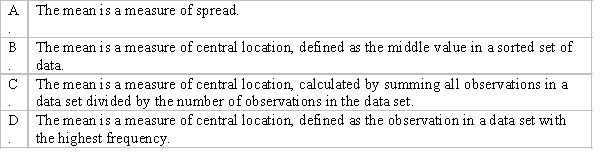
سؤال
Which of the following summary measures cannot be easily approximated from a box-and-whisker plot? 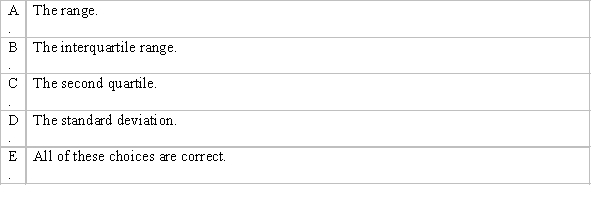
سؤال
Which of the following statements is true for the following data values: 7, 5, 6, 4, 7, 8 and 12? 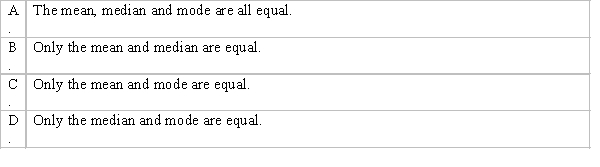
سؤال
Which of the following best describes the width of the box in the box-and-whisker plot? 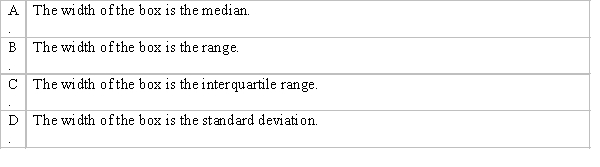
سؤال
Which of the following statements is true? 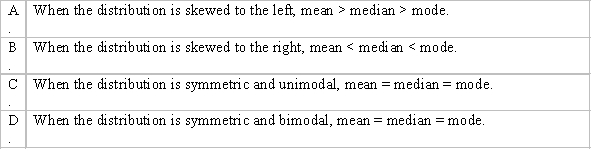
سؤال
Using percentiles, the difference between which of the following is the interquartile range? 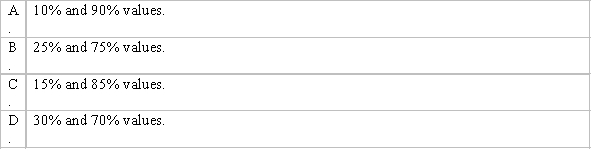
سؤال
Which of the following is not a measure of variability? 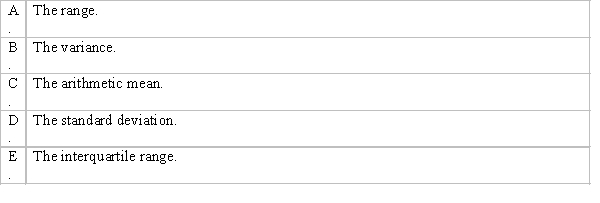
سؤال
According to the empirical rule, which of the following is the approximate percentage of measurements in a data set (provided that the data set has a bell-shaped distribution) that fall within two standard deviations of their mean? 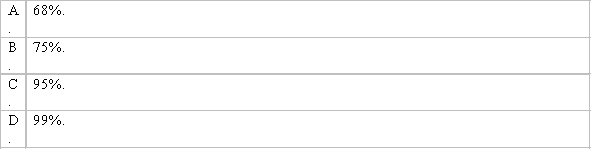
سؤال
Which measure of variability is appropriate when a sample is likely to contain one or several extreme values? 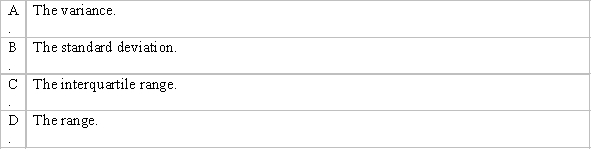
سؤال
Which of the following best describes the scenario when two data sets have the same range? 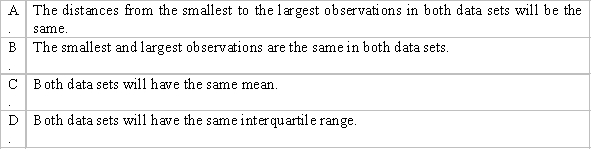
سؤال
Which of the following is the best measure of variability if the distribution of a set of data is skewed? 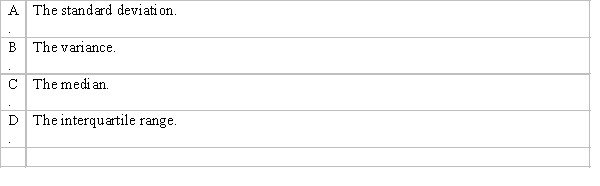
سؤال
Which of the following is the proportion of the total area that must be to the left of the median, in a histogram? 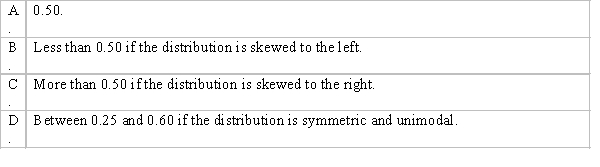
سؤال
Which of the following statements is true? 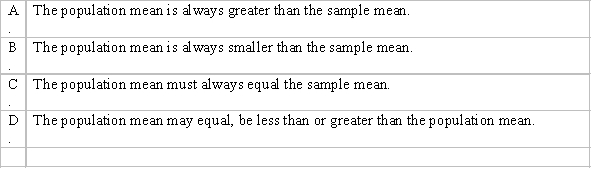
سؤال
A sample of 16 observations has a standard deviation of 2. Which of the following is the sum of the squared deviations from the sample mean? 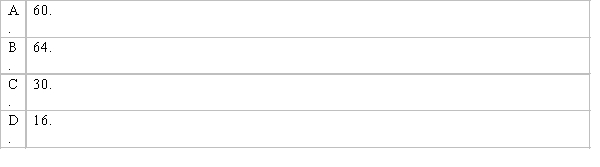
سؤال
Which of the following statements is true? 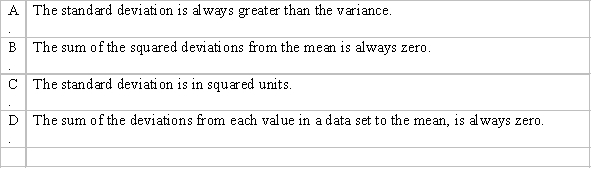
سؤال
سؤال
سؤال
سؤال
Which of the following would be the value of the correlation coefficient of two variables which are not linearly related. 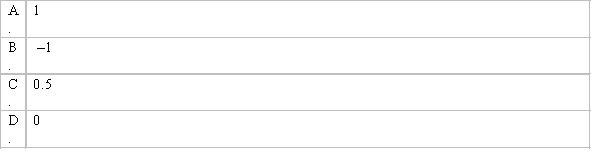
سؤال
سؤال
سؤال
سؤال
Which of the following must is necessary when approximating descriptive measures for grouped data? 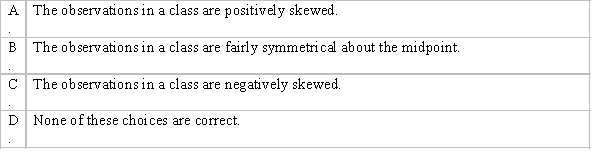
سؤال
سؤال
سؤال
سؤال
Which of the following statements is true? 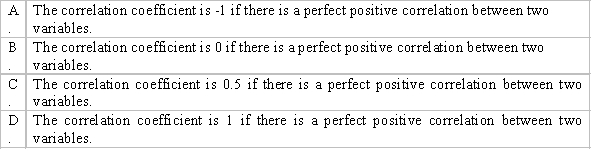
سؤال
Which of the following are measures of the linear relationship between two variables? 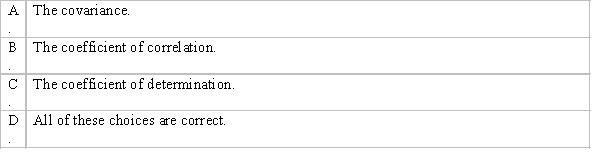
سؤال
سؤال
Which of the following may be answered by knowing the shape of the distribution? 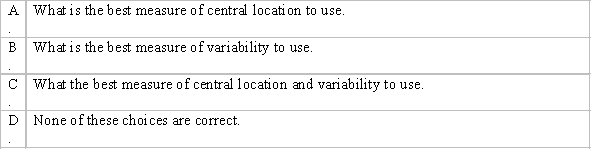
سؤال
Which of the following statements is true? 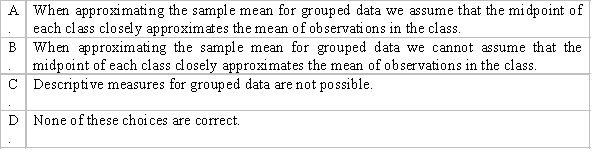
سؤال
سؤال
سؤال
سؤال
سؤال
سؤال
سؤال
سؤال
سؤال
سؤال
سؤال
سؤال
سؤال
سؤال
سؤال
سؤال
سؤال
سؤال
سؤال
سؤال
سؤال
سؤال
سؤال
سؤال
سؤال
سؤال
سؤال
سؤال
Monthly rent data in dollars for a sample of 10 one-bedroom apartments in Perth are given below:  a. Compute the sample monthly average rent.
b. Compute the sample median.
c. What is the mode?
a. Compute the sample monthly average rent.b. Compute the sample median.
c. What is the mode?
سؤال
سؤال
A sample of 25 families was asked how many pets they owned. Their responses are summarized in the following table.  a. Determine the mean, the median and the mode of the number of pets owned per family.
b. Describe briefly what each statistic in part (a) tells you about the data.
a. Determine the mean, the median and the mode of the number of pets owned per family.b. Describe briefly what each statistic in part (a) tells you about the data.
سؤال
سؤال
سؤال
The following data represent the numbers of bedrooms in a sample of 10 suburban houses in Melbourne:  Use these data to answer the following question/s.
a. Compute the mean.
b. Compute the median.
Use these data to answer the following question/s.a. Compute the mean.
b. Compute the median.
سؤال
سؤال
سؤال
سؤال
سؤال
سؤال
سؤال
سؤال
سؤال
سؤال
سؤال

فتح الحزمة
قم بالتسجيل لفتح البطاقات في هذه المجموعة!
Unlock Deck
Unlock Deck
1/147
العب
ملء الشاشة (f)
Deck 5: Numerical Descriptive Measures
1
What measure of central location is best used with a categorical variable?
D
2
Which of the following summary measures is affected by extreme values?
C
3
According to Chebyshev's theorem, which of the following is the percentage of measurements in a data set that fall within three standard deviations of their mean?
D
4
The average score for a class of 30 students was 75. The 20 male students in the class averaged 70. The female students in the class averaged:
فتح الحزمة
افتح القفل للوصول البطاقات البالغ عددها 147 في هذه المجموعة.
فتح الحزمة
k this deck
5
Which of the following statements describes when the median is a better measure of centre than the mean?
فتح الحزمة
افتح القفل للوصول البطاقات البالغ عددها 147 في هذه المجموعة.
فتح الحزمة
k this deck
6
Which of the following statements best describes the mean of a data set?
فتح الحزمة
افتح القفل للوصول البطاقات البالغ عددها 147 في هذه المجموعة.
فتح الحزمة
k this deck
7
Which of the following summary measures cannot be easily approximated from a box-and-whisker plot?
فتح الحزمة
افتح القفل للوصول البطاقات البالغ عددها 147 في هذه المجموعة.
فتح الحزمة
k this deck
8
Which of the following statements is true for the following data values: 7, 5, 6, 4, 7, 8 and 12?
فتح الحزمة
افتح القفل للوصول البطاقات البالغ عددها 147 في هذه المجموعة.
فتح الحزمة
k this deck
9
Which of the following best describes the width of the box in the box-and-whisker plot?
فتح الحزمة
افتح القفل للوصول البطاقات البالغ عددها 147 في هذه المجموعة.
فتح الحزمة
k this deck
10
Which of the following statements is true?
فتح الحزمة
افتح القفل للوصول البطاقات البالغ عددها 147 في هذه المجموعة.
فتح الحزمة
k this deck
11
Using percentiles, the difference between which of the following is the interquartile range?
فتح الحزمة
افتح القفل للوصول البطاقات البالغ عددها 147 في هذه المجموعة.
فتح الحزمة
k this deck
12
Which of the following is not a measure of variability?
فتح الحزمة
افتح القفل للوصول البطاقات البالغ عددها 147 في هذه المجموعة.
فتح الحزمة
k this deck
13
According to the empirical rule, which of the following is the approximate percentage of measurements in a data set (provided that the data set has a bell-shaped distribution) that fall within two standard deviations of their mean?
فتح الحزمة
افتح القفل للوصول البطاقات البالغ عددها 147 في هذه المجموعة.
فتح الحزمة
k this deck
14
Which measure of variability is appropriate when a sample is likely to contain one or several extreme values?
فتح الحزمة
افتح القفل للوصول البطاقات البالغ عددها 147 في هذه المجموعة.
فتح الحزمة
k this deck
15
Which of the following best describes the scenario when two data sets have the same range?
فتح الحزمة
افتح القفل للوصول البطاقات البالغ عددها 147 في هذه المجموعة.
فتح الحزمة
k this deck
16
Which of the following is the best measure of variability if the distribution of a set of data is skewed?
فتح الحزمة
افتح القفل للوصول البطاقات البالغ عددها 147 في هذه المجموعة.
فتح الحزمة
k this deck
17
Which of the following is the proportion of the total area that must be to the left of the median, in a histogram?
فتح الحزمة
افتح القفل للوصول البطاقات البالغ عددها 147 في هذه المجموعة.
فتح الحزمة
k this deck
18
Which of the following statements is true?
فتح الحزمة
افتح القفل للوصول البطاقات البالغ عددها 147 في هذه المجموعة.
فتح الحزمة
k this deck
19
A sample of 16 observations has a standard deviation of 2. Which of the following is the sum of the squared deviations from the sample mean?
فتح الحزمة
افتح القفل للوصول البطاقات البالغ عددها 147 في هذه المجموعة.
فتح الحزمة
k this deck
20
Which of the following statements is true?
فتح الحزمة
افتح القفل للوصول البطاقات البالغ عددها 147 في هذه المجموعة.
فتح الحزمة
k this deck
21
In a positively skewed distribution, the mean is larger than the median and the median is larger than the mode.
فتح الحزمة
افتح القفل للوصول البطاقات البالغ عددها 147 في هذه المجموعة.
فتح الحزمة
k this deck
22
Quartiles divide the values in a data set into four parts of equal size.
فتح الحزمة
افتح القفل للوصول البطاقات البالغ عددها 147 في هذه المجموعة.
فتح الحزمة
k this deck
23
In a bell-shaped distribution, there is no difference in the values of the mean, median and mode.
فتح الحزمة
افتح القفل للوصول البطاقات البالغ عددها 147 في هذه المجموعة.
فتح الحزمة
k this deck
24
Which of the following would be the value of the correlation coefficient of two variables which are not linearly related.
فتح الحزمة
افتح القفل للوصول البطاقات البالغ عددها 147 في هذه المجموعة.
فتح الحزمة
k this deck
25
Lily has been keeping track of what she spends on eating out. The last week's expenditures for meals eaten out were $5.69, $5.95, $6.19, $10.91, $7.49, $14.53 and $7.66. The mean amount Lily spends on meals is $8.35.
فتح الحزمة
افتح القفل للوصول البطاقات البالغ عددها 147 في هذه المجموعة.
فتح الحزمة
k this deck
26
In a negatively skewed distribution, the mean is greater than the median.
فتح الحزمة
افتح القفل للوصول البطاقات البالغ عددها 147 في هذه المجموعة.
فتح الحزمة
k this deck
27
A student scores 87, 73, 92 and 86 on four exams during the semester, and 95 on the final exam. If the final is weighted double and the four others weighted equally, the student's final average would be 88.
فتح الحزمة
افتح القفل للوصول البطاقات البالغ عددها 147 في هذه المجموعة.
فتح الحزمة
k this deck
28
Which of the following must is necessary when approximating descriptive measures for grouped data?
فتح الحزمة
افتح القفل للوصول البطاقات البالغ عددها 147 في هذه المجموعة.
فتح الحزمة
k this deck
29
In a symmetric distribution, the mean is the most used measure of central location for quantitative data.
فتح الحزمة
افتح القفل للوصول البطاقات البالغ عددها 147 في هذه المجموعة.
فتح الحزمة
k this deck
30
The range is considered the weakest measure of variability.
فتح الحزمة
افتح القفل للوصول البطاقات البالغ عددها 147 في هذه المجموعة.
فتح الحزمة
k this deck
31
When a distribution is symmetric, the mean, median and the mode are all equal.
فتح الحزمة
افتح القفل للوصول البطاقات البالغ عددها 147 في هذه المجموعة.
فتح الحزمة
k this deck
32
Which of the following statements is true?
فتح الحزمة
افتح القفل للوصول البطاقات البالغ عددها 147 في هذه المجموعة.
فتح الحزمة
k this deck
33
Which of the following are measures of the linear relationship between two variables?
فتح الحزمة
افتح القفل للوصول البطاقات البالغ عددها 147 في هذه المجموعة.
فتح الحزمة
k this deck
34
In a negatively skewed distribution, the mean is smaller than the median and the median is smaller than the mode.
فتح الحزمة
افتح القفل للوصول البطاقات البالغ عددها 147 في هذه المجموعة.
فتح الحزمة
k this deck
35
Which of the following may be answered by knowing the shape of the distribution?
فتح الحزمة
افتح القفل للوصول البطاقات البالغ عددها 147 في هذه المجموعة.
فتح الحزمة
k this deck
36
Which of the following statements is true?
فتح الحزمة
افتح القفل للوصول البطاقات البالغ عددها 147 في هذه المجموعة.
فتح الحزمة
k this deck
37
The mode is the only measure of central location for a distribution of a nominal (categorical) variable.
فتح الحزمة
افتح القفل للوصول البطاقات البالغ عددها 147 في هذه المجموعة.
فتح الحزمة
k this deck
38
The coefficient of variation allows us to compare two sets of data based on different measurement units.
فتح الحزمة
افتح القفل للوصول البطاقات البالغ عددها 147 في هذه المجموعة.
فتح الحزمة
k this deck
39
The difference between the largest and smallest values in an ordered array is called the range.
فتح الحزمة
افتح القفل للوصول البطاقات البالغ عددها 147 في هذه المجموعة.
فتح الحزمة
k this deck
40
A data sample has a mean of 107, a median of 122 and a mode of 134. The distribution of the data is positively skewed.
فتح الحزمة
افتح القفل للوصول البطاقات البالغ عددها 147 في هذه المجموعة.
فتح الحزمة
k this deck
41
The interquartile range is found by taking the difference between the 1st and 3rd quartiles and dividing that value by 2.
فتح الحزمة
افتح القفل للوصول البطاقات البالغ عددها 147 في هذه المجموعة.
فتح الحزمة
k this deck
42
The value of the standard deviation will always exceed that of the variance.
فتح الحزمة
افتح القفل للوصول البطاقات البالغ عددها 147 في هذه المجموعة.
فتح الحزمة
k this deck
43
The value of the standard deviation may be either positive or negative, while the value of the variance will always be positive.
فتح الحزمة
افتح القفل للوصول البطاقات البالغ عددها 147 في هذه المجموعة.
فتح الحزمة
k this deck
44
The empirical rule states that the percentage of observations in a data set (provided that the data set has a bell-shaped and symmetric distribution) that fall within one standard deviation of their mean is
approximately 75%.
approximately 75%.
فتح الحزمة
افتح القفل للوصول البطاقات البالغ عددها 147 في هذه المجموعة.
فتح الحزمة
k this deck
45
A courier company is reviewing their delivery times. The following descriptive statistics relates to this courier company. The mean time for package delivery is 5 hours, the first quartile is 4 hours, the third quartile is 17 hours. This means that the 25% of the deliveries take more than 17 hours.
فتح الحزمة
افتح القفل للوصول البطاقات البالغ عددها 147 في هذه المجموعة.
فتح الحزمة
k this deck
46
While Chebyshev's theorem applies to any distribution, regardless of shape, the empirical rule applies only to distributions that are bell-shaped and symmetrical.
فتح الحزمة
افتح القفل للوصول البطاقات البالغ عددها 147 في هذه المجموعة.
فتح الحزمة
k this deck
47
The coefficient of variation gives an indication of the magnitude of the standard deviation relative to the mean.
فتح الحزمة
افتح القفل للوصول البطاقات البالغ عددها 147 في هذه المجموعة.
فتح الحزمة
k this deck
48
Chebyshev's theorem states that the percentage of observations in a data set that should fall within 3 standard deviations of their mean is at least 88.9%.
فتح الحزمة
افتح القفل للوصول البطاقات البالغ عددها 147 في هذه المجموعة.
فتح الحزمة
k this deck
49
The left side of the box in a boxplot is the first quartile and the right side of the box in a boxplot is the third quartile, so the width of the box is the interquartile range.
فتح الحزمة
افتح القفل للوصول البطاقات البالغ عددها 147 في هذه المجموعة.
فتح الحزمة
k this deck
50
When the distribution is skewed, the interquartile range is a better measure of variability than the standard deviation.
فتح الحزمة
افتح القفل للوصول البطاقات البالغ عددها 147 في هذه المجموعة.
فتح الحزمة
k this deck
51
The width of the box in a boxplot is the mean of the data set.
فتح الحزمة
افتح القفل للوصول البطاقات البالغ عددها 147 في هذه المجموعة.
فتح الحزمة
k this deck
52
The coefficient of variation is the standard deviation divided by the mean.
فتح الحزمة
افتح القفل للوصول البطاقات البالغ عددها 147 في هذه المجموعة.
فتح الحزمة
k this deck
53
The standard deviation is expressed in terms of the original units of measurement, but the variance is not.
فتح الحزمة
افتح القفل للوصول البطاقات البالغ عددها 147 في هذه المجموعة.
فتح الحزمة
k this deck
54
The boxplot may be used for ordinal data or numerical data.
فتح الحزمة
افتح القفل للوصول البطاقات البالغ عددها 147 في هذه المجموعة.
فتح الحزمة
k this deck
55
Chebyshev's theorem relates to only to symmetric histograms.
فتح الحزمة
افتح القفل للوصول البطاقات البالغ عددها 147 في هذه المجموعة.
فتح الحزمة
k this deck
56
A courier company is reviewing their delivery times. The following descriptive statistics relates to this courier company. The mean time for package delivery is 5 hours, the first quartile is 4 hours, the third quartile is 17 hours. This means that 75% of deliveries take more than 4 hours?
فتح الحزمة
افتح القفل للوصول البطاقات البالغ عددها 147 في هذه المجموعة.
فتح الحزمة
k this deck
57
Chebyshev's theorem applies only to data sets that have a mound-shaped distribution.
فتح الحزمة
افتح القفل للوصول البطاقات البالغ عددها 147 في هذه المجموعة.
فتح الحزمة
k this deck
58
A courier company is reviewing their delivery times. The following descriptive statistics relates to this courier company. The mean time for package delivery is 5 hours, the first quartile is 4 hours, the third quartile is 17 hours. This means that the median must lie between 4 hours and 17 hours.
فتح الحزمة
افتح القفل للوصول البطاقات البالغ عددها 147 في هذه المجموعة.
فتح الحزمة
k this deck
59
There are no measures of variability for nominal data.
فتح الحزمة
افتح القفل للوصول البطاقات البالغ عددها 147 في هذه المجموعة.
فتح الحزمة
k this deck
60
The mean of fifty sales receipts is $65.75 and the standard deviation is $10.55. Using Chebyshev's theorem, at least 75% of the sales receipts were between $44.65 and $86.85.
فتح الحزمة
افتح القفل للوصول البطاقات البالغ عددها 147 في هذه المجموعة.
فتح الحزمة
k this deck
61
When approximating descriptive measures for grouped data, the shape of the distribution within each class is ignored.
فتح الحزمة
افتح القفل للوصول البطاقات البالغ عددها 147 في هذه المجموعة.
فتح الحزمة
k this deck
62
The coefficient of correlation is the covariance divided by the standard deviation
فتح الحزمة
افتح القفل للوصول البطاقات البالغ عددها 147 في هذه المجموعة.
فتح الحزمة
k this deck
63
The correlation coefficient only measures the direction and strength of a linear relationship between two numerical variables.
فتح الحزمة
افتح القفل للوصول البطاقات البالغ عددها 147 في هذه المجموعة.
فتح الحزمة
k this deck
64
Monthly rent data in dollars for a sample of 10 one-bedroom apartments in Perth are given below: a. Compute the sample monthly average rent.
b. Compute the sample median.
c. What is the mode?
a. Compute the sample monthly average rent.b. Compute the sample median.
c. What is the mode?
فتح الحزمة
افتح القفل للوصول البطاقات البالغ عددها 147 في هذه المجموعة.
فتح الحزمة
k this deck
65
The coefficient of correlation is the same value as the coefficient of determination.
فتح الحزمة
افتح القفل للوصول البطاقات البالغ عددها 147 في هذه المجموعة.
فتح الحزمة
k this deck
66
A sample of 25 families was asked how many pets they owned. Their responses are summarized in the following table. a. Determine the mean, the median and the mode of the number of pets owned per family.
b. Describe briefly what each statistic in part (a) tells you about the data.
a. Determine the mean, the median and the mode of the number of pets owned per family.b. Describe briefly what each statistic in part (a) tells you about the data.
فتح الحزمة
افتح القفل للوصول البطاقات البالغ عددها 147 في هذه المجموعة.
فتح الحزمة
k this deck
67
When approximating descriptive measures for grouped data, the sample mean can be obtained by making the assumption that the midpoint of each class closely approximates the mean of each class.
فتح الحزمة
افتح القفل للوصول البطاقات البالغ عددها 147 في هذه المجموعة.
فتح الحزمة
k this deck
68
A courier company is reviewing their delivery times. The following descriptive statistics relates to this courier company. The mean time for package delivery is 5 hours, the first quartile is 4 hours, the third quartile is 17 hours. This means that 50% of deliveries take more than 5 hours?
فتح الحزمة
افتح القفل للوصول البطاقات البالغ عددها 147 في هذه المجموعة.
فتح الحزمة
k this deck
69
The following data represent the numbers of bedrooms in a sample of 10 suburban houses in Melbourne: Use these data to answer the following question/s.
a. Compute the mean.
b. Compute the median.
Use these data to answer the following question/s.a. Compute the mean.
b. Compute the median.
فتح الحزمة
افتح القفل للوصول البطاقات البالغ عددها 147 في هذه المجموعة.
فتح الحزمة
k this deck
70
Generally speaking, if two variables have a strong positive linear relationship, the covariance between them is equal to one.
فتح الحزمة
افتح القفل للوصول البطاقات البالغ عددها 147 في هذه المجموعة.
فتح الحزمة
k this deck
71
A basketball player has the following points for seven games: 20, 25, 32, 18, 19, 22, 30. Compute the following measures of central location and variability:
a. mean.
b. median.
c. standard deviation.
d. coefficient of variation.
a. mean.
b. median.
c. standard deviation.
d. coefficient of variation.
فتح الحزمة
افتح القفل للوصول البطاقات البالغ عددها 147 في هذه المجموعة.
فتح الحزمة
k this deck
72
The coefficient of determination lies between 0 and 1.
فتح الحزمة
افتح القفل للوصول البطاقات البالغ عددها 147 في هذه المجموعة.
فتح الحزمة
k this deck
73
The shape of the distribution helps to determine the best measure of central location and variability in a data set.
فتح الحزمة
افتح القفل للوصول البطاقات البالغ عددها 147 في هذه المجموعة.
فتح الحزمة
k this deck
74
What are the relative magnitudes of the mean, median and mode for a unimodal distribution that is:
a. symmetrical?
b. skewed to the left?
c. skewed to the right?
a. symmetrical?
b. skewed to the left?
c. skewed to the right?
فتح الحزمة
افتح القفل للوصول البطاقات البالغ عددها 147 في هذه المجموعة.
فتح الحزمة
k this deck
75
The coefficient of determination measures the percentage of variation in the independent variable explained by the dependent variable.
فتح الحزمة
افتح القفل للوصول البطاقات البالغ عددها 147 في هذه المجموعة.
فتح الحزمة
k this deck
76
The coefficient of determination may range in values between negative one and positive one.
فتح الحزمة
افتح القفل للوصول البطاقات البالغ عددها 147 في هذه المجموعة.
فتح الحزمة
k this deck
77
The least squares method is the method of deriving a linear equation between two numerical variables.
فتح الحزمة
افتح القفل للوصول البطاقات البالغ عددها 147 في هذه المجموعة.
فتح الحزمة
k this deck
78
If the coefficient of correlation r = 0, then there is no linear relationship between the dependent variable y and the independent variable x.
فتح الحزمة
افتح القفل للوصول البطاقات البالغ عددها 147 في هذه المجموعة.
فتح الحزمة
k this deck
79
The coefficient of correlation indicates the direction and the strength of the linear relationship between two variables.
فتح الحزمة
افتح القفل للوصول البطاقات البالغ عددها 147 في هذه المجموعة.
فتح الحزمة
k this deck
80
If the coefficient of correlation r = +1, then the best-fit linear equation will actually be satisfied by all of the data points.
فتح الحزمة
افتح القفل للوصول البطاقات البالغ عددها 147 في هذه المجموعة.
فتح الحزمة
k this deck
فتح الحزمة
افتح القفل للوصول البطاقات البالغ عددها 147 في هذه المجموعة.


