Deck 7: Linear Regression
ملء الشاشة (f)
سؤال
سؤال
سؤال
سؤال
سؤال
سؤال
سؤال
سؤال
سؤال
سؤال
سؤال
سؤال
سؤال
سؤال
سؤال
سؤال
سؤال
سؤال
سؤال
سؤال
سؤال
سؤال
سؤال
سؤال
سؤال
سؤال
سؤال
The scatter chart below displays the residuals verses the dependent variable, x. Which of the following conclusions can be drawn from the scatter chart given below? 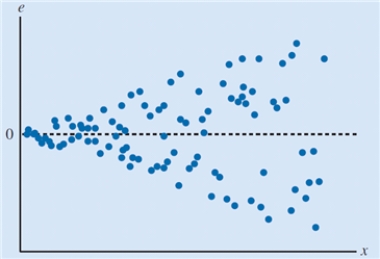
A)The residuals have a increasing variance as the dependent variable increases.
B)The model captures the relationship between the variables accurately.
C)The regression model follows the standard normal probability distribution.
D)The residual distribution is consistently scattered about zero.
A)The residuals have a increasing variance as the dependent variable increases.
B)The model captures the relationship between the variables accurately.
C)The regression model follows the standard normal probability distribution.
D)The residual distribution is consistently scattered about zero.
سؤال
The scatter chart below displays the residuals verses the dependent variable, t. Which of the following conclusions can be drawn based upon this scatter chart? 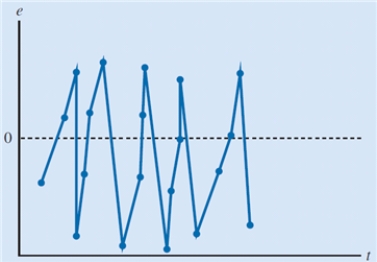
A)model is time-invariant.
B)model captures the relationship between the variables accurately.
C)residuals are not independent.
D)residuals are normally distributed.
A)model is time-invariant.
B)model captures the relationship between the variables accurately.
C)residuals are not independent.
D)residuals are normally distributed.
سؤال
سؤال
سؤال
سؤال
سؤال
سؤال
سؤال
سؤال
سؤال
سؤال
The scatter chart below displays the residuals verses the dependent variable, x. Which of the following conclusions can be drawn based upon this scatter chart? 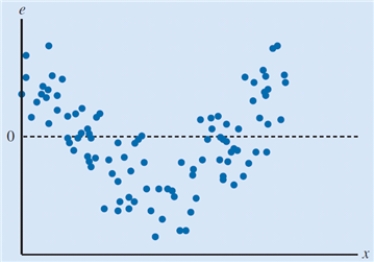
A)The residuals have a constant variance.
B)The model fails to capture the relationship between the variables accurately.
C)The model over predicts the value of the dependent variable for small values and large values of the independent variable.
D)The residuals are normally distributed.
A)The residuals have a constant variance.
B)The model fails to capture the relationship between the variables accurately.
C)The model over predicts the value of the dependent variable for small values and large values of the independent variable.
D)The residuals are normally distributed.
سؤال
سؤال
The scatter chart below displays the residuals verses the dependent variable, x. Which of the following conclusions can be drawn based upon this scatter chart? 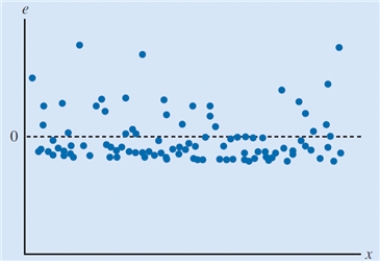
A)The residuals have a constant variance.
B)The model captures the relationship between the variables accurately.
C)The model underpredicts the value of the dependent variable for intermediate values of the independent variable.
D)The residual distribution is not normally distributed.
A)The residuals have a constant variance.
B)The model captures the relationship between the variables accurately.
C)The model underpredicts the value of the dependent variable for intermediate values of the independent variable.
D)The residual distribution is not normally distributed.
سؤال
Listed below is a company's sales in the period 2000 to 2011 along with the national income of the country, where the
business is set up. Test whether each of the regression parameters β0 and β1 is equal to zero at a 0.05 level of significance. What are the correct interpretations of the estimated regression parameters?
business is set up.
Test whether each of the regression parameters β0 and β1 is equal to zero at a 0.05 level of significance. What are the correct interpretations of the estimated regression parameters? سؤال
Listed below is data on profit and market capitalization for a sample of 15 different firms in U.S. 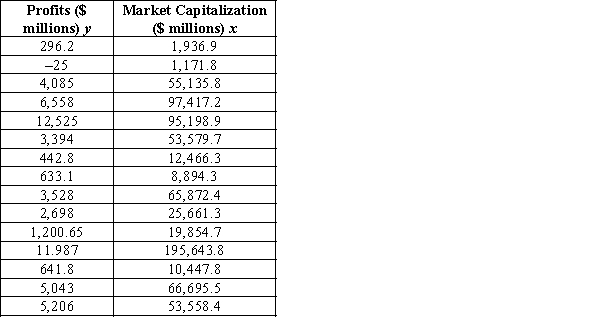
a. Develop a scatter chart for the above data. What does this chart indicate about the relationship between market capitalization and profit?
b. Use the data to develop an estimated regression equation that could be used to estimate a firm's profit based on its market capitalization. What is the estimated regression model?
c. What is the predicted profit for the market capitalization of 70,721.3 (million)?
سؤال
Listed below is a company's sales in the period 2000 to 2011 along with the national income of the country, where the
business is set up.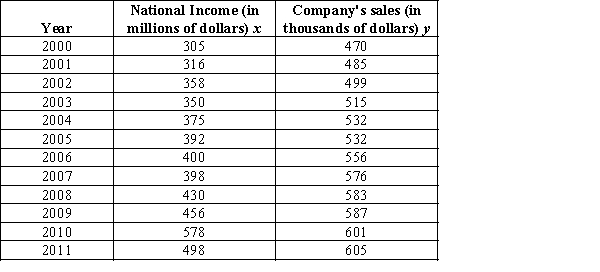
a. Develop a scatter chart for the above data. What does this chart indicate about the relationship between the
National Income and the Company's sales in the period 2000 to 2011?
b. Use the data to develop an estimated regression equation that could be used to estimate the company's sales
based on the national income. What is the estimated regression model?
سؤال
A survey conducted by a research team was to investigate how the education level, tenure in current employment, and age, are related to annual income. A sample 20 employees is selected and the data is given below. 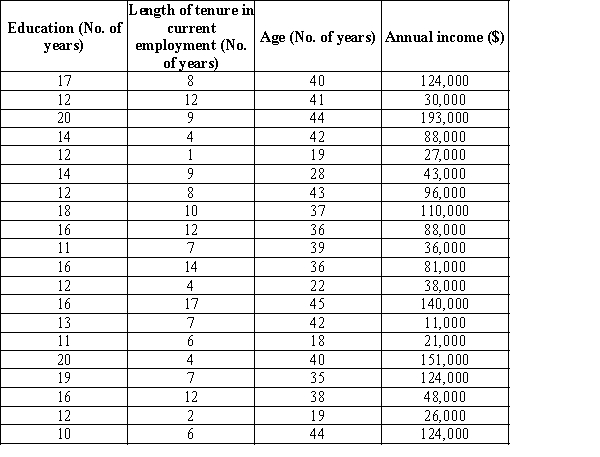
a. Determine the estimated multiple linear regression equation that can be used to predict
the annual income given number of years school completed (Education), length of tenure
in current employment, and age.
b. Use the F test to determine the overall significance of the regression relationship.What is the conclusion at the 0.05 level of significance?
سؤال
سؤال
سؤال
A researcher wanted to study effect of two factors, x1 and x2, on yield (y). The observations are given below. 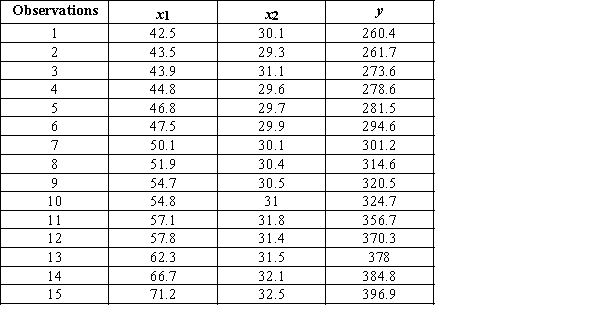
a. Develop an estimated linear regression equation with the factor x1 as the independent variable.Test for a significant relationship between factor x1 and yield at the 0.05 level of significance.
b. How much of the variation in the sample values of yield does the model in part (a) explain?
a. Develop an estimated linear regression equation with the factor x1 as the independent variable.Test for a significant relationship between factor x1 and yield at the 0.05 level of significance.
b. How much of the variation in the sample values of yield does the model in part (a) explain?
سؤال
A research team in at the Gonzaga University is interested in predicting a student's overall university GPA if his/her high school GPA is known. Assume that a random sample of 20 students is selected from the data listed below. 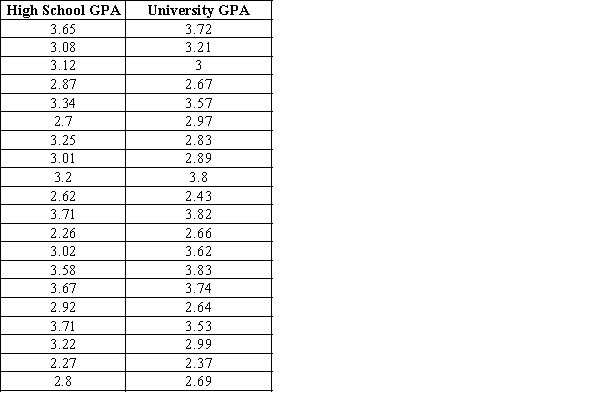
a. Develop a scatter chart for these data with High School GPA as the independent variable.What does the scatter chart indicate about the relationship between high school GPAs and overall university GPA?
b. Develop an estimated regression equation showing how high school GPA is related to overall university GPA.What is the estimated regression model?
c. What is the predicted overall university GPA of Sophia, a student who has been admitted to Gonzaga
University, with 3.40 high school GPA?
سؤال
سؤال
A research center is interested in investigating about height and age of children who are between 5 to 9 years old.
In order to do this, a sample of 15 children is selected and the data is given below.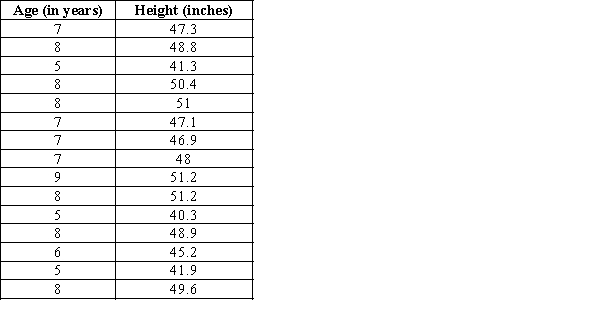
a. Develop a scatter chart with age as the independent variable. What does the scatter chart indicate about the relationship between the height and age of children?
b. Use the data to develop an estimated regression equation that could be used to estimate the height based on the age. What is the estimated regression model?
c. How much of the variation in the sample values of height does the model estimated in part (b) explain?
سؤال
A researcher wanted to study effect of two factors, x1 and x2, on yield (y). The observations are given below. 
a. Develop an estimated regression equation with both factors x1 and x2 as the independent variables. Is the overall regression statistically significant at the 0.05 level of significance? If so, then test whether each of the regression parameters β0, β1, and β2 is equal to zero at a 0.01 level of significance. What are the correct interpretations of the estimated regression parameters?
b. How much of the variation in the sample values of y does the model in part (a) explain?
سؤال
A survey conducted by a research team was to investigate how the education level, tenure in current employment, and age, are related to annual income. A sample 20 employees is selected and the data is given below. 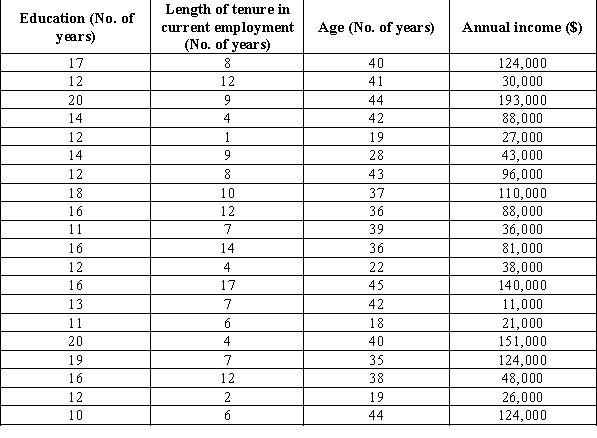
a. Check if the F test leads to conclude that an overall regression relationship exists. If yes, use the t test to
determine the significance of each independent variable. What is the conclusion for each test at the 0.05 level of significance?
b. Remove all independent variables that are not significant at the 0.05 level of significance from the estimated
regression equation. What is your estimated regression equation in this case?
سؤال
سؤال
A student is interested in studying the impact of number of books referred by students on a statistics course and the number of lectures they attended on the final grade on the course. A sample of 25 students is selected and the data is given below. 
a. Develop an estimated regression equation using number of books referred and the number of lectures attended to predict the final grade on the course.
b. Joseph referred 4 books and attended 19 lectures. What is his predicted final score on the course?
a. Develop an estimated regression equation using number of books referred and the number of lectures attended to predict the final grade on the course.
b. Joseph referred 4 books and attended 19 lectures. What is his predicted final score on the course?
سؤال
A student is interested in studying the impact of number of books referred by students on a statistics course and the number of lectures they attended on the final grade on the course. A sample of 25 students is selected and the data is given below. 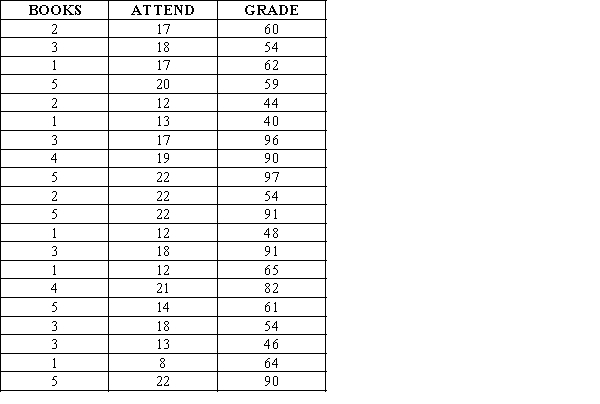
a. Use the F test to determine the overall significance of the relationship. What is your conclusion
at the 0.05 level of significance? Use the t test to determine the significance of each independent
variable? What are your conclusions at the 0.05 level of significance?
b. How much of the variation in the final grade does the model in part (a) explain?
سؤال
سؤال
The data listed below is the average personal income and personal consumption expenditures based on the survey
conducted in the year 1995 to 2009 in U.S.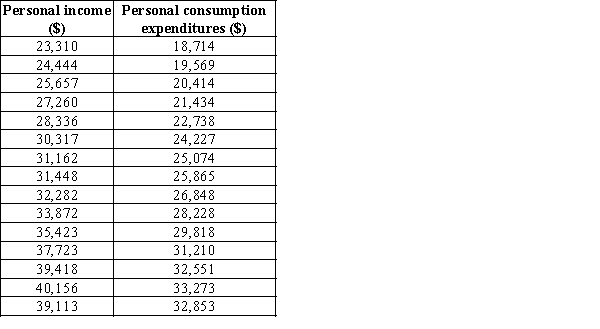
a. Develop a scatter chart for the above data. What does this chart indicate about the relationship between average
personal income and personal consumption expenditure?
b. Develop an estimated regression equation showing how personal consumption expenditure is related personal
income.
c. What proportion of variation in the sample values of proportion of personal consumption expenditure does this
model explain?
سؤال
A survey is conducted to determine whether the age of car influences the annual maintenance cost. A sample of 10
cars is selected and the data is shown below.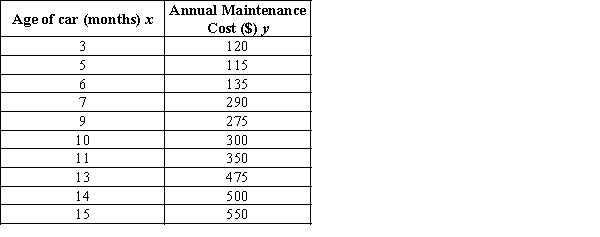
a. Develop a scatter chart for these data with age of cars as the independent variable. What does the scatter chart
indicate about the relationship between age of a car and the annual maintenance cost?
b. Use the data to develop an estimated regression equation that could be used to predict the annual maintenance
cost given the age of the car. What is the estimated regression model?
سؤال
The data listed below is the average personal income and personal consumption expenditures based on the survey
conducted in the year 1995 to 2009 in U.S.
a. What is the 95 percent confidence interval for the regression parameter β1? Based on this interval, what
conclusion can you make about the hypotheses that the regression parameter β1 is equal to zero?
d. What is the 95 percent confidence interval for the regression parameter β0? Based on this interval, what
conclusion can you make about the hypotheses that the regression parameter β0 is equal to zero?
سؤال
A survey is conducted to determine whether the age of car influences the annual maintenance cost. A sample of 10 cars is selected and the data is shown below. 
a. Test whether each of the regression parameters β0 and β1 is equal to zero at a 0.05 level of significance.
b. Interpret the estimated regression parameters? Are these interpretations reasonable?
a. Test whether each of the regression parameters β0 and β1 is equal to zero at a 0.05 level of significance.
b. Interpret the estimated regression parameters? Are these interpretations reasonable?
سؤال
Consider the below data which is based on a company's sales in the period 2000 to 2011 along with the national income of the country, where the business is set up. 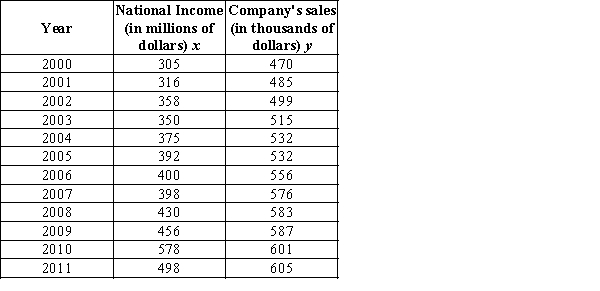
a. Develop a scatter chart for these data, treating the national income as the independent variable. Does a simple linear regression model appear to be appropriate?
b. Develop an appropriate estimated regression equation to predict the company's sales, given the national income. How much variation in the sample values of company's sales is explained by this regression model
سؤال
سؤال
A production company is studying the relationship between the average cost/unit and number of units produced in a batch. A sample of 10 batches is selected and the data is given below.
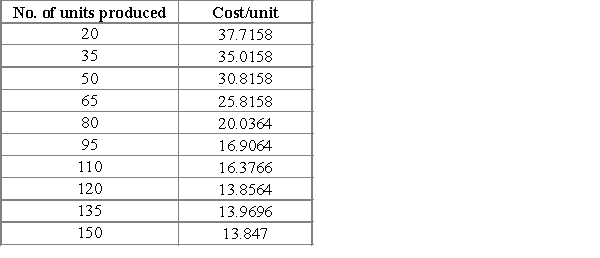
a. Develop an estimated quadratic regression equation for the data. How much variation in the sample values of cost/unit does this regression model explain?
b. Is the overall regression relationship significant at a 0.05 level of significance? If so, then test the relationship between the independent variable and the dependent variable at a 0.05 level of significance.
سؤال
A multiple regression model has the form  = 10 + 2 x1 + 12 x2. As x1 increases by 1 unit (holding x2 constant),
  is expected to increase by how many units?
= 10 + 2 x1 + 12 x2. As x1 increases by 1 unit (holding x2 constant), is expected to increase by how many units? سؤال
سؤال
A production company is studying the relationship between the average cost/unit and number of units produced in a batch. A sample of 10 batches is selected and the data is given below.
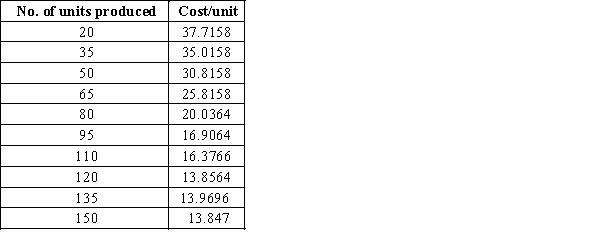
a. Develop a scatter chart for these data. What does the scatter chart indicate about the relationship between average cost/unit and number of units produced?
b. Regardless of your answer to part (a), develop an estimated simple linear regression equation for the data. How much variation in the sample values of cost/unit is explained by this regression model?
سؤال
Give an estimated simple linear regression equation of  = 46.2 + 589.2x with a coefficient of determination R^2 of 0.7523, interpret the coefficient of determination for this equation.
= 46.2 + 589.2x with a coefficient of determination R^2 of 0.7523, interpret the coefficient of determination for this equation.
سؤال
سؤال
سؤال
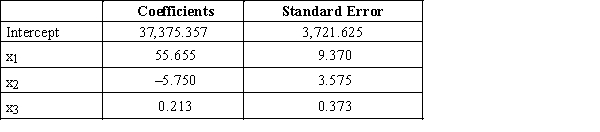
Given the partial Excel output from a multiple regression, formulate the regression model.
سؤال

فتح الحزمة
قم بالتسجيل لفتح البطاقات في هذه المجموعة!
Unlock Deck
Unlock Deck
1/71
العب
ملء الشاشة (f)
Deck 7: Linear Regression
1
The graph of the simple linear regression equation is a(n)
A)ellipse.
B)hyperbola.
C)parabola.
D)straight line.
A)ellipse.
B)hyperbola.
C)parabola.
D)straight line.
straight line.
2
In a simple linear regression model, y = ß0 + ß1x + ε B1 represents the
A)intercept.
B)slope of the true regression line.
C)mean value of x.
D)error term.
A)intercept.
B)slope of the true regression line.
C)mean value of x.
D)error term.
slope of the true regression line.
3
A ___________ is used to visualize sample data graphically and to draw preliminary conclusions about the possible relationship between the variables.
A)contingency table
B)scatter chart
C)Gantt chart
D)pie chart
A)contingency table
B)scatter chart
C)Gantt chart
D)pie chart
scatter chart
4
What would be the value of the sum of squares due to regression (SSR) if the total sum of squares (SST) is 25.32 and the sum of squares due to error (SSE) is 6.89?
A)31.89
B)19.32
C)18.43
D)15.32
A)31.89
B)19.32
C)18.43
D)15.32
فتح الحزمة
افتح القفل للوصول البطاقات البالغ عددها 71 في هذه المجموعة.
فتح الحزمة
k this deck
5
When the mean value of the dependent variable is independent of variation in the independent variable, the slope of the regression line is
A)positive.
B)zero.
C)negative.
D)infinite.
A)positive.
B)zero.
C)negative.
D)infinite.
فتح الحزمة
افتح القفل للوصول البطاقات البالغ عددها 71 في هذه المجموعة.
فتح الحزمة
k this deck
6
The _______________ is the range of values of the independent variables in the data used to estimate the regression model.
A)confidence interval
B)codomain
C)experimental region
D)validation set
A)confidence interval
B)codomain
C)experimental region
D)validation set
فتح الحزمة
افتح القفل للوصول البطاقات البالغ عددها 71 في هذه المجموعة.
فتح الحزمة
k this deck
7
Prediction of the mean value of the dependent variable y for values of the independent variables x1, x2, . . . , xq that are outside the experimental range is called
A)dummy variable.
B)overfitting.
C)extrapolation.
D)interacton.
A)dummy variable.
B)overfitting.
C)extrapolation.
D)interacton.
فتح الحزمة
افتح القفل للوصول البطاقات البالغ عددها 71 في هذه المجموعة.
فتح الحزمة
k this deck
8
The least squares regression line minimizes the sum of the
A)differences between actual and predicted y values.
B)absolute deviations between actual and predicted y values.
C)absolute deviations between actual and predicted x values.
D)squared differences between actual and predicted y values
A)differences between actual and predicted y values.
B)absolute deviations between actual and predicted y values.
C)absolute deviations between actual and predicted x values.
D)squared differences between actual and predicted y values
فتح الحزمة
افتح القفل للوصول البطاقات البالغ عددها 71 في هذه المجموعة.
فتح الحزمة
k this deck
9
In the graph of the simple linear regression equation, the parameter represents the ___________ of the regression line.
A)slope
B)x-intercept
C)y-intercept
D)end-point
A)slope
B)x-intercept
C)y-intercept
D)end-point
فتح الحزمة
افتح القفل للوصول البطاقات البالغ عددها 71 في هذه المجموعة.
فتح الحزمة
k this deck
10
In the simple linear regression model, the ____________ accounts for the variability in the dependent variable that cannot be explained by the linear relationship between the variables.
A)constant term
B)error term
C)model parameter
D)residual
A)constant term
B)error term
C)model parameter
D)residual
فتح الحزمة
افتح القفل للوصول البطاقات البالغ عددها 71 في هذه المجموعة.
فتح الحزمة
k this deck
11
The ____________________ is a measure of the error that results from using the estimated regression equation to preduct the values of the dependent variable in the sample
A)sum of squares due to regression (SSR)
B)error term
C)sum of squares due to error (SSE)
D)residual
A)sum of squares due to regression (SSR)
B)error term
C)sum of squares due to error (SSE)
D)residual
فتح الحزمة
افتح القفل للوصول البطاقات البالغ عددها 71 في هذه المجموعة.
فتح الحزمة
k this deck
12
Prediction of the value of the dependent variable outside the experimental region is called
A)interpolation.
B)forecasting.
C)averaging.
D)extrapolation.
A)interpolation.
B)forecasting.
C)averaging.
D)extrapolation.
فتح الحزمة
افتح القفل للوصول البطاقات البالغ عددها 71 في هذه المجموعة.
فتح الحزمة
k this deck
13
In a simple linear regression analysis the quantity that gives the amount by which the dependent variable changes for a unit change in the independent variable is called the
A)coefficient of determination.
B)slope of the regression line.
C)correlation coefficient.
D)standard error.
A)coefficient of determination.
B)slope of the regression line.
C)correlation coefficient.
D)standard error.
فتح الحزمة
افتح القفل للوصول البطاقات البالغ عددها 71 في هذه المجموعة.
فتح الحزمة
k this deck
14
In a linear regression model, the variable (or variables) used for predicting or explaining values of the response variable are known as the ________________. It(they) is(are) denoted by x.
A)dependent variable
B)independent variable
C)residual variable
D)regression variable
A)dependent variable
B)independent variable
C)residual variable
D)regression variable
فتح الحزمة
افتح القفل للوصول البطاقات البالغ عددها 71 في هذه المجموعة.
فتح الحزمة
k this deck
15
_____ is a statistical procedure used to develop an equation showing how two variables are related.
A)Regression analysis
B)Data mining
C)Time series analysis
D)Factor analysis
A)Regression analysis
B)Data mining
C)Time series analysis
D)Factor analysis
فتح الحزمة
افتح القفل للوصول البطاقات البالغ عددها 71 في هذه المجموعة.
فتح الحزمة
k this deck
16
A procedure for using sample data to find the estimated regression equation is
A)point estimation.
B)interval estimation.
C)the least squares method.
D)extrapolation.
A)point estimation.
B)interval estimation.
C)the least squares method.
D)extrapolation.
فتح الحزمة
افتح القفل للوصول البطاقات البالغ عددها 71 في هذه المجموعة.
فتح الحزمة
k this deck
17
The difference between the observed value of the dependent variable and the value predicted using the estimated regression equation is known as the
A)constant term.
B)error term.
C)residual.
D)model parameter.
A)constant term.
B)error term.
C)residual.
D)model parameter.
فتح الحزمة
افتح القفل للوصول البطاقات البالغ عددها 71 في هذه المجموعة.
فتح الحزمة
k this deck
18
A regression analysis involving one independent variable and one dependent variable is referred to as a
A)factor analysis.
B)time series analysis.
C)simple linear regression.
D)data mining.
A)factor analysis.
B)time series analysis.
C)simple linear regression.
D)data mining.
فتح الحزمة
افتح القفل للوصول البطاقات البالغ عددها 71 في هذه المجموعة.
فتح الحزمة
k this deck
19
In a linear regression model, the variable that is being predicted or explained is known as _____________. It is denoted by y and is often referred to as the response variable.
A)dependent variable
B)independent variable
C)residual variable
D)regression variable
A)dependent variable
B)independent variable
C)residual variable
D)regression variable
فتح الحزمة
افتح القفل للوصول البطاقات البالغ عددها 71 في هذه المجموعة.
فتح الحزمة
k this deck
20
In the graph of the simple linear regression equation, the parameter is the ___________ of the regression line.
A)slope
B)x-intercept
C)y-intercept
D)end-point
A)slope
B)x-intercept
C)y-intercept
D)end-point
فتح الحزمة
افتح القفل للوصول البطاقات البالغ عددها 71 في هذه المجموعة.
فتح الحزمة
k this deck
21
Regression analysis involving one dependent variable and more than one independent variable is known as
A)simple regression.
B)linear regression.
C)multiple regression.
D)none of these.
A)simple regression.
B)linear regression.
C)multiple regression.
D)none of these.
فتح الحزمة
افتح القفل للوصول البطاقات البالغ عددها 71 في هذه المجموعة.
فتح الحزمة
k this deck
22
The ___________ is a measure of the goodness of fit of the estimated regression equation. It can be interpreted as the proportion of the variability in the dependent variable y that is explained by the estimated regression equation.
A)residual
B)coefficient of determination
C)dummy variable
D)interaction variable
A)residual
B)coefficient of determination
C)dummy variable
D)interaction variable
فتح الحزمة
افتح القفل للوصول البطاقات البالغ عددها 71 في هذه المجموعة.
فتح الحزمة
k this deck
23
______________ refers to the degree of correlation among independent variables in a regression model.
A)Multicollinearity
B)Tolerance
C)Rank
D)Confidence level
A)Multicollinearity
B)Tolerance
C)Rank
D)Confidence level
فتح الحزمة
افتح القفل للوصول البطاقات البالغ عددها 71 في هذه المجموعة.
فتح الحزمة
k this deck
24
A variable used to model the effect of categorical independent variables in a regression model is known as a
A)dependent variable.
B)response.
C)dummy variable.
D)predictor variable.
A)dependent variable.
B)response.
C)dummy variable.
D)predictor variable.
فتح الحزمة
افتح القفل للوصول البطاقات البالغ عددها 71 في هذه المجموعة.
فتح الحزمة
k this deck
25
__________________ refers to the use of sample data to calculate a range of values that is believed to include the value of the population parameter.
A)Interval estimation
B)Hypothesis testing
C)Statistical inference
D)Point estimation
A)Interval estimation
B)Hypothesis testing
C)Statistical inference
D)Point estimation
فتح الحزمة
افتح القفل للوصول البطاقات البالغ عددها 71 في هذه المجموعة.
فتح الحزمة
k this deck
26
What would be the coefficient of determination if the total sum of squares (SST) is 23.29 and the sum of squares due to regression (SSR) is 10.03?
A)2.32
B)0.43
C)0.19
D)0.89
A)2.32
B)0.43
C)0.19
D)0.89
فتح الحزمة
افتح القفل للوصول البطاقات البالغ عددها 71 في هذه المجموعة.
فتح الحزمة
k this deck
27
The scatter chart below displays the residuals verses the dependent variable, x. Which of the following conclusions can be drawn from the scatter chart given below?
A)The residuals have a increasing variance as the dependent variable increases.
B)The model captures the relationship between the variables accurately.
C)The regression model follows the standard normal probability distribution.
D)The residual distribution is consistently scattered about zero.
A)The residuals have a increasing variance as the dependent variable increases.
B)The model captures the relationship between the variables accurately.
C)The regression model follows the standard normal probability distribution.
D)The residual distribution is consistently scattered about zero.
فتح الحزمة
افتح القفل للوصول البطاقات البالغ عددها 71 في هذه المجموعة.
فتح الحزمة
k this deck
28
The scatter chart below displays the residuals verses the dependent variable, t. Which of the following conclusions can be drawn based upon this scatter chart?
A)model is time-invariant.
B)model captures the relationship between the variables accurately.
C)residuals are not independent.
D)residuals are normally distributed.
A)model is time-invariant.
B)model captures the relationship between the variables accurately.
C)residuals are not independent.
D)residuals are normally distributed.
فتح الحزمة
افتح القفل للوصول البطاقات البالغ عددها 71 في هذه المجموعة.
فتح الحزمة
k this deck
29
The process of making conjecture about the value of a population parameter, collecting sample data that can be used to assess this conjecture, measuring the strength of the evidence against the conjecture that is provided by the sample, and using these results to draw a conclusion about the conjecture is known as
A)postulation.
B)hypothesis testing.
C)statistical inference.
D)empirical research.
A)postulation.
B)hypothesis testing.
C)statistical inference.
D)empirical research.
فتح الحزمة
افتح القفل للوصول البطاقات البالغ عددها 71 في هذه المجموعة.
فتح الحزمة
k this deck
30
The process of making estimates and drawing conclusions about one or more characteristics of a population through analysis of sample data drawn from the population is known as
A)inductive inference.
B)deductive inference.
C)statistical inference.
D)Bayesian inference.
A)inductive inference.
B)deductive inference.
C)statistical inference.
D)Bayesian inference.
فتح الحزمة
افتح القفل للوصول البطاقات البالغ عددها 71 في هذه المجموعة.
فتح الحزمة
k this deck
31
________________ is used to test the hypothesis that the values of the regression parameters B0, B1, B2, ... Bq are all zero.
A)An F test
B)A t test
C)The least squares method
D)Extrapolation
A)An F test
B)A t test
C)The least squares method
D)Extrapolation
فتح الحزمة
افتح القفل للوصول البطاقات البالغ عددها 71 في هذه المجموعة.
فتح الحزمة
k this deck
32
Which of the following regression models is used to model a nonlinear relationship between the independent and dependent variables by including the independent variable and the square of the independent variable in the model?
A)a multiple regression model
B)quadratic regression model
C)a simple regression model
D)a least squares regression model
A)a multiple regression model
B)quadratic regression model
C)a simple regression model
D)a least squares regression model
فتح الحزمة
افتح القفل للوصول البطاقات البالغ عددها 71 في هذه المجموعة.
فتح الحزمة
k this deck
33
A variable used to model the effect of categorical independent variables in a regression model which generally takes only the value zero or one is called
A)a residual.
B)the coefficient of determination.
C)a dummy variable.
D)interaction.
A)a residual.
B)the coefficient of determination.
C)a dummy variable.
D)interaction.
فتح الحزمة
افتح القفل للوصول البطاقات البالغ عددها 71 في هذه المجموعة.
فتح الحزمة
k this deck
34
The coefficient of determination
A)takes values between -1 to +1.
B)is equal to zero for a perfect fit.
C)is equal to negative one for the poorest fit.
D)is used to evaluate the goodness of fit.
A)takes values between -1 to +1.
B)is equal to zero for a perfect fit.
C)is equal to negative one for the poorest fit.
D)is used to evaluate the goodness of fit.
فتح الحزمة
افتح القفل للوصول البطاقات البالغ عددها 71 في هذه المجموعة.
فتح الحزمة
k this deck
35
The _____________ is an indication of how frequently interval estimates based on samples of the same size taken from the same population using identical sampling techniques will contain the true value of the parameter we are estimating.
A)residual
B)tolerance factor
C)confidence level
D)accuracy level
A)residual
B)tolerance factor
C)confidence level
D)accuracy level
فتح الحزمة
افتح القفل للوصول البطاقات البالغ عددها 71 في هذه المجموعة.
فتح الحزمة
k this deck
36
The prespecified value of the independent variable at which its relationship with the dependent variable changes in a piecewise linear regression model is referred to as the
A)milestone.
B)knot.
C)tipping point.
D)watchpoint.
A)milestone.
B)knot.
C)tipping point.
D)watchpoint.
فتح الحزمة
افتح القفل للوصول البطاقات البالغ عددها 71 في هذه المجموعة.
فتح الحزمة
k this deck
37
The degree of correlation among independent variables in a regression model is called
A)multicollinearity.
B)interaction.
C)the coefficient of determination.
D)the sum of squared errors (SSE).
A)multicollinearity.
B)interaction.
C)the coefficient of determination.
D)the sum of squared errors (SSE).
فتح الحزمة
افتح القفل للوصول البطاقات البالغ عددها 71 في هذه المجموعة.
فتح الحزمة
k this deck
38
The scatter chart below displays the residuals verses the dependent variable, x. Which of the following conclusions can be drawn based upon this scatter chart?
A)The residuals have a constant variance.
B)The model fails to capture the relationship between the variables accurately.
C)The model over predicts the value of the dependent variable for small values and large values of the independent variable.
D)The residuals are normally distributed.
A)The residuals have a constant variance.
B)The model fails to capture the relationship between the variables accurately.
C)The model over predicts the value of the dependent variable for small values and large values of the independent variable.
D)The residuals are normally distributed.
فتح الحزمة
افتح القفل للوصول البطاقات البالغ عددها 71 في هذه المجموعة.
فتح الحزمة
k this deck
39
A normally distributed error term with mean of zero would
A)have values that are symmetric about the variance.
B)allow more accurate modeling.
C)yield biased regression estimates.
D)be a hyperbolic curve.
A)have values that are symmetric about the variance.
B)allow more accurate modeling.
C)yield biased regression estimates.
D)be a hyperbolic curve.
فتح الحزمة
افتح القفل للوصول البطاقات البالغ عددها 71 في هذه المجموعة.
فتح الحزمة
k this deck
40
The scatter chart below displays the residuals verses the dependent variable, x. Which of the following conclusions can be drawn based upon this scatter chart?
A)The residuals have a constant variance.
B)The model captures the relationship between the variables accurately.
C)The model underpredicts the value of the dependent variable for intermediate values of the independent variable.
D)The residual distribution is not normally distributed.
A)The residuals have a constant variance.
B)The model captures the relationship between the variables accurately.
C)The model underpredicts the value of the dependent variable for intermediate values of the independent variable.
D)The residual distribution is not normally distributed.
فتح الحزمة
افتح القفل للوصول البطاقات البالغ عددها 71 في هذه المجموعة.
فتح الحزمة
k this deck
41
Listed below is a company's sales in the period 2000 to 2011 along with the national income of the country, where the
business is set up. Test whether each of the regression parameters β0 and β1 is equal to zero at a 0.05 level of significance. What are the correct interpretations of the estimated regression parameters?
business is set up.
Test whether each of the regression parameters β0 and β1 is equal to zero at a 0.05 level of significance. What are the correct interpretations of the estimated regression parameters? فتح الحزمة
افتح القفل للوصول البطاقات البالغ عددها 71 في هذه المجموعة.
فتح الحزمة
k this deck
42
Listed below is data on profit and market capitalization for a sample of 15 different firms in U.S.
a. Develop a scatter chart for the above data. What does this chart indicate about the relationship between market capitalization and profit?
b. Use the data to develop an estimated regression equation that could be used to estimate a firm's profit based on its market capitalization. What is the estimated regression model?
c. What is the predicted profit for the market capitalization of 70,721.3 (million)?
فتح الحزمة
افتح القفل للوصول البطاقات البالغ عددها 71 في هذه المجموعة.
فتح الحزمة
k this deck
43
Listed below is a company's sales in the period 2000 to 2011 along with the national income of the country, where the
business is set up.
a. Develop a scatter chart for the above data. What does this chart indicate about the relationship between the
National Income and the Company's sales in the period 2000 to 2011?
b. Use the data to develop an estimated regression equation that could be used to estimate the company's sales
based on the national income. What is the estimated regression model?
فتح الحزمة
افتح القفل للوصول البطاقات البالغ عددها 71 في هذه المجموعة.
فتح الحزمة
k this deck
44
A survey conducted by a research team was to investigate how the education level, tenure in current employment, and age, are related to annual income. A sample 20 employees is selected and the data is given below.
a. Determine the estimated multiple linear regression equation that can be used to predict
the annual income given number of years school completed (Education), length of tenure
in current employment, and age.
b. Use the F test to determine the overall significance of the regression relationship.What is the conclusion at the 0.05 level of significance?
فتح الحزمة
افتح القفل للوصول البطاقات البالغ عددها 71 في هذه المجموعة.
فتح الحزمة
k this deck
45
__________ is the data set used to build the candidate models.
A)Range
B)Codomain
C)Validation set
D)Training set
A)Range
B)Codomain
C)Validation set
D)Training set
فتح الحزمة
افتح القفل للوصول البطاقات البالغ عددها 71 في هذه المجموعة.
فتح الحزمة
k this deck
46
_____________ refers to the scenario in which the relationship between the dependent variable and one independent variable is different at different values of a second independent variable.
A)Interaction
B)Multicollinearity
C)Autocorrelation
D)Covariance
A)Interaction
B)Multicollinearity
C)Autocorrelation
D)Covariance
فتح الحزمة
افتح القفل للوصول البطاقات البالغ عددها 71 في هذه المجموعة.
فتح الحزمة
k this deck
47
A researcher wanted to study effect of two factors, x1 and x2, on yield (y). The observations are given below.
a. Develop an estimated linear regression equation with the factor x1 as the independent variable.Test for a significant relationship between factor x1 and yield at the 0.05 level of significance.
b. How much of the variation in the sample values of yield does the model in part (a) explain?
a. Develop an estimated linear regression equation with the factor x1 as the independent variable.Test for a significant relationship between factor x1 and yield at the 0.05 level of significance.
b. How much of the variation in the sample values of yield does the model in part (a) explain?
فتح الحزمة
افتح القفل للوصول البطاقات البالغ عددها 71 في هذه المجموعة.
فتح الحزمة
k this deck
48
A research team in at the Gonzaga University is interested in predicting a student's overall university GPA if his/her high school GPA is known. Assume that a random sample of 20 students is selected from the data listed below.
a. Develop a scatter chart for these data with High School GPA as the independent variable.What does the scatter chart indicate about the relationship between high school GPAs and overall university GPA?
b. Develop an estimated regression equation showing how high school GPA is related to overall university GPA.What is the estimated regression model?
c. What is the predicted overall university GPA of Sophia, a student who has been admitted to Gonzaga
University, with 3.40 high school GPA?
فتح الحزمة
افتح القفل للوصول البطاقات البالغ عددها 71 في هذه المجموعة.
فتح الحزمة
k this deck
49
Fitting a model too closely to sample data, resulting in a model that does not accurately reflect the population is termed as
A)approximation.
B)hypothesizing.
C)overfitting.
D)postulating.
A)approximation.
B)hypothesizing.
C)overfitting.
D)postulating.
فتح الحزمة
افتح القفل للوصول البطاقات البالغ عددها 71 في هذه المجموعة.
فتح الحزمة
k this deck
50
A research center is interested in investigating about height and age of children who are between 5 to 9 years old.
In order to do this, a sample of 15 children is selected and the data is given below.
a. Develop a scatter chart with age as the independent variable. What does the scatter chart indicate about the relationship between the height and age of children?
b. Use the data to develop an estimated regression equation that could be used to estimate the height based on the age. What is the estimated regression model?
c. How much of the variation in the sample values of height does the model estimated in part (b) explain?
In order to do this, a sample of 15 children is selected and the data is given below.
a. Develop a scatter chart with age as the independent variable. What does the scatter chart indicate about the relationship between the height and age of children?
b. Use the data to develop an estimated regression equation that could be used to estimate the height based on the age. What is the estimated regression model?
c. How much of the variation in the sample values of height does the model estimated in part (b) explain?
فتح الحزمة
افتح القفل للوصول البطاقات البالغ عددها 71 في هذه المجموعة.
فتح الحزمة
k this deck
51
A researcher wanted to study effect of two factors, x1 and x2, on yield (y). The observations are given below.
a. Develop an estimated regression equation with both factors x1 and x2 as the independent variables. Is the overall regression statistically significant at the 0.05 level of significance? If so, then test whether each of the regression parameters β0, β1, and β2 is equal to zero at a 0.01 level of significance. What are the correct interpretations of the estimated regression parameters?
b. How much of the variation in the sample values of y does the model in part (a) explain?
فتح الحزمة
افتح القفل للوصول البطاقات البالغ عددها 71 في هذه المجموعة.
فتح الحزمة
k this deck
52
A survey conducted by a research team was to investigate how the education level, tenure in current employment, and age, are related to annual income. A sample 20 employees is selected and the data is given below.
a. Check if the F test leads to conclude that an overall regression relationship exists. If yes, use the t test to
determine the significance of each independent variable. What is the conclusion for each test at the 0.05 level of significance?
b. Remove all independent variables that are not significant at the 0.05 level of significance from the estimated
regression equation. What is your estimated regression equation in this case?
فتح الحزمة
افتح القفل للوصول البطاقات البالغ عددها 71 في هذه المجموعة.
فتح الحزمة
k this deck
53
Assessing the regression model on data other than the sample data that was used to generate the model is known as
A)approximation.
B)cross-validation.
C)graphical validation.
D)postulation.
A)approximation.
B)cross-validation.
C)graphical validation.
D)postulation.
فتح الحزمة
افتح القفل للوصول البطاقات البالغ عددها 71 في هذه المجموعة.
فتح الحزمة
k this deck
54
A student is interested in studying the impact of number of books referred by students on a statistics course and the number of lectures they attended on the final grade on the course. A sample of 25 students is selected and the data is given below.
a. Develop an estimated regression equation using number of books referred and the number of lectures attended to predict the final grade on the course.
b. Joseph referred 4 books and attended 19 lectures. What is his predicted final score on the course?
a. Develop an estimated regression equation using number of books referred and the number of lectures attended to predict the final grade on the course.
b. Joseph referred 4 books and attended 19 lectures. What is his predicted final score on the course?
فتح الحزمة
افتح القفل للوصول البطاقات البالغ عددها 71 في هذه المجموعة.
فتح الحزمة
k this deck
55
A student is interested in studying the impact of number of books referred by students on a statistics course and the number of lectures they attended on the final grade on the course. A sample of 25 students is selected and the data is given below.
a. Use the F test to determine the overall significance of the relationship. What is your conclusion
at the 0.05 level of significance? Use the t test to determine the significance of each independent
variable? What are your conclusions at the 0.05 level of significance?
b. How much of the variation in the final grade does the model in part (a) explain?
فتح الحزمة
افتح القفل للوصول البطاقات البالغ عددها 71 في هذه المجموعة.
فتح الحزمة
k this deck
56
_____________ refers to the data set used to compare model forecasts and ultimately pick a model for predicting values of the dependent variable.
A)Codomain
B)Training set
C)Validation set
D)Range
A)Codomain
B)Training set
C)Validation set
D)Range
فتح الحزمة
افتح القفل للوصول البطاقات البالغ عددها 71 في هذه المجموعة.
فتح الحزمة
k this deck
57
The data listed below is the average personal income and personal consumption expenditures based on the survey
conducted in the year 1995 to 2009 in U.S.
a. Develop a scatter chart for the above data. What does this chart indicate about the relationship between average
personal income and personal consumption expenditure?
b. Develop an estimated regression equation showing how personal consumption expenditure is related personal
income.
c. What proportion of variation in the sample values of proportion of personal consumption expenditure does this
model explain?
فتح الحزمة
افتح القفل للوصول البطاقات البالغ عددها 71 في هذه المجموعة.
فتح الحزمة
k this deck
58
A survey is conducted to determine whether the age of car influences the annual maintenance cost. A sample of 10
cars is selected and the data is shown below.
a. Develop a scatter chart for these data with age of cars as the independent variable. What does the scatter chart
indicate about the relationship between age of a car and the annual maintenance cost?
b. Use the data to develop an estimated regression equation that could be used to predict the annual maintenance
cost given the age of the car. What is the estimated regression model?
cars is selected and the data is shown below.
a. Develop a scatter chart for these data with age of cars as the independent variable. What does the scatter chart
indicate about the relationship between age of a car and the annual maintenance cost?
b. Use the data to develop an estimated regression equation that could be used to predict the annual maintenance
cost given the age of the car. What is the estimated regression model?
فتح الحزمة
افتح القفل للوصول البطاقات البالغ عددها 71 في هذه المجموعة.
فتح الحزمة
k this deck
59
The data listed below is the average personal income and personal consumption expenditures based on the survey
conducted in the year 1995 to 2009 in U.S.
a. What is the 95 percent confidence interval for the regression parameter β1? Based on this interval, what
conclusion can you make about the hypotheses that the regression parameter β1 is equal to zero?
d. What is the 95 percent confidence interval for the regression parameter β0? Based on this interval, what
conclusion can you make about the hypotheses that the regression parameter β0 is equal to zero?
فتح الحزمة
افتح القفل للوصول البطاقات البالغ عددها 71 في هذه المجموعة.
فتح الحزمة
k this deck
60
A survey is conducted to determine whether the age of car influences the annual maintenance cost. A sample of 10 cars is selected and the data is shown below.
a. Test whether each of the regression parameters β0 and β1 is equal to zero at a 0.05 level of significance.
b. Interpret the estimated regression parameters? Are these interpretations reasonable?
a. Test whether each of the regression parameters β0 and β1 is equal to zero at a 0.05 level of significance.
b. Interpret the estimated regression parameters? Are these interpretations reasonable?
فتح الحزمة
افتح القفل للوصول البطاقات البالغ عددها 71 في هذه المجموعة.
فتح الحزمة
k this deck
61
Consider the below data which is based on a company's sales in the period 2000 to 2011 along with the national income of the country, where the business is set up.
a. Develop a scatter chart for these data, treating the national income as the independent variable. Does a simple linear regression model appear to be appropriate?
b. Develop an appropriate estimated regression equation to predict the company's sales, given the national income. How much variation in the sample values of company's sales is explained by this regression model
فتح الحزمة
افتح القفل للوصول البطاقات البالغ عددها 71 في هذه المجموعة.
فتح الحزمة
k this deck
62
The multiple regression model represents pricing for residential housing in a certain market. Predicted Price = 19,856.56 + 6985.25 bedrooms + 87.53 square foot. A house in the local market has 4 bedrooms and 2500 square feet of living area. Use the multiple regression model to determine the predicted price.
فتح الحزمة
افتح القفل للوصول البطاقات البالغ عددها 71 في هذه المجموعة.
فتح الحزمة
k this deck
63
A production company is studying the relationship between the average cost/unit and number of units produced in a batch. A sample of 10 batches is selected and the data is given below.
a. Develop an estimated quadratic regression equation for the data. How much variation in the sample values of cost/unit does this regression model explain?
b. Is the overall regression relationship significant at a 0.05 level of significance? If so, then test the relationship between the independent variable and the dependent variable at a 0.05 level of significance.
فتح الحزمة
افتح القفل للوصول البطاقات البالغ عددها 71 في هذه المجموعة.
فتح الحزمة
k this deck
64
A multiple regression model has the form = 10 + 2 x1 + 12 x2. As x1 increases by 1 unit (holding x2 constant), is expected to increase by how many units?
= 10 + 2 x1 + 12 x2. As x1 increases by 1 unit (holding x2 constant), is expected to increase by how many units? فتح الحزمة
افتح القفل للوصول البطاقات البالغ عددها 71 في هذه المجموعة.
فتح الحزمة
k this deck
65
The multiple regression model represents pricing for residential housing in a certain market. Predicted Price ̂ = 19,856.56 + 6,985.25 bedrooms + 87.53 square foot. A house in the local market has 5 bedrooms and 3,200 square feet of living area. Use the multiple regression model to determine the price and the residual if the house sells for $352,200.
فتح الحزمة
افتح القفل للوصول البطاقات البالغ عددها 71 في هذه المجموعة.
فتح الحزمة
k this deck
66
A production company is studying the relationship between the average cost/unit and number of units produced in a batch. A sample of 10 batches is selected and the data is given below.
a. Develop a scatter chart for these data. What does the scatter chart indicate about the relationship between average cost/unit and number of units produced?
b. Regardless of your answer to part (a), develop an estimated simple linear regression equation for the data. How much variation in the sample values of cost/unit is explained by this regression model?
فتح الحزمة
افتح القفل للوصول البطاقات البالغ عددها 71 في هذه المجموعة.
فتح الحزمة
k this deck
67
Give an estimated simple linear regression equation of = 46.2 + 589.2x with a coefficient of determination R^2 of 0.7523, interpret the coefficient of determination for this equation.
= 46.2 + 589.2x with a coefficient of determination R^2 of 0.7523, interpret the coefficient of determination for this equation.
فتح الحزمة
افتح القفل للوصول البطاقات البالغ عددها 71 في هذه المجموعة.
فتح الحزمة
k this deck
68
The multiple regression model represents pricing for residential housing in a certain market. Predicted Price ̂ = 19,856.56 + 6,985.25 bedrooms + 87.53 square foot. A house in the local market has 4 bedrooms and 2,200 square feet of living area. Use the multiple regression model to determine the predicted price.
فتح الحزمة
افتح القفل للوصول البطاقات البالغ عددها 71 في هذه المجموعة.
فتح الحزمة
k this deck
69
The multiple regression model represents pricing for residential housing in a certain market. Predicted Price ̂ = 19,856.56 + 6,985.25 bedrooms + 87.53 square foot. A house in the local market has 5 bedrooms and 3,500 square feet of living area. Use the multiple regression model to determine the predicted price and the residual if the house sells for $360,200.
فتح الحزمة
افتح القفل للوصول البطاقات البالغ عددها 71 في هذه المجموعة.
فتح الحزمة
k this deck
70
Given the partial Excel output from a multiple regression, formulate the regression model.
فتح الحزمة
افتح القفل للوصول البطاقات البالغ عددها 71 في هذه المجموعة.
فتح الحزمة
k this deck
71
A multiple regression model has for predicted heart rate is as follows: heart rate = 10 - 0.4 run speed + 12 body weight. As the run speed increases by 1 unit (holding body weight constant), heart weight is expected to increase by how much?
فتح الحزمة
افتح القفل للوصول البطاقات البالغ عددها 71 في هذه المجموعة.
فتح الحزمة
k this deck
فتح الحزمة
افتح القفل للوصول البطاقات البالغ عددها 71 في هذه المجموعة.


