Deck 4: Correlation and Regression
ملء الشاشة (f)
سؤال
سؤال
سؤال
سؤال
سؤال
سؤال
سؤال
سؤال
سؤال
How much should a healthy Shetland pony weigh? Let x be the age of the pony (in months), and let y be the average weight of the pony (in kilograms). Suppose a random sample of ponies gave the following information. Make a scatter diagram for the data. Draw the line that best fits the data.
A)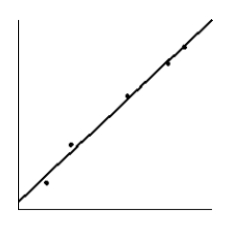
B)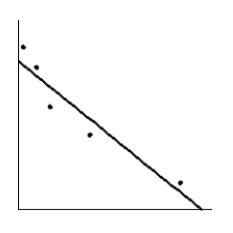
C)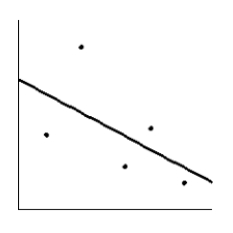
D)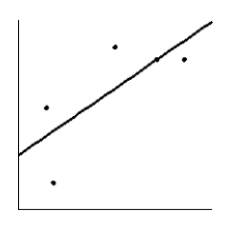
E)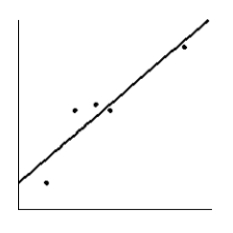
A)
B)
C)
D)
E)
سؤال
سؤال
سؤال
سؤال
سؤال
سؤال
Is the magnitude of an earthquake related to the depth below the surface at which the quake occurs? Let x be the magnitude of an earthquake (on the Richter scale), and let y be the depth (in kilometers) of the quake below the surface at the epicenter. Suppose a random sample of earthquakes gave the following information. Draw the line that best fits the data whose scatter diagram is given below.
A)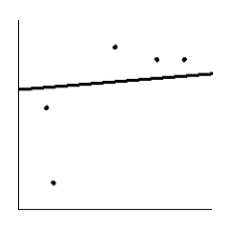
B)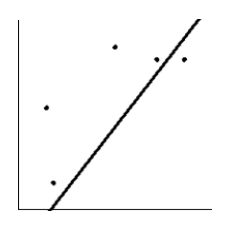
C)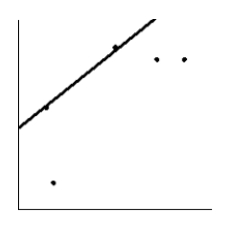
D)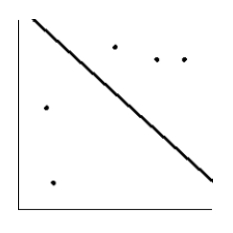
E)
A)
B)
C)
D)
E)
سؤال
سؤال
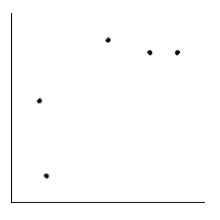
Is the magnitude of an earthquake related to the depth below the surface at which the quake occurs? Let x be the magnitude of an earthquake (on the Richter scale), and let y be the depth (in kilometers) of the quake below the surface at the epicenter. Suppose a random sample of earthquakes gave the following information. Make a scatter diagram for the data.
A)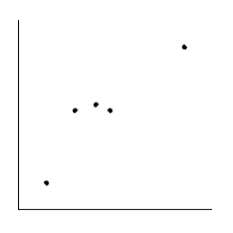
B)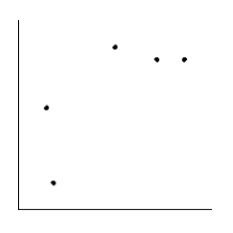
C)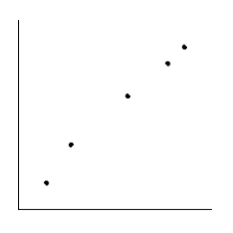
D)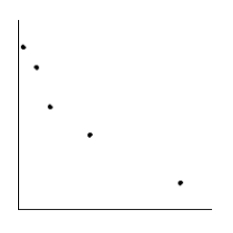
E)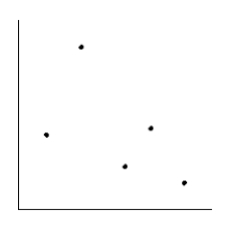
A)
B)
C)
D)
E)

فتح الحزمة
قم بالتسجيل لفتح البطاقات في هذه المجموعة!
Unlock Deck
Unlock Deck
1/17
العب
ملء الشاشة (f)
Deck 4: Correlation and Regression
1
It is thought that prehistoric Indians did not take their best tools, pottery, and household items when they visited higher elevations for their summer camps. It is hypothesized that archaeological sites tend to lose their cultural identity and specific cultural affiliation as the elevation of the site increases. Let x be the elevation (in thousands of feet) for an archaeological site in the southwestern United States. Let y be the percentage of unidentified artifacts (no specific cultural affiliation) at a given elevation. Suppose that the following data were obtained for a collection of archaeological sites in New Mexico: Find a for the equation of the least-squares line .
A)-12.913
B)-0.017
C)0.001
D)0.017
E)12.913
A)-12.913
B)-0.017
C)0.001
D)0.017
E)12.913
12.913
2
It is thought that prehistoric Indians did not take their best tools, pottery, and household items when they visited higher elevations for their summer camps. It is hypothesized that archaeological sites tend to lose their cultural identity and specific cultural affiliation as the elevation of the site increases. Let x be the elevation (in thousands of feet) for an archaeological site in the southwestern United States. Let y be the percentage of unidentified artifacts (no specific cultural affiliation) at a given elevation. Suppose that the following data were obtained for a collection of archaeological sites in New Mexico: What percentage of the variation in y can be explained by the corresponding variation in x and the least-squares line?
A)68.8%
B)2.9%
C)83.0%
D)17.0%
E)31.2%
A)68.8%
B)2.9%
C)83.0%
D)17.0%
E)31.2%
68.8%
3
It is thought that prehistoric Indians did not take their best tools, pottery, and household items when they visited higher elevations for their summer camps. It is hypothesized that archaeological sites tend to lose their cultural identity and specific cultural affiliation as the elevation of the site increases. Let x be the elevation (in thousands of feet) for an archaeological site in the southwestern United States. Let y be the percentage of unidentified artifacts (no specific cultural affiliation) at a given elevation. Suppose that the following data were obtained for a collection of archaeological sites in New Mexico: Calculate the sample correlation coefficient r.
A)-0.093
B)0.097
C)0.093
D)0.907
E)0.903
A)-0.093
B)0.097
C)0.093
D)0.907
E)0.903
0.903
4
It is thought that prehistoric Indians did not take their best tools, pottery, and household items when they visited higher elevations for their summer camps. It is hypothesized that archaeological sites tend to lose their cultural identity and specific cultural affiliation as the elevation of the site increases. Let x be the elevation (in thousands of feet) for an archaeological site in the southwestern United States. Let y be the percentage of unidentified artifacts (no specific cultural affiliation) at a given elevation. Suppose that the following data were obtained for a collection of archaeological sites in New Mexico: Find b for the equation of the least-squares line .
A)184.464
B)58.064
C)-1163.511
D)-58.064
E)-184.464
A)184.464
B)58.064
C)-1163.511
D)-58.064
E)-184.464
فتح الحزمة
افتح القفل للوصول البطاقات البالغ عددها 17 في هذه المجموعة.
فتح الحزمة
k this deck
5
Let x be the average number of employees in a group health insurance plan, and let y be the average administrative cost as a percentage of claims. Suppose a random sample of employees gave the following information. As x increases, does the value of r imply that y should tend to increase, decrease, or remain the same? Explain.
A)Since r is positive, as x increases, y increases.
B)Since r is negative, as x increases, y increases.
C)Since r is positive, as x increases, y remains the same.
D)Since r is negative, as x increases, y decreases.
E)Since r is zero, as x increases, y decreases.
A)Since r is positive, as x increases, y increases.
B)Since r is negative, as x increases, y increases.
C)Since r is positive, as x increases, y remains the same.
D)Since r is negative, as x increases, y decreases.
E)Since r is zero, as x increases, y decreases.
فتح الحزمة
افتح القفل للوصول البطاقات البالغ عددها 17 في هذه المجموعة.
فتح الحزمة
k this deck
6
In baseball, is there a linear correlation between batting average and home run percentage? Let x represent the batting average of a professional baseball player. Let y represent the home run percentage (number of home runs per 100 times at bat). Suppose a random sample of baseball players gave the following information. Compute r.
A)0.001
B)0.923
C)-0.923
D)-0.001
E)none of these choices
A)0.001
B)0.923
C)-0.923
D)-0.001
E)none of these choices
فتح الحزمة
افتح القفل للوصول البطاقات البالغ عددها 17 في هذه المجموعة.
فتح الحزمة
k this deck
7
Is the magnitude of an earthquake related to the depth below the surface at which the quake occurs? Let x be the magnitude of an earthquake (on the Richter scale), and let y be the depth (in kilometers) of the quake below the surface at the epicenter. Suppose a random sample of earthquakes gave the following information. Would you say the correlation is low, moderate, or strong? Positive or negative? If necessary, draw a scatter diagram of the given data.
A)moderate and positive
B)moderate and negative
C)low and positive
D)strong and positive
E)strong and negative
A)moderate and positive
B)moderate and negative
C)low and positive
D)strong and positive
E)strong and negative
فتح الحزمة
افتح القفل للوصول البطاقات البالغ عددها 17 في هذه المجموعة.
فتح الحزمة
k this deck
8
It is thought that prehistoric Indians did not take their best tools, pottery, and household items when they visited higher elevations for their summer camps. It is hypothesized that archaeological sites tend to lose their cultural identity and specific cultural affiliation as the elevation of the site increases. Let x be the elevation (in thousands of feet) for an archaeological site in the southwestern United States. Let y be the percentage of unidentified artifacts (no specific cultural affiliation) at a given elevation. Suppose that the following data were obtained for a collection of archaeological sites in New Mexico: Find the value of the coefficient of determination r2.
A)0.854
B)-0.270
C)0.730
D)-0.730
E)-0.854
A)0.854
B)-0.270
C)0.730
D)-0.730
E)-0.854
فتح الحزمة
افتح القفل للوصول البطاقات البالغ عددها 17 في هذه المجموعة.
فتح الحزمة
k this deck
9
How much should a healthy Shetland pony weigh? Let x be the age of the pony (in months), and let y be the average weight of the pony (in kilograms). Suppose a random sample of ponies gave the following information. Make a scatter diagram for the data. Draw the line that best fits the data.
A)
B)
C)
D)
E)
A)
B)
C)
D)
E)
فتح الحزمة
افتح القفل للوصول البطاقات البالغ عددها 17 في هذه المجموعة.
فتح الحزمة
k this deck
10
Can a low barometer reading be used to predict maximum wind speed of an approaching tropical cyclone? Let x be the lowest pressure (in millibars) as a cyclone approaches, and let y be the maximum wind speed (in miles per hour) of the cyclone. Suppose a random sample of cyclones gave the following information. Given that the value of r is -0.556, should y increase as x increases, does the value of r imply that y should tend to increase, decrease, or remain the same? Explain.
A)Since r is zero, as x increases, y remains the same.
B)Since r is negative, as x increases, y decreases.
C)Since r is negative, as x increases, y increases.
D)Since r is positive, as x increases, y increases.
E)Since r is positive, as x increases, y decreases.
A)Since r is zero, as x increases, y remains the same.
B)Since r is negative, as x increases, y decreases.
C)Since r is negative, as x increases, y increases.
D)Since r is positive, as x increases, y increases.
E)Since r is positive, as x increases, y decreases.
فتح الحزمة
افتح القفل للوصول البطاقات البالغ عددها 17 في هذه المجموعة.
فتح الحزمة
k this deck
11
It is thought that prehistoric Indians did not take their best tools, pottery, and household items when they visited higher elevations for their summer camps. It is hypothesized that archaeological sites tend to lose their cultural identity and specific cultural affiliation as the elevation of the site increases. Let x be the elevation (in thousands of feet) for an archaeological site in the southwestern United States. Let y be the percentage of unidentified artifacts (no specific cultural affiliation) at a given elevation. Suppose that the following data were obtained for a collection of archaeological sites in New Mexico: Find .
A)65.75
B)-47.40
C)-65.75
D)63.00
E)-63.00
A)65.75
B)-47.40
C)-65.75
D)63.00
E)-63.00
فتح الحزمة
افتح القفل للوصول البطاقات البالغ عددها 17 في هذه المجموعة.
فتح الحزمة
k this deck
12
It is thought that prehistoric Indians did not take their best tools, pottery, and household items when they visited higher elevations for their summer camps. It is hypothesized that archaeological sites tend to lose their cultural identity and specific cultural affiliation as the elevation of the site increases. Let x be the elevation (in thousands of feet) for an archaeological site in the southwestern United States. Let y be the percentage of unidentified artifacts (no specific cultural affiliation) at a given elevation. Suppose that the following data were obtained for a collection of archaeological sites in New Mexico: Find the equation of the least squares line .
A)
B)
C)
D)
E)
A)
B)
C)
D)
E)
فتح الحزمة
افتح القفل للوصول البطاقات البالغ عددها 17 في هذه المجموعة.
فتح الحزمة
k this deck
13
It is thought that prehistoric Indians did not take their best tools, pottery, and household items when they visited higher elevations for their summer camps. It is hypothesized that archaeological sites tend to lose their cultural identity and specific cultural affiliation as the elevation of the site increases. Let x be the elevation (in thousands of feet) for an archaeological site in the southwestern United States. Let y be the percentage of unidentified artifacts (no specific cultural affiliation) at a given elevation. Suppose that the following data were obtained for a collection of archaeological sites in New Mexico: What percentage of the variation in y cannot be explained by the corresponding variation in x and the least-squares line?
A)25.5%
B)44.4%
C)55.6%
D)19.7%
E)74.5%
A)25.5%
B)44.4%
C)55.6%
D)19.7%
E)74.5%
فتح الحزمة
افتح القفل للوصول البطاقات البالغ عددها 17 في هذه المجموعة.
فتح الحزمة
k this deck
14
It is thought that prehistoric Indians did not take their best tools, pottery, and household items when they visited higher elevations for their summer camps. It is hypothesized that archaeological sites tend to lose their cultural identity and specific cultural affiliation as the elevation of the site increases. Let x be the elevation (in thousands of feet) for an archaeological site in the southwestern United States. Let y be the percentage of unidentified artifacts (no specific cultural affiliation) at a given elevation. Suppose that the following data were obtained for a collection of archaeological sites in New Mexico: At an archaeological site with elevation 7.5 (thousand feet), what does the least-squares equation forecast for the percentage of culturally unidentified artifacts?
A)82.6%
B)87.9%
C)17.4%
D)12.1%
E)27.9%
A)82.6%
B)87.9%
C)17.4%
D)12.1%
E)27.9%
فتح الحزمة
افتح القفل للوصول البطاقات البالغ عددها 17 في هذه المجموعة.
فتح الحزمة
k this deck
15
Is the magnitude of an earthquake related to the depth below the surface at which the quake occurs? Let x be the magnitude of an earthquake (on the Richter scale), and let y be the depth (in kilometers) of the quake below the surface at the epicenter. Suppose a random sample of earthquakes gave the following information. Draw the line that best fits the data whose scatter diagram is given below.
A)
B)
C)
D)
E)
A)
B)
C)
D)
E)
فتح الحزمة
افتح القفل للوصول البطاقات البالغ عددها 17 في هذه المجموعة.
فتح الحزمة
k this deck
16
It is thought that prehistoric Indians did not take their best tools, pottery, and household items when they visited higher elevations for their summer camps. It is hypothesized that archaeological sites tend to lose their cultural identity and specific cultural affiliation as the elevation of the site increases. Let x be the elevation (in thousands of feet) for an archaeological site in the southwestern United States. Let y be the percentage of unidentified artifacts (no specific cultural affiliation) at a given elevation. Suppose that the following data were obtained for a collection of archaeological sites in New Mexico: Find .
A)7.10
B)-7.10
C)-7.44
D)5.50
E)-5.50
A)7.10
B)-7.10
C)-7.44
D)5.50
E)-5.50
فتح الحزمة
افتح القفل للوصول البطاقات البالغ عددها 17 في هذه المجموعة.
فتح الحزمة
k this deck
17
Is the magnitude of an earthquake related to the depth below the surface at which the quake occurs? Let x be the magnitude of an earthquake (on the Richter scale), and let y be the depth (in kilometers) of the quake below the surface at the epicenter. Suppose a random sample of earthquakes gave the following information. Make a scatter diagram for the data.
A)
B)
C)
D)
E)
A)
B)
C)
D)
E)
فتح الحزمة
افتح القفل للوصول البطاقات البالغ عددها 17 في هذه المجموعة.
فتح الحزمة
k this deck
فتح الحزمة
افتح القفل للوصول البطاقات البالغ عددها 17 في هذه المجموعة.


