Deck 13: Correlation: Understanding Covariation
ملء الشاشة (f)
سؤال
سؤال
سؤال
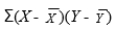
13-20 The CPXY is given by. 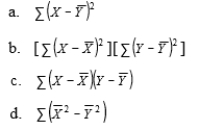
سؤال
سؤال
سؤال
سؤال
سؤال
سؤال
سؤال
سؤال
سؤال
سؤال
سؤال
سؤال
سؤال
سؤال
13-18 When calculating the Pearson correlation coefficient, is called the of 

 X and Y.
A)sum of squares
B)cross products
C)standard deviation
D)correlation
X and Y.A)sum of squares
B)cross products
C)standard deviation
D)correlation
سؤال
سؤال
سؤال
سؤال
سؤال
سؤال
سؤال
سؤال
سؤال
سؤال
سؤال
سؤال
سؤال
سؤال
سؤال
سؤال
سؤال
سؤال
13-21 The denominator of the Pearson r is. 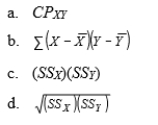
سؤال
سؤال
سؤال
سؤال
سؤال
سؤال
سؤال
13-48 The extent to which two variables share common variance is estimated by. 
سؤال
سؤال
سؤال
سؤال
سؤال
سؤال
سؤال
سؤال
سؤال
13-49 The value of is a measure of the. 
A)extent to which two variables share a common variance
B)precision with which one variable predicts the value of the other
C)degree of linear association between two variables
D)degree of nonlinear association between two variables
A)extent to which two variables share a common variance
B)precision with which one variable predicts the value of the other
C)degree of linear association between two variables
D)degree of nonlinear association between two variables
سؤال
سؤال
سؤال
سؤال
سؤال
سؤال
13-47 The proportion of variance in one variable that is associated with variance in the other variable is given by. 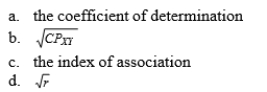
سؤال
سؤال
13-52 If the coefficient of determination equals .49, then r equals. 
سؤال
سؤال
سؤال
سؤال
سؤال
سؤال
سؤال
سؤال
سؤال
سؤال
سؤال
سؤال
سؤال
سؤال
سؤال
سؤال
سؤال

فتح الحزمة
قم بالتسجيل لفتح البطاقات في هذه المجموعة!
Unlock Deck
Unlock Deck
1/76
العب
ملء الشاشة (f)
Deck 13: Correlation: Understanding Covariation
1
13-12 If values of one variable in a scatterplot increase while the values of the other decrease, then the relationship is described as.
A)direct
B)indirect
C)positive
D)negative
A)direct
B)indirect
C)positive
D)negative
D
2
13-14 The Pearson correlation coefficient is used.
A)to quantify the relationship between two variables in a bivariate distribution
B)to quantify the relationship between two variables in a one-variable distribution
C)when pairs of scores achieve ordinal measurement
D)to test a null hypothesis about the means in a bivariate distribution
A)to quantify the relationship between two variables in a bivariate distribution
B)to quantify the relationship between two variables in a one-variable distribution
C)when pairs of scores achieve ordinal measurement
D)to test a null hypothesis about the means in a bivariate distribution
A
3
13-20 The CPXY is given by.
C
4
13-11 Relationships between two variables that can be described by a straight line are called relationships.
A)direct
B)normal
C)correlational
D)linear
A)direct
B)normal
C)correlational
D)linear
فتح الحزمة
افتح القفل للوصول البطاقات البالغ عددها 76 في هذه المجموعة.
فتح الحزمة
k this deck
5
If two variables covary, then.
A)a change in one variable is not accompanied by a consistent change in the other variable
B)as one variable increases, the other must decrease
C)a change in one variable is accompanied by a consistent change in the other variable
D)the two variables have the same mean
A)a change in one variable is not accompanied by a consistent change in the other variable
B)as one variable increases, the other must decrease
C)a change in one variable is accompanied by a consistent change in the other variable
D)the two variables have the same mean
فتح الحزمة
افتح القفل للوصول البطاقات البالغ عددها 76 في هذه المجموعة.
فتح الحزمة
k this deck
6
13-15 The Pearson correlation coefficient is symbolized as.
A)R
B)r
C)P
D)PC
A)R
B)r
C)P
D)PC
فتح الحزمة
افتح القفل للوصول البطاقات البالغ عددها 76 في هذه المجموعة.
فتح الحزمة
k this deck
7
A plot or graph of the relationship between two variables is known as a.
A)scatterplot
B)histogram
C)bimodal distribution
D)correlational plot
A)scatterplot
B)histogram
C)bimodal distribution
D)correlational plot
فتح الحزمة
افتح القفل للوصول البطاقات البالغ عددها 76 في هذه المجموعة.
فتح الحزمة
k this deck
8
13-10 A linear relationship between two variables can be described by a.
A)right angle
B)straight line
C)mean and standard deviation
D)curved line
A)right angle
B)straight line
C)mean and standard deviation
D)curved line
فتح الحزمة
افتح القفل للوصول البطاقات البالغ عددها 76 في هذه المجموعة.
فتح الحزمة
k this deck
9
When two scores are obtained from each participant, a distribution is obtained.
A)normal
B)one variable
C)bivariate
D)straight line
A)normal
B)one variable
C)bivariate
D)straight line
فتح الحزمة
افتح القفل للوصول البطاقات البالغ عددها 76 في هذه المجموعة.
فتح الحزمة
k this deck
10
If two variables are related so that increasing values of one variable are associated with increasing values of the other, then there is a (or ) relationship between the variables.
A)positive; direct
B)positive; inverse
C)negative; direct
D)negative; inverse
A)positive; direct
B)positive; inverse
C)negative; direct
D)negative; inverse
فتح الحزمة
افتح القفل للوصول البطاقات البالغ عددها 76 في هذه المجموعة.
فتح الحزمة
k this deck
11
If two variables are related so that as values of one variable increase the values of the other also increase, then the relationship is said to be.
A)positive
B)negative
C)inverse
D)indirect
A)positive
B)negative
C)inverse
D)indirect
فتح الحزمة
افتح القفل للوصول البطاقات البالغ عددها 76 في هذه المجموعة.
فتح الحزمة
k this deck
12
A scatterplot is a graph of a distribution.
A)one variable
B)normal
C)bimodal
D)bivariate
A)one variable
B)normal
C)bimodal
D)bivariate
فتح الحزمة
افتح القفل للوصول البطاقات البالغ عددها 76 في هذه المجموعة.
فتح الحزمة
k this deck
13
13-16 The Pearson correlation coefficient is used.
A)to quantify the relationship between two variables in a one-variable distribution
B)to determine the amount of variability in a set of scores
C)when pairs of scores achieve either interval or ratio measurement
D)to test a null hypothesis about the means in a bivariate distribution
A)to quantify the relationship between two variables in a one-variable distribution
B)to determine the amount of variability in a set of scores
C)when pairs of scores achieve either interval or ratio measurement
D)to test a null hypothesis about the means in a bivariate distribution
فتح الحزمة
افتح القفل للوصول البطاقات البالغ عددها 76 في هذه المجموعة.
فتح الحزمة
k this deck
14
13-19 The cross products of X and Y are symbolized by.
A)CPXY
B)Cross XY
C)XProd
D)XPXY
A)CPXY
B)Cross XY
C)XProd
D)XPXY
فتح الحزمة
افتح القفل للوصول البطاقات البالغ عددها 76 في هذه المجموعة.
فتح الحزمة
k this deck
15
The direction and degree of the relationship of two variables are assessed with.
A)a between-subjects design
B)correlational research
C)the analysis of variance
D)the tind test
A)a between-subjects design
B)correlational research
C)the analysis of variance
D)the tind test
فتح الحزمة
افتح القفل للوصول البطاقات البالغ عددها 76 في هذه المجموعة.
فتح الحزمة
k this deck
16
A representation of a relationship between two variables in graphic form is a distribution.
A)one variable
B)bivariate
C)bimodal
D)normal
A)one variable
B)bivariate
C)bimodal
D)normal
فتح الحزمة
افتح القفل للوصول البطاقات البالغ عددها 76 في هذه المجموعة.
فتح الحزمة
k this deck
17
13-18 When calculating the Pearson correlation coefficient, is called the of X and Y.
A)sum of squares
B)cross products
C)standard deviation
D)correlation
X and Y.A)sum of squares
B)cross products
C)standard deviation
D)correlation
فتح الحزمة
افتح القفل للوصول البطاقات البالغ عددها 76 في هذه المجموعة.
فتح الحزمة
k this deck
18
A correlational study is designed to.
A)determine the relationship between an independent variable and a dependent variable
B)describe the degree of central tendency for a variable
C)find the extent to which two variables are related
D)manipulate an independent variable
A)determine the relationship between an independent variable and a dependent variable
B)describe the degree of central tendency for a variable
C)find the extent to which two variables are related
D)manipulate an independent variable
فتح الحزمة
افتح القفل للوصول البطاقات البالغ عددها 76 في هذه المجموعة.
فتح الحزمة
k this deck
19
13-13 If two variables are related so that increasing values of one variable are associated with decreasing values of the other, then there is a (or ) relationship between the variables.
A)positive; direct
B)positive; inverse
C)negative; inverse
D)negative; direct
A)positive; direct
B)positive; inverse
C)negative; inverse
D)negative; direct
فتح الحزمة
افتح القفل للوصول البطاقات البالغ عددها 76 في هذه المجموعة.
فتح الحزمة
k this deck
20
13-17 The numerator of the Pearson r is the.
A)product of the sums of squares for the X and Y values
B)square root of the sum of squares for X plus the sum of squares for Y
C)sum of the cross products of X and Y divided by N
D)cross products of X and Y
A)product of the sums of squares for the X and Y values
B)square root of the sum of squares for X plus the sum of squares for Y
C)sum of the cross products of X and Y divided by N
D)cross products of X and Y
فتح الحزمة
افتح القفل للوصول البطاقات البالغ عددها 76 في هذه المجموعة.
فتح الحزمة
k this deck
21
13-30 If you calculated robs = +1.57, then.
A)the two variables are more than perfectly positively related
B)the two variables are strongly, but not perfectly, positively related
C)the two variables are not at all related
D)you would know you had made a mistake in calculation
A)the two variables are more than perfectly positively related
B)the two variables are strongly, but not perfectly, positively related
C)the two variables are not at all related
D)you would know you had made a mistake in calculation
فتح الحزمة
افتح القفل للوصول البطاقات البالغ عددها 76 في هذه المجموعة.
فتح الحزمة
k this deck
22
13-33 When robs equals zero, the scatterplot of X and Y will most closely resemble a(n).
A)straight line
B)narrow ellipse
C)circle
D)oval
A)straight line
B)narrow ellipse
C)circle
D)oval
فتح الحزمة
افتح القفل للوصول البطاقات البالغ عددها 76 في هذه المجموعة.
فتح الحزمة
k this deck
23
13-42 How will r be affected by decreasing the range of values of variable X?
A)The value of r will increase.
B)The value of r will decrease.
C)The value of r will either increase or decrease depending on the value of the cross products.
D)The value of r will be unaffected.
A)The value of r will increase.
B)The value of r will decrease.
C)The value of r will either increase or decrease depending on the value of the cross products.
D)The value of r will be unaffected.
فتح الحزمة
افتح القفل للوصول البطاقات البالغ عددها 76 في هذه المجموعة.
فتح الحزمة
k this deck
24
13-36 Which correlation coefficient represents the weakest association between the X and Y variables?
A)r = +.20
B)r = +.60
C)r = -.50
D)r = -.90
A)r = +.20
B)r = +.60
C)r = -.50
D)r = -.90
فتح الحزمة
افتح القفل للوصول البطاقات البالغ عددها 76 في هذه المجموعة.
فتح الحزمة
k this deck
25
13-41 A study has found a negative correlation between a person's income and his or her blood pressure. This study indicates that.
A)income and blood pressure are not related
B)higher income is associated with higher blood pressure
C)as income increases, blood pressure tends to increase also
D)higher income is associated with lower blood pressure
A)income and blood pressure are not related
B)higher income is associated with higher blood pressure
C)as income increases, blood pressure tends to increase also
D)higher income is associated with lower blood pressure
فتح الحزمة
افتح القفل للوصول البطاقات البالغ عددها 76 في هذه المجموعة.
فتح الحزمة
k this deck
26
13-35 The scatterplot depicting a relationship between two variables for which r = -.90 would be a.
A)narrow ellipse
B)circle
C)wide oval
D)straight line
A)narrow ellipse
B)circle
C)wide oval
D)straight line
فتح الحزمة
افتح القفل للوصول البطاقات البالغ عددها 76 في هذه المجموعة.
فتح الحزمة
k this deck
27
13-22 If the X and Y scores of a bivariate distribution are not related, then the CPXY on these scores should be.
A)equal to either +1.00 or -1.00
B)a large positive value
C)a large negative value
D)equal to about zero
A)equal to either +1.00 or -1.00
B)a large positive value
C)a large negative value
D)equal to about zero
فتح الحزمة
افتح القفل للوصول البطاقات البالغ عددها 76 في هذه المجموعة.
فتح الحزمة
k this deck
28
13-37 A Pearson r should be calculated only when the relationship between two variables can be assumed to be.
A)independent
B)linear
C)positive
D)negative
A)independent
B)linear
C)positive
D)negative
فتح الحزمة
افتح القفل للوصول البطاقات البالغ عددها 76 في هذه المجموعة.
فتح الحزمة
k this deck
29
13-39 Researchers have found a negative correlation between the number of hours a high school student works and high school achievement. Given this knowledge, you would expect that.
A)more hours worked per week are associated with greater high school achievement
B)more hours worked per week are associated with lower high school achievement
C)there is no relation between number of hours worked per week and high school achievement
D)if you knew the number of hours worked per week it would not help you predict the student's high school achievement
فتح الحزمة
افتح القفل للوصول البطاقات البالغ عددها 76 في هذه المجموعة.
فتح الحزمة
k this deck
30
13-40 Crime rates usually are positively related to population density. Thus you expect that.
A)high population density areas would have low crime rates
B)higher population density is associated with lower crime rates
C)higher population density is associated with higher crime rates
D)population density and crime rate are not related
A)high population density areas would have low crime rates
B)higher population density is associated with lower crime rates
C)higher population density is associated with higher crime rates
D)population density and crime rate are not related
فتح الحزمة
افتح القفل للوصول البطاقات البالغ عددها 76 في هذه المجموعة.
فتح الحزمة
k this deck
31
13-26 The value of r may lie within an interval of values ranging from.
A)-1.00 to +1.00
B)0.00 to +10.00
C)-10.00 to 0.00
D)0.00 to -1.00
A)-1.00 to +1.00
B)0.00 to +10.00
C)-10.00 to 0.00
D)0.00 to -1.00
فتح الحزمة
افتح القفل للوصول البطاقات البالغ عددها 76 في هذه المجموعة.
فتح الحزمة
k this deck
32
13-31 Which of the following values of robs allows perfect prediction of the Y score from knowledge of the X score?
A)zero
B)+1.00
C)+.50 d +2.00
A)zero
B)+1.00
C)+.50 d +2.00
فتح الحزمة
افتح القفل للوصول البطاقات البالغ عددها 76 في هذه المجموعة.
فتح الحزمة
k this deck
33
13-25 The direction of a linear relationship between two variables is given by of r.
A)the numerical value
B)the plus or minus sign
C)both the sign and numerical value
D)the numerical value of the denominator
A)the numerical value
B)the plus or minus sign
C)both the sign and numerical value
D)the numerical value of the denominator
فتح الحزمة
افتح القفل للوصول البطاقات البالغ عددها 76 في هذه المجموعة.
فتح الحزمة
k this deck
34
13-29 If two variables are completely unrelated, robs.
A)equals zero
B)equals either +1.00 or -1.00
C)is a large value but not +1.00 or -1.00
D)is greater than 1.00
A)equals zero
B)equals either +1.00 or -1.00
C)is a large value but not +1.00 or -1.00
D)is greater than 1.00
فتح الحزمة
افتح القفل للوصول البطاقات البالغ عددها 76 في هذه المجموعة.
فتح الحزمة
k this deck
35
13-21 The denominator of the Pearson r is.
فتح الحزمة
افتح القفل للوصول البطاقات البالغ عددها 76 في هذه المجموعة.
فتح الحزمة
k this deck
36
13-38 A psychologist has found a correlation of +.54 between measures of need for achievement and college grade point average. Given this knowledge, you would expect that.
A)higher need for achievement scores are associated with higher college grade point averages
B)higher need for achievement scores are associated with lower college grade point averages
C)there is no relationship between need for achievement and college grade point average
D)if you knew a student's need for achievement score, you could predict the student's grade point average perfectly
فتح الحزمة
افتح القفل للوصول البطاقات البالغ عددها 76 في هذه المجموعة.
فتح الحزمة
k this deck
37
13-28 A perfect linear relationship of variables X and Y would result in a value of robs equal to .
A)zero
B)a large value but not +1.00 or -1.00
C)a small value but not zero
D)either +1.00 or -1.00
A)zero
B)a large value but not +1.00 or -1.00
C)a small value but not zero
D)either +1.00 or -1.00
فتح الحزمة
افتح القفل للوصول البطاقات البالغ عددها 76 في هذه المجموعة.
فتح الحزمة
k this deck
38
13-34 The pattern of scores in a scatterplot that indicates no relationship between two variables is.
A)oval
B)circular
C)elliptical
D)linear
A)oval
B)circular
C)elliptical
D)linear
فتح الحزمة
افتح القفل للوصول البطاقات البالغ عددها 76 في هذه المجموعة.
فتح الحزمة
k this deck
39
13-24 The sign of r indicates the of the relationship between two variables.
A)strength
B)direction
C)magnitude
D)degree
A)strength
B)direction
C)magnitude
D)degree
فتح الحزمة
افتح القفل للوصول البطاقات البالغ عددها 76 في هذه المجموعة.
فتح الحزمة
k this deck
40
13-27 The range of values that r can assume is.
A)0.00 to +10.00
B)0.00 to -10.00
C)-1.00 to +1.00
D)none of the above
A)0.00 to +10.00
B)0.00 to -10.00
C)-1.00 to +1.00
D)none of the above
فتح الحزمة
افتح القفل للوصول البطاقات البالغ عددها 76 في هذه المجموعة.
فتح الحزمة
k this deck
41
13-57 In a test to determine if r is statistically significant, H0 is.
A)r = 0
B)r = 1
C)ρ ≠ 0
D)ρ = 0
A)r = 0
B)r = 1
C)ρ ≠ 0
D)ρ = 0
فتح الحزمة
افتح القفل للوصول البطاقات البالغ عددها 76 في هذه المجموعة.
فتح الحزمة
k this deck
42
13-48 The extent to which two variables share common variance is estimated by.
فتح الحزمة
افتح القفل للوصول البطاقات البالغ عددها 76 في هذه المجموعة.
فتح الحزمة
k this deck
43
13-51 If robs = +.40, then percent of the variance in the scores of one variable is associated with variation in the other variable.
A)40
B)60
C)16
D)8
A)40
B)60
C)16
D)8
فتح الحزمة
افتح القفل للوصول البطاقات البالغ عددها 76 في هذه المجموعة.
فتح الحزمة
k this deck
44
13-61 If robs does not fall into a rejection region, then the decision is to H0 and H1.
A)accept; reject
B)reject; accept
C)fail to reject; not accept
D)reject; not accept
A)accept; reject
B)reject; accept
C)fail to reject; not accept
D)reject; not accept
فتح الحزمة
افتح القفل للوصول البطاقات البالغ عددها 76 في هذه المجموعة.
فتح الحزمة
k this deck
45
13-43 If the scores of either the X or Y variable are restricted in value, then we expect
A)a larger value of r than if the scores were not restricted in value
B)r to equal either +1.00 or -1.00
C)a smaller value of r than if the scores were not restricted in value
D)it will have no effect on r
A)a larger value of r than if the scores were not restricted in value
B)r to equal either +1.00 or -1.00
C)a smaller value of r than if the scores were not restricted in value
D)it will have no effect on r
فتح الحزمة
افتح القفل للوصول البطاقات البالغ عددها 76 في هذه المجموعة.
فتح الحزمة
k this deck
46
13-60 If robs falls into a rejection region, then the decision is to H0 and H1.
A)accept; reject
B)reject; accept
C)fail to reject; not accept
D)reject; not accept
A)accept; reject
B)reject; accept
C)fail to reject; not accept
D)reject; not accept
فتح الحزمة
افتح القفل للوصول البطاقات البالغ عددها 76 في هذه المجموعة.
فتح الحزمة
k this deck
47
13-53 If variables X and Y are correlated, then which of the following is a possibility?
A)X causes Y.
B)Y causes X.
C)X and Y may be caused by a third variable, Z.
D)All the above are possibilities.
A)X causes Y.
B)Y causes X.
C)X and Y may be caused by a third variable, Z.
D)All the above are possibilities.
فتح الحزمة
افتح القفل للوصول البطاقات البالغ عددها 76 في هذه المجموعة.
فتح الحزمة
k this deck
48
13-56 The population correlation coefficient is represented by the symbol.
A)α
B)β
C)μ
D)ρ
A)α
B)β
C)μ
D)ρ
فتح الحزمة
افتح القفل للوصول البطاقات البالغ عددها 76 في هذه المجموعة.
فتح الحزمة
k this deck
49
13-58 In a test to determine if r is statistically significant, H1 is.
A)r = 0
B)r = 1
C)ρ ≠ 0
D)ρ = 0
A)r = 0
B)r = 1
C)ρ ≠ 0
D)ρ = 0
فتح الحزمة
افتح القفل للوصول البطاقات البالغ عددها 76 في هذه المجموعة.
فتح الحزمة
k this deck
50
13-50 If robs = -.60, then percent of the variance in the scores of one variable is associated with variation in the other variable.
A)60
B)36
C)40
D)64
A)60
B)36
C)40
D)64
فتح الحزمة
افتح القفل للوصول البطاقات البالغ عددها 76 في هذه المجموعة.
فتح الحزمة
k this deck
51
13-49 The value of is a measure of the.
A)extent to which two variables share a common variance
B)precision with which one variable predicts the value of the other
C)degree of linear association between two variables
D)degree of nonlinear association between two variables
A)extent to which two variables share a common variance
B)precision with which one variable predicts the value of the other
C)degree of linear association between two variables
D)degree of nonlinear association between two variables
فتح الحزمة
افتح القفل للوصول البطاقات البالغ عددها 76 في هذه المجموعة.
فتح الحزمة
k this deck
52
13-59 In a test to determine if r is statistically significant, the df for robs are equal to.
A)Npairs - 2
B)Npairs
C)Npairs - 1
D)Npairs + 2
A)Npairs - 2
B)Npairs
C)Npairs - 1
D)Npairs + 2
فتح الحزمة
افتح القفل للوصول البطاقات البالغ عددها 76 في هذه المجموعة.
فتح الحزمة
k this deck
53
13-44 If the range of one or both variables is restricted, then the value of r for these variables most likely will.
A)not change
B)become either +1.00 or -1.00
C)increase
D)decrease
A)not change
B)become either +1.00 or -1.00
C)increase
D)decrease
فتح الحزمة
افتح القفل للوصول البطاقات البالغ عددها 76 في هذه المجموعة.
فتح الحزمة
k this deck
54
13-62 You obtained robs = +.39 when correlating the number of hours per week spent studying by a student and his or her grade point average. In order to find if this correlation coefficient is statistically significant, you need to know the.
A)means for both variables
B)standard deviation for both variables
C)number of pairs of scores on which robs was based
D)CPXY for this correlation
A)means for both variables
B)standard deviation for both variables
C)number of pairs of scores on which robs was based
D)CPXY for this correlation
فتح الحزمة
افتح القفل للوصول البطاقات البالغ عددها 76 في هذه المجموعة.
فتح الحزمة
k this deck
55
13-64 An assumption of the statistical test for the significance of r is that.
A)the variances of X and Y are equal
B)the means of the X and Y populations are equal
C)the X and Y scores are statistically independent
D)both the X and Y scores are normally distributed in the population sampled
A)the variances of X and Y are equal
B)the means of the X and Y populations are equal
C)the X and Y scores are statistically independent
D)both the X and Y scores are normally distributed in the population sampled
فتح الحزمة
افتح القفل للوصول البطاقات البالغ عددها 76 في هذه المجموعة.
فتح الحزمة
k this deck
56
13-63 An assumption of the statistical test for the significance of r is that the.
A)variances of X and Y are equal
B)means of the X and Y populations are equal
C)X and Y scores form a bivariate normal distribution
D)X and Y scores are statistically independent
A)variances of X and Y are equal
B)means of the X and Y populations are equal
C)X and Y scores form a bivariate normal distribution
D)X and Y scores are statistically independent
فتح الحزمة
افتح القفل للوصول البطاقات البالغ عددها 76 في هذه المجموعة.
فتح الحزمة
k this deck
57
13-47 The proportion of variance in one variable that is associated with variance in the other variable is given by.
فتح الحزمة
افتح القفل للوصول البطاقات البالغ عددها 76 في هذه المجموعة.
فتح الحزمة
k this deck
58
13-54 If variables X and Y are correlated, then which of the following is not a possibility?
A)X causes Y.
B)X and Y are independent of each other..
C)Y causes X.
D)X and Y may be caused by a third variable, Z.
A)X causes Y.
B)X and Y are independent of each other..
C)Y causes X.
D)X and Y may be caused by a third variable, Z.
فتح الحزمة
افتح القفل للوصول البطاقات البالغ عددها 76 في هذه المجموعة.
فتح الحزمة
k this deck
59
13-52 If the coefficient of determination equals .49, then r equals.
فتح الحزمة
افتح القفل للوصول البطاقات البالغ عددها 76 في هذه المجموعة.
فتح الحزمة
k this deck
60
13-55 The symbol ρ represents the.
A)population correlation coefficient
B)sample correlation coefficient
C)magnitude of the strength of association
D)coefficient of determination
A)population correlation coefficient
B)sample correlation coefficient
C)magnitude of the strength of association
D)coefficient of determination
فتح الحزمة
افتح القفل للوصول البطاقات البالغ عددها 76 في هذه المجموعة.
فتح الحزمة
k this deck
61
13-75 If the results of a study using the Spearman correlation coefficient were reported as rS(17) = +.63, p < .05, then you would know that H0 was and was.
A)ρS = 1; rejected
B)ρS = 1; not rejected
C)ρS = 0; rejected
D)ρS = 0; not rejected
A)ρS = 1; rejected
B)ρS = 1; not rejected
C)ρS = 0; rejected
D)ρS = 0; not rejected
فتح الحزمة
افتح القفل للوصول البطاقات البالغ عددها 76 في هذه المجموعة.
فتح الحزمة
k this deck
62
13-67 If the results of a correlational study were reported as r(42) = +.26, p > .05, then you would know that H0 was and was.
A)ρ = 1; rejected
B)ρ = 1; not rejected
C)ρ = 0; rejected
D)ρ = 0; not rejected
A)ρ = 1; rejected
B)ρ = 1; not rejected
C)ρ = 0; rejected
D)ρ = 0; not rejected
فتح الحزمة
افتح القفل للوصول البطاقات البالغ عددها 76 في هذه المجموعة.
فتح الحزمة
k this deck
63
13-80 If the results of a study using the Spearman correlation coefficient were reported as rS(16) = -.34, p > .05, then you would know that subjects participated in the study.
A)12
B)16
C)14
D)18
A)12
B)16
C)14
D)18
فتح الحزمة
افتح القفل للوصول البطاقات البالغ عددها 76 في هذه المجموعة.
فتح الحزمة
k this deck
64
13-76 If the results of a study using the Spearman correlation coefficient were reported as rS(23) = -.32, p > .05, then you would know that H0 was and was.
A)ρS = 1; rejected
B)ρS = 1; not rejected
C)ρS = 0; rejected
D)ρS = 0; not rejected
A)ρS = 1; rejected
B)ρS = 1; not rejected
C)ρS = 0; rejected
D)ρS = 0; not rejected
فتح الحزمة
افتح القفل للوصول البطاقات البالغ عددها 76 في هذه المجموعة.
فتح الحزمة
k this deck
65
13-74 In testing the statistical significance of rS, the critical value is based upon.
A)Npairs
B)Npairs - 1
C)Npairs - 2
D)the total number of scores minus one
A)Npairs
B)Npairs - 1
C)Npairs - 2
D)the total number of scores minus one
فتح الحزمة
افتح القفل للوصول البطاقات البالغ عددها 76 في هذه المجموعة.
فتح الحزمة
k this deck
66
13-79 If the results of a study using the Spearman correlation coefficient were reported as rS(29) = -.24, p > .05, then which of the following statements is true?
A)H1 was accepted.
B)The value of Npairs was 29.
C)The X and Y variables are significantly negatively related.
D)All the above.
A)H1 was accepted.
B)The value of Npairs was 29.
C)The X and Y variables are significantly negatively related.
D)All the above.
فتح الحزمة
افتح القفل للوصول البطاقات البالغ عددها 76 في هذه المجموعة.
فتح الحزمة
k this deck
67
13-68 If the results of a correlational study were reported as r(48) = -.47, p < .05, then which of the following statements is true?
A)robs is statistically significant at the .05 level.
B)H0 was ρ = + or - .47.
C)rcrit = + or - .47.
D)H1 was ρ = 0.
A)robs is statistically significant at the .05 level.
B)H0 was ρ = + or - .47.
C)rcrit = + or - .47.
D)H1 was ρ = 0.
فتح الحزمة
افتح القفل للوصول البطاقات البالغ عددها 76 في هذه المجموعة.
فتح الحزمة
k this deck
68
13-77 If the results of a study using the Spearman correlation coefficient were reported as rS(28) = -.44, p < .05, then which of the following statements is true?
A)H0 was ρS = + or - .44.
B)The X and Y variable are significantly negatively related.
C)rS crit = + or - .44.
D)H1 was ρS = 0.
A)H0 was ρS = + or - .44.
B)The X and Y variable are significantly negatively related.
C)rS crit = + or - .44.
D)H1 was ρS = 0.
فتح الحزمة
افتح القفل للوصول البطاقات البالغ عددها 76 في هذه المجموعة.
فتح الحزمة
k this deck
69
13-69 If the results of a correlational study were reported as r(14) = +.23, p > .05, then which of the following statements is true?
A)H0 was ρ = 0.
B)H0 was not rejected.
C)robs was +.23.
D)All the above.
A)H0 was ρ = 0.
B)H0 was not rejected.
C)robs was +.23.
D)All the above.
فتح الحزمة
افتح القفل للوصول البطاقات البالغ عددها 76 في هذه المجموعة.
فتح الحزمة
k this deck
70
13-72 The Spearman r describes the relationship between pairs of scores that represent measurement.
A)ratio
B)interval
C)ordinal
D)nominal
A)ratio
B)interval
C)ordinal
D)nominal
فتح الحزمة
افتح القفل للوصول البطاقات البالغ عددها 76 في هذه المجموعة.
فتح الحزمة
k this deck
71
13-65 If the results of a correlational study were reported as r(12) = -.32, p > .05, then you would know that subjects participated in the study.
A)10
B)14
C)13
D)12
A)10
B)14
C)13
D)12
فتح الحزمة
افتح القفل للوصول البطاقات البالغ عددها 76 في هذه المجموعة.
فتح الحزمة
k this deck
72
13-70 If the results of a correlational study were reported as r(26) = -.53, p < .05, then which of the following statements is true?
A)H1 was accepted.
B)The value of Npairs was 28.
C)The X and Y variables are significantly negatively related.
D)All the above.
A)H1 was accepted.
B)The value of Npairs was 28.
C)The X and Y variables are significantly negatively related.
D)All the above.
فتح الحزمة
افتح القفل للوصول البطاقات البالغ عددها 76 في هذه المجموعة.
فتح الحزمة
k this deck
73
13-66 If the results of a correlational study were reported as r(20) = +.57, p < .05, then you would know that H0 was and was.
A)ρ = 1; rejected
B)ρ = 1; not rejected
C)ρ = 0; rejected
D)ρ = 0; not rejected
A)ρ = 1; rejected
B)ρ = 1; not rejected
C)ρ = 0; rejected
D)ρ = 0; not rejected
فتح الحزمة
افتح القفل للوصول البطاقات البالغ عددها 76 في هذه المجموعة.
فتح الحزمة
k this deck
74
13-78 If the results of a study using the Spearman correlation coefficient were reported as rS(18) = +.57, p < .05, then which of the following statements is true?
A)H0 was ρS = 0.
B)H0 was rejected.
C)rS obs was +.57.
D)All the above.
A)H0 was ρS = 0.
B)H0 was rejected.
C)rS obs was +.57.
D)All the above.
فتح الحزمة
افتح القفل للوصول البطاقات البالغ عددها 76 في هذه المجموعة.
فتح الحزمة
k this deck
75
13-73 The Spearman correlation coefficient is symbolized by.
A)RS
B)rS
C)Spear r
D)RSpearman
A)RS
B)rS
C)Spear r
D)RSpearman
فتح الحزمة
افتح القفل للوصول البطاقات البالغ عددها 76 في هذه المجموعة.
فتح الحزمة
k this deck
76
13-71 The Spearman correlation coefficient is used for data.
A)categorized
B)ranked
C)continuous
D)discrete
A)categorized
B)ranked
C)continuous
D)discrete
فتح الحزمة
افتح القفل للوصول البطاقات البالغ عددها 76 في هذه المجموعة.
فتح الحزمة
k this deck
فتح الحزمة
افتح القفل للوصول البطاقات البالغ عددها 76 في هذه المجموعة.


