Deck 2: The Production Possibility Model, Trade, and Globalization
ملء الشاشة (f)
سؤال
Investment in capital goods is one way to increase the standard of living in the future.Investment in capital goods, however, means that we must forgo consumption today.One of the trade-offs facing an economy is consumption today and consumption in the future.The following table presents such a trade-off.With this information we know that the opportunity cost of which of the following is the greatest? 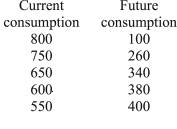
A)increasing current consumption from 750 to 800
B)increasing current consumption from 650 to 750
C)increasing current consumption from 600 to 650
D)increasing current consumption from 550 to 600
A)increasing current consumption from 750 to 800
B)increasing current consumption from 650 to 750
C)increasing current consumption from 600 to 650
D)increasing current consumption from 550 to 600
سؤال
Refer to the graph below. 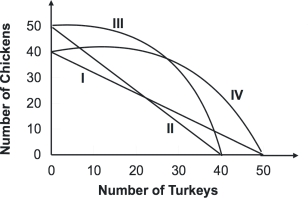 Suppose that the opportunity cost of producing 10 chickens is always 8 turkeys.Given this, the relevant production possibility curve must be:
A)I.
B)II.
C)III.
D)IV.
Suppose that the opportunity cost of producing 10 chickens is always 8 turkeys.Given this, the relevant production possibility curve must be:A)I.
B)II.
C)III.
D)IV.
سؤال
سؤال
Consider the table below, in which each production choice represents a point on a production possibility curve. 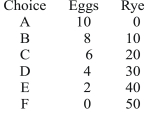 This production possibility table could be graphed as a:
A)straight line with negative slope.
B)curved line with negative slope.
C)straight line with zero slope.
D)curved line with positive slope.
This production possibility table could be graphed as a:A)straight line with negative slope.
B)curved line with negative slope.
C)straight line with zero slope.
D)curved line with positive slope.
سؤال
سؤال
سؤال
سؤال
Refer to the graph below. 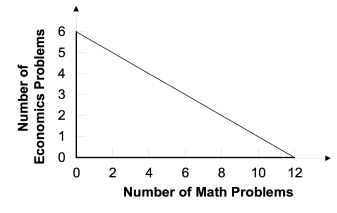 Laura's production possibility curve for math and economics problems in one night is shown in the graph.Her opportunity cost of finishing six math problems instead of four math problems is:
A)one economics problem.
B)two economics problems.
C)three economics problems.
D)four economics problems.
Laura's production possibility curve for math and economics problems in one night is shown in the graph.Her opportunity cost of finishing six math problems instead of four math problems is:A)one economics problem.
B)two economics problems.
C)three economics problems.
D)four economics problems.
سؤال
سؤال
سؤال
سؤال
The production possibility table below on the left is for growing broccoli and asparagus in a 320-square-foot garden in one season. 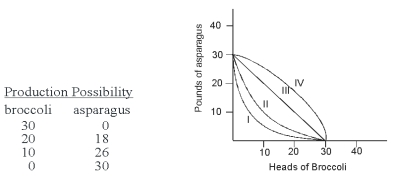 Which curve on the graph on the right corresponds to this table?
A)I
B)II
C)III
D)IV
Which curve on the graph on the right corresponds to this table?A)I
B)II
C)III
D)IV
سؤال
Suppose each of the following rows represents the choice faced by policy makers given the current set of U.S.institutions and technology.What is the opportunity cost of reducing unemployment from 8 percent to 4 percent? 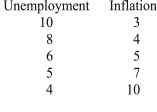
A)4 percentage points of unemployment
B)6 percentage points of unemployment
C)6 percentage points of inflation
D)4 percentage points of inflation
A)4 percentage points of unemployment
B)6 percentage points of unemployment
C)6 percentage points of inflation
D)4 percentage points of inflation
سؤال
Refer to the production possibility curve for Ricardia below. 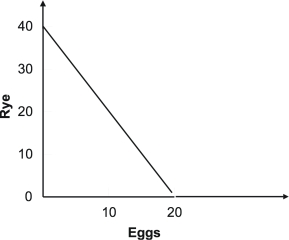 The graph indicates that with the resources and technology it has available, Ricardia:
A)can produce either 40 units of rye or 20 units of eggs.
B)can produce both 40 units of rye and 20 units of eggs.
C)cannot produce both 20 units of rye and 10 units of eggs.
D)cannot produce both 20 units of rye and 5 units of eggs.
The graph indicates that with the resources and technology it has available, Ricardia:A)can produce either 40 units of rye or 20 units of eggs.
B)can produce both 40 units of rye and 20 units of eggs.
C)cannot produce both 20 units of rye and 10 units of eggs.
D)cannot produce both 20 units of rye and 5 units of eggs.
سؤال
سؤال
Evan can grow both roses and carnations in his garden.His production possibility table is shown below.If he is currently producing 110 roses, his opportunity cost of producing 40 more roses is: 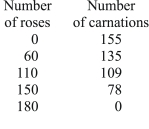
A)20 carnations
B)26 carnations
C)31 carnations
D)78 carnations
A)20 carnations
B)26 carnations
C)31 carnations
D)78 carnations
سؤال
سؤال
سؤال
سؤال
With the resources available, you can make the combinations of Ums and Umies (trinkets from a place called Bandarban) shown in the table.The opportunity cost of producing 60 Umies instead of 30 Umies is: 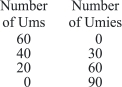
A)10 Ums
B)20 Ums
C)30 Ums
D)40 Ums
A)10 Ums
B)20 Ums
C)30 Ums
D)40 Ums
سؤال
سؤال
سؤال
سؤال
Refer to the graph below. 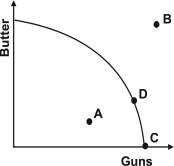 Given the production possibility curve, which point is unattainable?
A)A
B)B
C)C
D)D
Given the production possibility curve, which point is unattainable?A)A
B)B
C)C
D)D
سؤال
سؤال
سؤال
سؤال
Refer to the graph below. 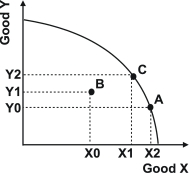 As you move from point A to point B:
A)production efficiency is increased because we have more of good X.
B)production efficiency is decreased because we have less of good Y.
C)production efficiency is decreased because we are no longer on the production possibility curve.
D)the change in efficiency is unclear.
As you move from point A to point B:A)production efficiency is increased because we have more of good X.
B)production efficiency is decreased because we have less of good Y.
C)production efficiency is decreased because we are no longer on the production possibility curve.
D)the change in efficiency is unclear.
سؤال
سؤال
Refer to the graph below. 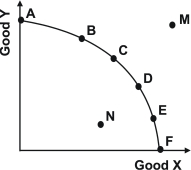 Productive efficiency is achieved at what points?
A)A, B, and M
B)C, D, and N
C)A, C, and F
D)M, D, and E
Productive efficiency is achieved at what points?A)A, B, and M
B)C, D, and N
C)A, C, and F
D)M, D, and E
سؤال
سؤال
Refer to the graph shown.Given the production possibility curve, the opportunity cost of reading 2 more articles when you are already reading 11 articles is on average: 
A)½ CD per article.
B)2 CDs per article.
C)2/3 CD per article.
D)3 CDs per article.
A)½ CD per article.
B)2 CDs per article.
C)2/3 CD per article.
D)3 CDs per article.
سؤال
سؤال
Refer to the graph below. 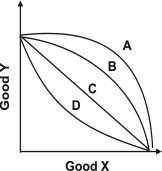 With which curve does the opportunity cost of an additional unit of good Y decrease as more units of good Y are produced?
A)A
B)B
C)C
D)D
With which curve does the opportunity cost of an additional unit of good Y decrease as more units of good Y are produced?A)A
B)B
C)C
D)D
سؤال
Refer to the graph below. 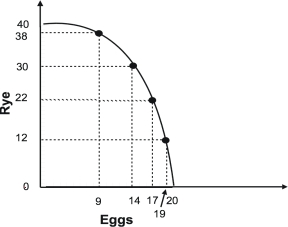 The graph indicates that as more eggs are produced, the marginal opportunity cost of:
A)both eggs and rye increases.
B)eggs increases while the marginal opportunity cost of rye remains constant.
C)eggs increases while the marginal opportunity cost of rye decreases.
D)eggs decreases while the marginal opportunity cost of rye remains constant.
The graph indicates that as more eggs are produced, the marginal opportunity cost of:A)both eggs and rye increases.
B)eggs increases while the marginal opportunity cost of rye remains constant.
C)eggs increases while the marginal opportunity cost of rye decreases.
D)eggs decreases while the marginal opportunity cost of rye remains constant.
سؤال
سؤال
Given the production possibility curve shown, the opportunity cost of listening to each additional CD when moving from point B to point A is on average: 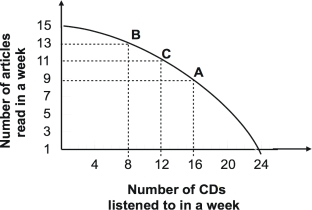
A)½ article.
B)1 article.
C)2 articles.
D)3 articles.
A)½ article.
B)1 article.
C)2 articles.
D)3 articles.
سؤال
سؤال
In the graph shown, what change would increase production efficiency? 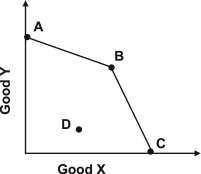
A)moving from A to D
B)moving from A to B
C)moving from C to D
D)moving from D to B
A)moving from A to D
B)moving from A to B
C)moving from C to D
D)moving from D to B
سؤال
This production possibility table illustrates: 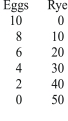
A)increasing marginal opportunity cost.
B)decreasing marginal opportunity cost.
C)constant marginal opportunity cost.
D)zero opportunity cost.
A)increasing marginal opportunity cost.
B)decreasing marginal opportunity cost.
C)constant marginal opportunity cost.
D)zero opportunity cost.
سؤال
Refer to the graph below. 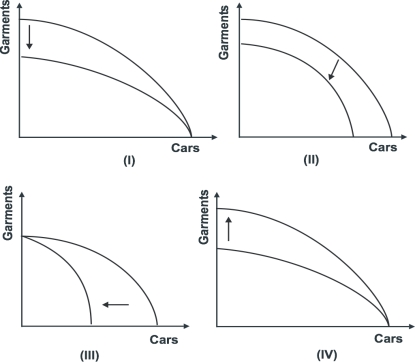 Which of the shifts explains what would happen to the production possibility curve if a cyclone destroys five major garment factories in the Philippines?
A)I
B)II
C)III
D)IV
Which of the shifts explains what would happen to the production possibility curve if a cyclone destroys five major garment factories in the Philippines?A)I
B)II
C)III
D)IV
سؤال
Refer to the graph below. 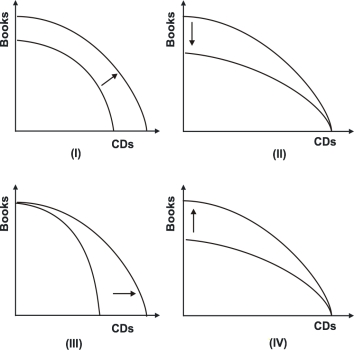 In the 1980s, desktop publishing reduced the cost of producing books.Assuming no change in the cost of producing CDs, which of the shifts reflects this change in technology?
A)I
B)II
C)III
D)IV
In the 1980s, desktop publishing reduced the cost of producing books.Assuming no change in the cost of producing CDs, which of the shifts reflects this change in technology?A)I
B)II
C)III
D)IV
سؤال
سؤال
The graph below indicates that the economy can produce both: 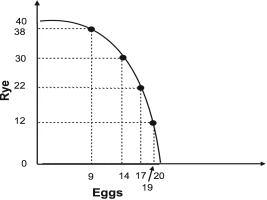
A)20 units of eggs and 5 units of rye, although this would not be production efficient.
B)10 units of eggs and 20 units of rye, although this would not be production efficient.
C)20 units of eggs and 5 units of rye, and this would be production efficient.
D)10 units of eggs and 20 units of rye, and this would be production efficient.
سؤال
سؤال
Refer to the graph below. 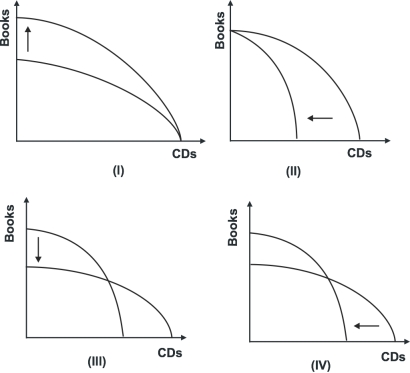 Which of the shifts explains what will happen to the production possibility curve if the cost of producing books goes down while the cost of producing CDs goes up?
A)I
B)II
C)III
D)IV
Which of the shifts explains what will happen to the production possibility curve if the cost of producing books goes down while the cost of producing CDs goes up?A)I
B)II
C)III
D)IV
سؤال
Refer to the graph shown.Destruction of some of the resources necessary to produce both guns and butter would result in what movement? 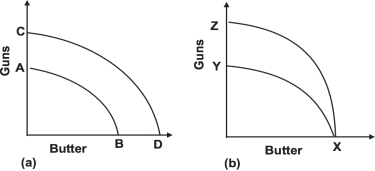
A)From A to B to C to D in diagram a.
B)From C to D to A to B in diagram a.
C)From X to Y to X to Z in diagram b.
D)From X to Z to X to Y in diagram b.
A)From A to B to C to D in diagram a.
B)From C to D to A to B in diagram a.
C)From X to Y to X to Z in diagram b.
D)From X to Z to X to Y in diagram b.
سؤال
سؤال
Refer to the graph below. 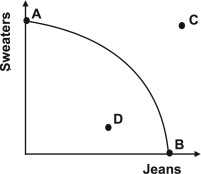 Productive inefficiency occurs at what point?
A)A
B)B
C)C
D)D
Productive inefficiency occurs at what point?A)A
B)B
C)C
D)D
سؤال
سؤال
Refer to the graphs shown.The discovery of a new supply of resources used only in the production of guns can be shown by which movement? 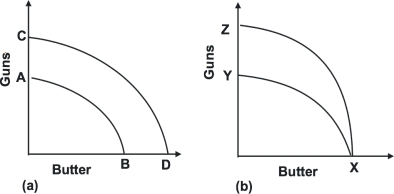
A)From A to B to C to D in diagram a
B)From C to D to A to B in diagram a
C)From X to Y to X to Z in diagram b
D)From X to Z to X to Y in diagram b
A)From A to B to C to D in diagram a
B)From C to D to A to B in diagram a
C)From X to Y to X to Z in diagram b
D)From X to Z to X to Y in diagram b
سؤال
سؤال
Refer to the graph below. 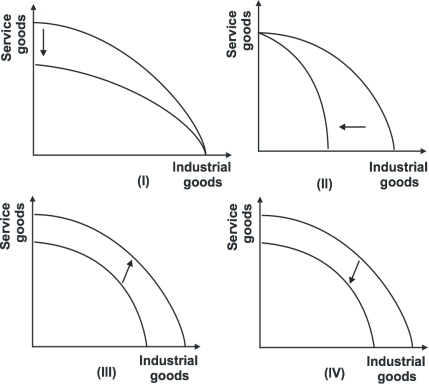 Which of the shifts explains what will happen to the production possibility curve if political unrest and strikes disrupt all sectors of an economy equally?
A)I
B)II
C)III
D)IV
Which of the shifts explains what will happen to the production possibility curve if political unrest and strikes disrupt all sectors of an economy equally?A)I
B)II
C)III
D)IV
سؤال
Refer to the graph below. 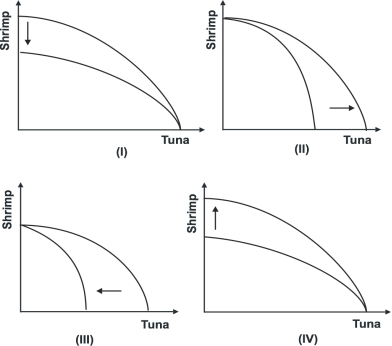 Which of the shifts explains what would happen to the production possibility curve if restrictions were imposed on tuna fishing?
A)I
B)II
C)III
D)IV
Which of the shifts explains what would happen to the production possibility curve if restrictions were imposed on tuna fishing?A)I
B)II
C)III
D)IV
سؤال
سؤال
سؤال
سؤال
Refer to the graph below. 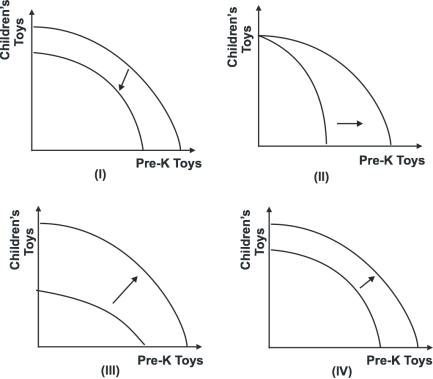 Which of the shifts explains what would happen to the production possibility curve if improved technologies increased the production of prekindergarten (Pre-K) toys by 25 percent and the production of children's toys by 50 percent?
A)I
B)II
C)III
D)IV
Which of the shifts explains what would happen to the production possibility curve if improved technologies increased the production of prekindergarten (Pre-K) toys by 25 percent and the production of children's toys by 50 percent?A)I
B)II
C)III
D)IV
سؤال
Refer to the graph below. 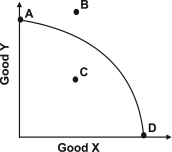 If the production possibility curve shifts along the Good Y axis, which point will remain as a point of efficiency?
A)A
B)B
C)C
D)D
If the production possibility curve shifts along the Good Y axis, which point will remain as a point of efficiency?A)A
B)B
C)C
D)D
سؤال
سؤال
The production possibility curves of two countries are given below: 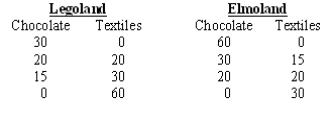 Refer to the production possibility curves of the two countries.If they specialized and traded, which of the following is the largest bundle each country could have?
A)15 chocolate and 15 textiles
B)20 chocolate and 20 textiles
C)30 chocolate and 30 textiles
D)60 chocolate and 60 textiles
Refer to the production possibility curves of the two countries.If they specialized and traded, which of the following is the largest bundle each country could have?A)15 chocolate and 15 textiles
B)20 chocolate and 20 textiles
C)30 chocolate and 30 textiles
D)60 chocolate and 60 textiles
سؤال
سؤال
سؤال
سؤال
Given the production possibility tables for the First and Second Bakeries shown, we know that the opportunity cost of producing cookies: 
A)is higher at First Bakery.
B)is higher at Second Bakery.
C)is the same at both bakeries.
D)cannot be computed without further information.
A)is higher at First Bakery.
B)is higher at Second Bakery.
C)is the same at both bakeries.
D)cannot be computed without further information.
سؤال
سؤال
Refer to the graph shown. 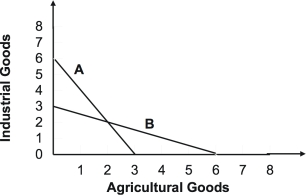 If Countries X and Y face the production possibility curves A and B, respectively, Country X has a comparative advantage in the production of:
A)neither agricultural goods nor industrial goods.
B)both agricultural goods and industrial goods.
C)agricultural goods only.
D)industrial goods only.
If Countries X and Y face the production possibility curves A and B, respectively, Country X has a comparative advantage in the production of:A)neither agricultural goods nor industrial goods.
B)both agricultural goods and industrial goods.
C)agricultural goods only.
D)industrial goods only.
سؤال
سؤال
The production possibility curves of two countries are given below:  Refer to the production possibility curves of the two countries.Without trade, the most each country could produce would be:
A)15 chocolate and 15 textiles.
B)20 chocolate and 20 textiles.
C)30 chocolate and 30 textiles.
D)60 chocolate and 60 textiles.
Refer to the production possibility curves of the two countries.Without trade, the most each country could produce would be:A)15 chocolate and 15 textiles.
B)20 chocolate and 20 textiles.
C)30 chocolate and 30 textiles.
D)60 chocolate and 60 textiles.
سؤال
Given the production possibility tables for First and Second Bakeries shown, we can determine that: 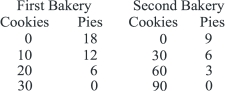
A)First Bakery has a comparative advantage in the production of both goods.
B)Second Bakery has a comparative advantage in the production of pies.
C)First Bakery has a comparative advantage in the production of pies.
D)neither bakery has a comparative advantage.
A)First Bakery has a comparative advantage in the production of both goods.
B)Second Bakery has a comparative advantage in the production of pies.
C)First Bakery has a comparative advantage in the production of pies.
D)neither bakery has a comparative advantage.
سؤال
سؤال
Refer to the graph shown. 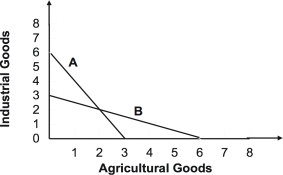 If Countries X and Y face the production possibility curves A and B, respectively, Country Y has a comparative advantage in the production of:
A)neither agricultural goods nor industrial goods.
B)both agricultural goods and industrial goods.
C)agricultural goods only.
D)industrial goods only.
If Countries X and Y face the production possibility curves A and B, respectively, Country Y has a comparative advantage in the production of:A)neither agricultural goods nor industrial goods.
B)both agricultural goods and industrial goods.
C)agricultural goods only.
D)industrial goods only.
سؤال
سؤال
The production possibility frontiers of Northland and Southland are given.Without trade, Northland produces and consumes 20 apples and 5 bananas and Southland produces and consumes 10 apples and 40 bananas.Could they increase their consumption bundle by changing production and trading? 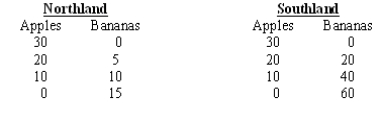
A)No; Southland does at least as well at producing both, so it would have no incentive to trade.
B)Yes; they could gain 75 bananas and 60 apples.
C)Yes; they could gain up to 60 apples without losing bananas
D)Yes; they could gain up to 15 bananas without losing apples.
A)No; Southland does at least as well at producing both, so it would have no incentive to trade.
B)Yes; they could gain 75 bananas and 60 apples.
C)Yes; they could gain up to 60 apples without losing bananas
D)Yes; they could gain up to 15 bananas without losing apples.
سؤال
سؤال
Given the production possibility tables for First and Second Bakeries shown, we know that the opportunity cost of producing pies: 
A)is higher at First Bakery.
B)is higher at Second Bakery.
C)is the same at both bakeries.
D)cannot be computed without further information.
A)is higher at First Bakery.
B)is higher at Second Bakery.
C)is the same at both bakeries.
D)cannot be computed without further information.
سؤال
سؤال
سؤال
سؤال

فتح الحزمة
قم بالتسجيل لفتح البطاقات في هذه المجموعة!
Unlock Deck
Unlock Deck
1/109
العب
ملء الشاشة (f)
Deck 2: The Production Possibility Model, Trade, and Globalization
1
Investment in capital goods is one way to increase the standard of living in the future.Investment in capital goods, however, means that we must forgo consumption today.One of the trade-offs facing an economy is consumption today and consumption in the future.The following table presents such a trade-off.With this information we know that the opportunity cost of which of the following is the greatest?
A)increasing current consumption from 750 to 800
B)increasing current consumption from 650 to 750
C)increasing current consumption from 600 to 650
D)increasing current consumption from 550 to 600
A)increasing current consumption from 750 to 800
B)increasing current consumption from 650 to 750
C)increasing current consumption from 600 to 650
D)increasing current consumption from 550 to 600
increasing current consumption from 750 to 800
2
Refer to the graph below. Suppose that the opportunity cost of producing 10 chickens is always 8 turkeys.Given this, the relevant production possibility curve must be:
A)I.
B)II.
C)III.
D)IV.
Suppose that the opportunity cost of producing 10 chickens is always 8 turkeys.Given this, the relevant production possibility curve must be:A)I.
B)II.
C)III.
D)IV.
II.
3
The law of one price means that prices eventually will be the same in all countries and eventually countries will not have a reason to trade.
False
4
Consider the table below, in which each production choice represents a point on a production possibility curve. This production possibility table could be graphed as a:
A)straight line with negative slope.
B)curved line with negative slope.
C)straight line with zero slope.
D)curved line with positive slope.
This production possibility table could be graphed as a:A)straight line with negative slope.
B)curved line with negative slope.
C)straight line with zero slope.
D)curved line with positive slope.
فتح الحزمة
افتح القفل للوصول البطاقات البالغ عددها 109 في هذه المجموعة.
فتح الحزمة
k this deck
5
An economy that operates inside its production possibility curve is less efficient than it would be if it were operating on its production possibility curve.
فتح الحزمة
افتح القفل للوصول البطاقات البالغ عددها 109 في هذه المجموعة.
فتح الحزمة
k this deck
6
Production possibility curves are upward-sloping because increased production of one good implies reduced production of other goods.
فتح الحزمة
افتح القفل للوصول البطاقات البالغ عددها 109 في هذه المجموعة.
فتح الحزمة
k this deck
7
If the principle of increasing marginal opportunity cost holds, the opportunity cost of producing each additional unit of a good should fall as production of that good rises.
فتح الحزمة
افتح القفل للوصول البطاقات البالغ عددها 109 في هذه المجموعة.
فتح الحزمة
k this deck
8
Refer to the graph below. Laura's production possibility curve for math and economics problems in one night is shown in the graph.Her opportunity cost of finishing six math problems instead of four math problems is:
A)one economics problem.
B)two economics problems.
C)three economics problems.
D)four economics problems.
Laura's production possibility curve for math and economics problems in one night is shown in the graph.Her opportunity cost of finishing six math problems instead of four math problems is:A)one economics problem.
B)two economics problems.
C)three economics problems.
D)four economics problems.
فتح الحزمة
افتح القفل للوصول البطاقات البالغ عددها 109 في هذه المجموعة.
فتح الحزمة
k this deck
9
Productive efficiency is not achieved at any point inside the production possibility curve.
فتح الحزمة
افتح القفل للوصول البطاقات البالغ عددها 109 في هذه المجموعة.
فتح الحزمة
k this deck
10
Which of the following cannot be determined by using a production possibility table?
A)What combination of outputs can be produced
B)How much less of one output must be produced if more of another output is produced
C)What combination of outputs is best
D)How much output can be produced from a given level of inputs
A)What combination of outputs can be produced
B)How much less of one output must be produced if more of another output is produced
C)What combination of outputs is best
D)How much output can be produced from a given level of inputs
فتح الحزمة
افتح القفل للوصول البطاقات البالغ عددها 109 في هذه المجموعة.
فتح الحزمة
k this deck
11
Because you can get more of one good only by giving up some of another good, the shape of a production possibility curve is:
A)upward-sloping.
B)perfectly vertical.
C)perfectly horizontal.
D)downward-sloping.
A)upward-sloping.
B)perfectly vertical.
C)perfectly horizontal.
D)downward-sloping.
فتح الحزمة
افتح القفل للوصول البطاقات البالغ عددها 109 في هذه المجموعة.
فتح الحزمة
k this deck
12
The production possibility table below on the left is for growing broccoli and asparagus in a 320-square-foot garden in one season. Which curve on the graph on the right corresponds to this table?
A)I
B)II
C)III
D)IV
Which curve on the graph on the right corresponds to this table?A)I
B)II
C)III
D)IV
فتح الحزمة
افتح القفل للوصول البطاقات البالغ عددها 109 في هذه المجموعة.
فتح الحزمة
k this deck
13
Suppose each of the following rows represents the choice faced by policy makers given the current set of U.S.institutions and technology.What is the opportunity cost of reducing unemployment from 8 percent to 4 percent?
A)4 percentage points of unemployment
B)6 percentage points of unemployment
C)6 percentage points of inflation
D)4 percentage points of inflation
A)4 percentage points of unemployment
B)6 percentage points of unemployment
C)6 percentage points of inflation
D)4 percentage points of inflation
فتح الحزمة
افتح القفل للوصول البطاقات البالغ عددها 109 في هذه المجموعة.
فتح الحزمة
k this deck
14
Refer to the production possibility curve for Ricardia below. The graph indicates that with the resources and technology it has available, Ricardia:
A)can produce either 40 units of rye or 20 units of eggs.
B)can produce both 40 units of rye and 20 units of eggs.
C)cannot produce both 20 units of rye and 10 units of eggs.
D)cannot produce both 20 units of rye and 5 units of eggs.
The graph indicates that with the resources and technology it has available, Ricardia:A)can produce either 40 units of rye or 20 units of eggs.
B)can produce both 40 units of rye and 20 units of eggs.
C)cannot produce both 20 units of rye and 10 units of eggs.
D)cannot produce both 20 units of rye and 5 units of eggs.
فتح الحزمة
افتح القفل للوصول البطاقات البالغ عددها 109 في هذه المجموعة.
فتح الحزمة
k this deck
15
If a country has a comparative advantage in the production of a good, its resources are better suited to the production of that good than are the resources of other countries.
فتح الحزمة
افتح القفل للوصول البطاقات البالغ عددها 109 في هذه المجموعة.
فتح الحزمة
k this deck
16
Evan can grow both roses and carnations in his garden.His production possibility table is shown below.If he is currently producing 110 roses, his opportunity cost of producing 40 more roses is:
A)20 carnations
B)26 carnations
C)31 carnations
D)78 carnations
A)20 carnations
B)26 carnations
C)31 carnations
D)78 carnations
فتح الحزمة
افتح القفل للوصول البطاقات البالغ عددها 109 في هذه المجموعة.
فتح الحزمة
k this deck
17
The production possibility model can be used to demonstrate the concept of opportunity cost.
فتح الحزمة
افتح القفل للوصول البطاقات البالغ عددها 109 في هذه المجموعة.
فتح الحزمة
k this deck
18
Two nations with differing comparative advantages will be able to consume more if they specialize and trade with each other than if they did not specialize or trade with each other.
فتح الحزمة
افتح القفل للوصول البطاقات البالغ عددها 109 في هذه المجموعة.
فتح الحزمة
k this deck
19
Two nations with differing comparative advantages will be able to consume more if each produces the good for which the opportunity cost is highest and trades for the good for which opportunity cost is lowest.
فتح الحزمة
افتح القفل للوصول البطاقات البالغ عددها 109 في هذه المجموعة.
فتح الحزمة
k this deck
20
With the resources available, you can make the combinations of Ums and Umies (trinkets from a place called Bandarban) shown in the table.The opportunity cost of producing 60 Umies instead of 30 Umies is:
A)10 Ums
B)20 Ums
C)30 Ums
D)40 Ums
A)10 Ums
B)20 Ums
C)30 Ums
D)40 Ums
فتح الحزمة
افتح القفل للوصول البطاقات البالغ عددها 109 في هذه المجموعة.
فتح الحزمة
k this deck
21
Increasing marginal opportunity cost means that the production possibility curve is:
A)bowed in so that for every additional unit of one good given up, you get fewer and fewer units of the other good.
B)bowed in so that for every additional unit of one good given up, you get more and more units of the other good.
C)bowed out so that for every additional unit of a good given up, you get fewer and fewer units of the other good.
D)bowed out so that for every additional unit of one good given up, you get more and more units of the other good.
فتح الحزمة
افتح القفل للوصول البطاقات البالغ عددها 109 في هذه المجموعة.
فتح الحزمة
k this deck
22
If you move from a point inside the production possibility curve to a point on the production possibility curve, it follows that efficiency is:
A)increased because the economy is now on the production possibility curve.
B)increased only if production of both goods increases.
C)increased as long as the combined output of both goods increases.
D)reduced if less of one good is produced.
A)increased because the economy is now on the production possibility curve.
B)increased only if production of both goods increases.
C)increased as long as the combined output of both goods increases.
D)reduced if less of one good is produced.
فتح الحزمة
افتح القفل للوصول البطاقات البالغ عددها 109 في هذه المجموعة.
فتح الحزمة
k this deck
23
Given a production possibility curve for good X (on the x-axis) and good Y (on the y-axis), the opportunity cost of increasing good X is greatest when the slope of the production possibility curve is:
A)-6.
B)-4.
C)6.
D)4.
A)-6.
B)-4.
C)6.
D)4.
فتح الحزمة
افتح القفل للوصول البطاقات البالغ عددها 109 في هذه المجموعة.
فتح الحزمة
k this deck
24
Refer to the graph below. Given the production possibility curve, which point is unattainable?
A)A
B)B
C)C
D)D
Given the production possibility curve, which point is unattainable?A)A
B)B
C)C
D)D
فتح الحزمة
افتح القفل للوصول البطاقات البالغ عددها 109 في هذه المجموعة.
فتح الحزمة
k this deck
25
The principle of increasing marginal opportunity costs states that the initial opportunity costs are:
A)high but decrease the more you concentrate on the activity.
B)low but increase the more you concentrate on the activity.
C)high but increase the more you concentrate on the activity.
D)low but decrease the more you concentrate on the activity.
A)high but decrease the more you concentrate on the activity.
B)low but increase the more you concentrate on the activity.
C)high but increase the more you concentrate on the activity.
D)low but decrease the more you concentrate on the activity.
فتح الحزمة
افتح القفل للوصول البطاقات البالغ عددها 109 في هذه المجموعة.
فتح الحزمة
k this deck
26
The principle of increasing marginal opportunity cost holds in which of the following cases?
A)All inputs are equally adaptable to the production of all goods.
B)The production possibility curve is a downward-sloping straight line.
C)Some inputs are better for producing particular goods.
D)Each input can be used to produce only one good.
A)All inputs are equally adaptable to the production of all goods.
B)The production possibility curve is a downward-sloping straight line.
C)Some inputs are better for producing particular goods.
D)Each input can be used to produce only one good.
فتح الحزمة
افتح القفل للوصول البطاقات البالغ عددها 109 في هذه المجموعة.
فتح الحزمة
k this deck
27
If there were decreasing marginal opportunity costs, the production possibility curve would be:
A)flat.
B)straight.
C)bowed out.
D)bowed in.
A)flat.
B)straight.
C)bowed out.
D)bowed in.
فتح الحزمة
افتح القفل للوصول البطاقات البالغ عددها 109 في هذه المجموعة.
فتح الحزمة
k this deck
28
Refer to the graph below. As you move from point A to point B:
A)production efficiency is increased because we have more of good X.
B)production efficiency is decreased because we have less of good Y.
C)production efficiency is decreased because we are no longer on the production possibility curve.
D)the change in efficiency is unclear.
As you move from point A to point B:A)production efficiency is increased because we have more of good X.
B)production efficiency is decreased because we have less of good Y.
C)production efficiency is decreased because we are no longer on the production possibility curve.
D)the change in efficiency is unclear.
فتح الحزمة
افتح القفل للوصول البطاقات البالغ عددها 109 في هذه المجموعة.
فتح الحزمة
k this deck
29
If a production possibility curve representing a trade-off between a grade in English and a grade in math has a negative slope, we know that:
A)there is a direct relationship between grades in English and grades in math.
B)there is no relationship between grades in English and grades in math.
C)there is an inverse relationship between grades in English and grades in math.
D)one can get better grades in English only if one gets better grades in math.
فتح الحزمة
افتح القفل للوصول البطاقات البالغ عددها 109 في هذه المجموعة.
فتح الحزمة
k this deck
30
Refer to the graph below. Productive efficiency is achieved at what points?
A)A, B, and M
B)C, D, and N
C)A, C, and F
D)M, D, and E
Productive efficiency is achieved at what points?A)A, B, and M
B)C, D, and N
C)A, C, and F
D)M, D, and E
فتح الحزمة
افتح القفل للوصول البطاقات البالغ عددها 109 في هذه المجموعة.
فتح الحزمة
k this deck
31
To graphically demonstrate the principle of increasing marginal opportunity cost, the production possibility curve must be:
A)flat.
B)straight.
C)bowed out.
D)bowed in.
A)flat.
B)straight.
C)bowed out.
D)bowed in.
فتح الحزمة
افتح القفل للوصول البطاقات البالغ عددها 109 في هذه المجموعة.
فتح الحزمة
k this deck
32
Refer to the graph shown.Given the production possibility curve, the opportunity cost of reading 2 more articles when you are already reading 11 articles is on average:
A)½ CD per article.
B)2 CDs per article.
C)2/3 CD per article.
D)3 CDs per article.
A)½ CD per article.
B)2 CDs per article.
C)2/3 CD per article.
D)3 CDs per article.
فتح الحزمة
افتح القفل للوصول البطاقات البالغ عددها 109 في هذه المجموعة.
فتح الحزمة
k this deck
33
England has a relatively cool and cloudy climate that is ill suited for grape growing.It can produce 200 units of wine for every 400 units of cloth.Portugal, in contrast, has a relatively warm and sunny climate that is good for growing grapes.It can produce 200 units of wine for every 100 units of cloth.Which country has the higher opportunity cost of producing cloth?
A)Portugal: 2 units of wine for every unit of cloth
B)England: 2 units of wine for every unit of cloth
C)Portugal: ½ unit of wine for every unit of cloth
D)England: ½ unit of cloth for every unit of wine
A)Portugal: 2 units of wine for every unit of cloth
B)England: 2 units of wine for every unit of cloth
C)Portugal: ½ unit of wine for every unit of cloth
D)England: ½ unit of cloth for every unit of wine
فتح الحزمة
افتح القفل للوصول البطاقات البالغ عددها 109 في هذه المجموعة.
فتح الحزمة
k this deck
34
Refer to the graph below. With which curve does the opportunity cost of an additional unit of good Y decrease as more units of good Y are produced?
A)A
B)B
C)C
D)D
With which curve does the opportunity cost of an additional unit of good Y decrease as more units of good Y are produced?A)A
B)B
C)C
D)D
فتح الحزمة
افتح القفل للوصول البطاقات البالغ عددها 109 في هذه المجموعة.
فتح الحزمة
k this deck
35
Refer to the graph below. The graph indicates that as more eggs are produced, the marginal opportunity cost of:
A)both eggs and rye increases.
B)eggs increases while the marginal opportunity cost of rye remains constant.
C)eggs increases while the marginal opportunity cost of rye decreases.
D)eggs decreases while the marginal opportunity cost of rye remains constant.
The graph indicates that as more eggs are produced, the marginal opportunity cost of:A)both eggs and rye increases.
B)eggs increases while the marginal opportunity cost of rye remains constant.
C)eggs increases while the marginal opportunity cost of rye decreases.
D)eggs decreases while the marginal opportunity cost of rye remains constant.
فتح الحزمة
افتح القفل للوصول البطاقات البالغ عددها 109 في هذه المجموعة.
فتح الحزمة
k this deck
36
When you produce cars, it is enormously expensive to produce one car, but then the costs per car decrease as more are produced.This would be an example of:
A)increasing marginal opportunity costs.
B)decreasing marginal opportunity costs.
C)constant marginal opportunity costs.
D)increasing returns to scale.
A)increasing marginal opportunity costs.
B)decreasing marginal opportunity costs.
C)constant marginal opportunity costs.
D)increasing returns to scale.
فتح الحزمة
افتح القفل للوصول البطاقات البالغ عددها 109 في هذه المجموعة.
فتح الحزمة
k this deck
37
Given the production possibility curve shown, the opportunity cost of listening to each additional CD when moving from point B to point A is on average:
A)½ article.
B)1 article.
C)2 articles.
D)3 articles.
A)½ article.
B)1 article.
C)2 articles.
D)3 articles.
فتح الحزمة
افتح القفل للوصول البطاقات البالغ عددها 109 في هذه المجموعة.
فتح الحزمة
k this deck
38
The principle of increasing marginal opportunity cost does not hold in which of the following cases?
A)All inputs are equally adaptable to the production of all goods.
B)Some inputs are more adaptable to the production of certain goods.
C)Some inputs are less adaptable to the production of certain goods.
D)Each input is adaptable to the production of a limited number of goods.
A)All inputs are equally adaptable to the production of all goods.
B)Some inputs are more adaptable to the production of certain goods.
C)Some inputs are less adaptable to the production of certain goods.
D)Each input is adaptable to the production of a limited number of goods.
فتح الحزمة
افتح القفل للوصول البطاقات البالغ عددها 109 في هذه المجموعة.
فتح الحزمة
k this deck
39
In the graph shown, what change would increase production efficiency?
A)moving from A to D
B)moving from A to B
C)moving from C to D
D)moving from D to B
A)moving from A to D
B)moving from A to B
C)moving from C to D
D)moving from D to B
فتح الحزمة
افتح القفل للوصول البطاقات البالغ عددها 109 في هذه المجموعة.
فتح الحزمة
k this deck
40
This production possibility table illustrates:
A)increasing marginal opportunity cost.
B)decreasing marginal opportunity cost.
C)constant marginal opportunity cost.
D)zero opportunity cost.
A)increasing marginal opportunity cost.
B)decreasing marginal opportunity cost.
C)constant marginal opportunity cost.
D)zero opportunity cost.
فتح الحزمة
افتح القفل للوصول البطاقات البالغ عددها 109 في هذه المجموعة.
فتح الحزمة
k this deck
41
Refer to the graph below. Which of the shifts explains what would happen to the production possibility curve if a cyclone destroys five major garment factories in the Philippines?
A)I
B)II
C)III
D)IV
Which of the shifts explains what would happen to the production possibility curve if a cyclone destroys five major garment factories in the Philippines?A)I
B)II
C)III
D)IV
فتح الحزمة
افتح القفل للوصول البطاقات البالغ عددها 109 في هذه المجموعة.
فتح الحزمة
k this deck
42
Refer to the graph below. In the 1980s, desktop publishing reduced the cost of producing books.Assuming no change in the cost of producing CDs, which of the shifts reflects this change in technology?
A)I
B)II
C)III
D)IV
In the 1980s, desktop publishing reduced the cost of producing books.Assuming no change in the cost of producing CDs, which of the shifts reflects this change in technology?A)I
B)II
C)III
D)IV
فتح الحزمة
افتح القفل للوصول البطاقات البالغ عددها 109 في هذه المجموعة.
فتح الحزمة
k this deck
43
A resource is said to have a comparative advantage if:
A)it is better suited to the production of one good than to the production of an alternative good.
B)it is equally suited to the production of all goods.
C)its suitability to the production of one good changes as it produces more of that good.
D)its suitability to the production of one good does not change as it produces more of that good.
فتح الحزمة
افتح القفل للوصول البطاقات البالغ عددها 109 في هذه المجموعة.
فتح الحزمة
k this deck
44
The graph below indicates that the economy can produce both:
A)20 units of eggs and 5 units of rye, although this would not be production efficient.
B)10 units of eggs and 20 units of rye, although this would not be production efficient.
C)20 units of eggs and 5 units of rye, and this would be production efficient.
D)10 units of eggs and 20 units of rye, and this would be production efficient.
فتح الحزمة
افتح القفل للوصول البطاقات البالغ عددها 109 في هذه المجموعة.
فتح الحزمة
k this deck
45
The term efficiency involves achieving a goal as:
A)quickly as possible.
B)cheaply as possible.
C)well as possible.
D)steadily as possible.
A)quickly as possible.
B)cheaply as possible.
C)well as possible.
D)steadily as possible.
فتح الحزمة
افتح القفل للوصول البطاقات البالغ عددها 109 في هذه المجموعة.
فتح الحزمة
k this deck
46
Refer to the graph below. Which of the shifts explains what will happen to the production possibility curve if the cost of producing books goes down while the cost of producing CDs goes up?
A)I
B)II
C)III
D)IV
Which of the shifts explains what will happen to the production possibility curve if the cost of producing books goes down while the cost of producing CDs goes up?A)I
B)II
C)III
D)IV
فتح الحزمة
افتح القفل للوصول البطاقات البالغ عددها 109 في هذه المجموعة.
فتح الحزمة
k this deck
47
Refer to the graph shown.Destruction of some of the resources necessary to produce both guns and butter would result in what movement?
A)From A to B to C to D in diagram a.
B)From C to D to A to B in diagram a.
C)From X to Y to X to Z in diagram b.
D)From X to Z to X to Y in diagram b.
A)From A to B to C to D in diagram a.
B)From C to D to A to B in diagram a.
C)From X to Y to X to Z in diagram b.
D)From X to Z to X to Y in diagram b.
فتح الحزمة
افتح القفل للوصول البطاقات البالغ عددها 109 في هذه المجموعة.
فتح الحزمة
k this deck
48
The text attributes the growth of economies over the last 200 years largely to:
A)the development of markets.
B)the discovery of additional resources.
C)a decrease in the size of the world population.
D)laissez-faire policies.
A)the development of markets.
B)the discovery of additional resources.
C)a decrease in the size of the world population.
D)laissez-faire policies.
فتح الحزمة
افتح القفل للوصول البطاقات البالغ عددها 109 في هذه المجموعة.
فتح الحزمة
k this deck
49
Refer to the graph below. Productive inefficiency occurs at what point?
A)A
B)B
C)C
D)D
Productive inefficiency occurs at what point?A)A
B)B
C)C
D)D
فتح الحزمة
افتح القفل للوصول البطاقات البالغ عددها 109 في هذه المجموعة.
فتح الحزمة
k this deck
50
According to Adam Smith, individuals are directed to do those things for which they have a comparative advantage by:
A)their self interest.
B)corporate management.
C)government policy.
D)the educational system.
A)their self interest.
B)corporate management.
C)government policy.
D)the educational system.
فتح الحزمة
افتح القفل للوصول البطاقات البالغ عددها 109 في هذه المجموعة.
فتح الحزمة
k this deck
51
Refer to the graphs shown.The discovery of a new supply of resources used only in the production of guns can be shown by which movement?
A)From A to B to C to D in diagram a
B)From C to D to A to B in diagram a
C)From X to Y to X to Z in diagram b
D)From X to Z to X to Y in diagram b
A)From A to B to C to D in diagram a
B)From C to D to A to B in diagram a
C)From X to Y to X to Z in diagram b
D)From X to Z to X to Y in diagram b
فتح الحزمة
افتح القفل للوصول البطاقات البالغ عددها 109 في هذه المجموعة.
فتح الحزمة
k this deck
52
Which of the following is the best example of an economic precept?
A)Predictable irrationality
B)The supply/demand model
C)The production possibility model
D)Laissez-faire
A)Predictable irrationality
B)The supply/demand model
C)The production possibility model
D)Laissez-faire
فتح الحزمة
افتح القفل للوصول البطاقات البالغ عددها 109 في هذه المجموعة.
فتح الحزمة
k this deck
53
Refer to the graph below. Which of the shifts explains what will happen to the production possibility curve if political unrest and strikes disrupt all sectors of an economy equally?
A)I
B)II
C)III
D)IV
Which of the shifts explains what will happen to the production possibility curve if political unrest and strikes disrupt all sectors of an economy equally?A)I
B)II
C)III
D)IV
فتح الحزمة
افتح القفل للوصول البطاقات البالغ عددها 109 في هذه المجموعة.
فتح الحزمة
k this deck
54
Refer to the graph below. Which of the shifts explains what would happen to the production possibility curve if restrictions were imposed on tuna fishing?
A)I
B)II
C)III
D)IV
Which of the shifts explains what would happen to the production possibility curve if restrictions were imposed on tuna fishing?A)I
B)II
C)III
D)IV
فتح الحزمة
افتح القفل للوصول البطاقات البالغ عددها 109 في هذه المجموعة.
فتح الحزمة
k this deck
55
Laissez-faire is an economic:
A)theorem because it is based on deductive analysis of a model that is based on assumptions.
B)theorem because it is the logical conclusion of a model with carefully stated relationships among variables.
C) precept because it is based on a model and normative judgments about the relevance of the model to the real world.
D)precept because it is the logical conclusion of a model with widely held assumptions.
فتح الحزمة
افتح القفل للوصول البطاقات البالغ عددها 109 في هذه المجموعة.
فتح الحزمة
k this deck
56
If a country takes advantage of the comparative advantage of some resources over others, its production possibility curve is likely to be:
A)flat.
B)straight.
C)bowed outward.
D)bowed inward.
A)flat.
B)straight.
C)bowed outward.
D)bowed inward.
فتح الحزمة
افتح القفل للوصول البطاقات البالغ عددها 109 في هذه المجموعة.
فتح الحزمة
k this deck
57
In election campaigns, presidents often promise more of everything (that is, more guns and more butter).What would help those elected president fulfill that promise?
A)The economy becomes more efficient.
B)The United States limits imports into the country.
C)Illegal immigration into the United States is severely limited.
D)A minimum wage bill is passed.
A)The economy becomes more efficient.
B)The United States limits imports into the country.
C)Illegal immigration into the United States is severely limited.
D)A minimum wage bill is passed.
فتح الحزمة
افتح القفل للوصول البطاقات البالغ عددها 109 في هذه المجموعة.
فتح الحزمة
k this deck
58
Refer to the graph below. Which of the shifts explains what would happen to the production possibility curve if improved technologies increased the production of prekindergarten (Pre-K) toys by 25 percent and the production of children's toys by 50 percent?
A)I
B)II
C)III
D)IV
Which of the shifts explains what would happen to the production possibility curve if improved technologies increased the production of prekindergarten (Pre-K) toys by 25 percent and the production of children's toys by 50 percent?A)I
B)II
C)III
D)IV
فتح الحزمة
افتح القفل للوصول البطاقات البالغ عددها 109 في هذه المجموعة.
فتح الحزمة
k this deck
59
Refer to the graph below. If the production possibility curve shifts along the Good Y axis, which point will remain as a point of efficiency?
A)A
B)B
C)C
D)D
If the production possibility curve shifts along the Good Y axis, which point will remain as a point of efficiency?A)A
B)B
C)C
D)D
فتح الحزمة
افتح القفل للوصول البطاقات البالغ عددها 109 في هذه المجموعة.
فتح الحزمة
k this deck
60
If no resources had a comparative advantage in the production of any good, the production possibility curve would be:
A)bowed outward.
B)bowed inward.
C)a horizontal line.
D)a downward-sloping straight line.
A)bowed outward.
B)bowed inward.
C)a horizontal line.
D)a downward-sloping straight line.
فتح الحزمة
افتح القفل للوصول البطاقات البالغ عددها 109 في هذه المجموعة.
فتح الحزمة
k this deck
61
The production possibility curves of two countries are given below: Refer to the production possibility curves of the two countries.If they specialized and traded, which of the following is the largest bundle each country could have?
A)15 chocolate and 15 textiles
B)20 chocolate and 20 textiles
C)30 chocolate and 30 textiles
D)60 chocolate and 60 textiles
Refer to the production possibility curves of the two countries.If they specialized and traded, which of the following is the largest bundle each country could have?A)15 chocolate and 15 textiles
B)20 chocolate and 20 textiles
C)30 chocolate and 30 textiles
D)60 chocolate and 60 textiles
فتح الحزمة
افتح القفل للوصول البطاقات البالغ عددها 109 في هذه المجموعة.
فتح الحزمة
k this deck
62
Up through the early decades of the 20th century, many countries remained closed to trade, charging high tariffs or imposing strict quotas on imported goods.In 1948, 23 countries joined the General Agreement on Tariffs and Trade (GATT), which sought to set out rules for trade and enhance future negotiations.The reduction in tariffs as a result of GATT probably brought about:
A)a decrease in consumption.
B)an increase in consumption.
C)no change in consumption.
D)a reduction in domestic production.
A)a decrease in consumption.
B)an increase in consumption.
C)no change in consumption.
D)a reduction in domestic production.
فتح الحزمة
افتح القفل للوصول البطاقات البالغ عددها 109 في هذه المجموعة.
فتح الحزمة
k this deck
63
John and Jane Smith are both economists who are deciding how to split household chores of cooking and cleaning.They discover that John has a comparative advantage in cooking.Does this discovery tell them anything about comparative advantage in cleaning?
A)No; both or neither may have a comparative advantage in cleaning.
B)No; either one may have a comparative advantage in cleaning.
C)Yes; John must also have a comparative advantage in cleaning.
D)Yes; Jane must have a comparative advantage in cleaning.
A)No; both or neither may have a comparative advantage in cleaning.
B)No; either one may have a comparative advantage in cleaning.
C)Yes; John must also have a comparative advantage in cleaning.
D)Yes; Jane must have a comparative advantage in cleaning.
فتح الحزمة
افتح القفل للوصول البطاقات البالغ عددها 109 في هذه المجموعة.
فتح الحزمة
k this deck
64
Countries gain from trade by producing:
A)the goods they produce at the highest opportunity cost.
B)the goods they can produce at the lowest opportunity cost.
C)where the production possibility curve has a slope of-1.
D)all goods in equal amounts.
A)the goods they produce at the highest opportunity cost.
B)the goods they can produce at the lowest opportunity cost.
C)where the production possibility curve has a slope of-1.
D)all goods in equal amounts.
فتح الحزمة
افتح القفل للوصول البطاقات البالغ عددها 109 في هذه المجموعة.
فتح الحزمة
k this deck
65
Given the production possibility tables for the First and Second Bakeries shown, we know that the opportunity cost of producing cookies:
A)is higher at First Bakery.
B)is higher at Second Bakery.
C)is the same at both bakeries.
D)cannot be computed without further information.
A)is higher at First Bakery.
B)is higher at Second Bakery.
C)is the same at both bakeries.
D)cannot be computed without further information.
فتح الحزمة
افتح القفل للوصول البطاقات البالغ عددها 109 في هذه المجموعة.
فتح الحزمة
k this deck
66
Suppose New Zealand uses one unit of labor to produce a kiwi and two units of labor to produce an apple.Suppose Australia uses two units of labor to produce a kiwi and one unit of labor to produce an apple.In this case, New Zealand:
A)has a comparative advantage in producing apples.
B)has a comparative advantage in producing kiwis.
C)has a comparative advantage in producing both goods.
D)does not have a comparative advantage in producing either good.
A)has a comparative advantage in producing apples.
B)has a comparative advantage in producing kiwis.
C)has a comparative advantage in producing both goods.
D)does not have a comparative advantage in producing either good.
فتح الحزمة
افتح القفل للوصول البطاقات البالغ عددها 109 في هذه المجموعة.
فتح الحزمة
k this deck
67
Refer to the graph shown. If Countries X and Y face the production possibility curves A and B, respectively, Country X has a comparative advantage in the production of:
A)neither agricultural goods nor industrial goods.
B)both agricultural goods and industrial goods.
C)agricultural goods only.
D)industrial goods only.
If Countries X and Y face the production possibility curves A and B, respectively, Country X has a comparative advantage in the production of:A)neither agricultural goods nor industrial goods.
B)both agricultural goods and industrial goods.
C)agricultural goods only.
D)industrial goods only.
فتح الحزمة
افتح القفل للوصول البطاقات البالغ عددها 109 في هذه المجموعة.
فتح الحزمة
k this deck
68
Trade based on comparative advantage benefits:
A)consumers in all countries.
B)consumers in some countries but hurts consumers in other countries.
C)neither producers nor consumers.
D)producers in all countries but not consumers.
A)consumers in all countries.
B)consumers in some countries but hurts consumers in other countries.
C)neither producers nor consumers.
D)producers in all countries but not consumers.
فتح الحزمة
افتح القفل للوصول البطاقات البالغ عددها 109 في هذه المجموعة.
فتح الحزمة
k this deck
69
The production possibility curves of two countries are given below: Refer to the production possibility curves of the two countries.Without trade, the most each country could produce would be:
A)15 chocolate and 15 textiles.
B)20 chocolate and 20 textiles.
C)30 chocolate and 30 textiles.
D)60 chocolate and 60 textiles.
Refer to the production possibility curves of the two countries.Without trade, the most each country could produce would be:A)15 chocolate and 15 textiles.
B)20 chocolate and 20 textiles.
C)30 chocolate and 30 textiles.
D)60 chocolate and 60 textiles.
فتح الحزمة
افتح القفل للوصول البطاقات البالغ عددها 109 في هذه المجموعة.
فتح الحزمة
k this deck
70
Given the production possibility tables for First and Second Bakeries shown, we can determine that:
A)First Bakery has a comparative advantage in the production of both goods.
B)Second Bakery has a comparative advantage in the production of pies.
C)First Bakery has a comparative advantage in the production of pies.
D)neither bakery has a comparative advantage.
A)First Bakery has a comparative advantage in the production of both goods.
B)Second Bakery has a comparative advantage in the production of pies.
C)First Bakery has a comparative advantage in the production of pies.
D)neither bakery has a comparative advantage.
فتح الحزمة
افتح القفل للوصول البطاقات البالغ عددها 109 في هذه المجموعة.
فتح الحزمة
k this deck
71
Suppose that in Slovakia one unit of labor can produce either 16 tons of wheat or 32 tons of soy and in Poland one unit of labor can produce either 4 tons of wheat or 2 tons of soy.Given this information, which of the following statements is true?
A)Slovakia has a comparative advantage in producing neither wheat nor soy.
B)Slovakia has a comparative advantage in producing both wheat and soy.
C)Poland has a comparative advantage in producing soy but not wheat.
D)Poland has a comparative advantage in producing wheat but not soy.
A)Slovakia has a comparative advantage in producing neither wheat nor soy.
B)Slovakia has a comparative advantage in producing both wheat and soy.
C)Poland has a comparative advantage in producing soy but not wheat.
D)Poland has a comparative advantage in producing wheat but not soy.
فتح الحزمة
افتح القفل للوصول البطاقات البالغ عددها 109 في هذه المجموعة.
فتح الحزمة
k this deck
72
Refer to the graph shown. If Countries X and Y face the production possibility curves A and B, respectively, Country Y has a comparative advantage in the production of:
A)neither agricultural goods nor industrial goods.
B)both agricultural goods and industrial goods.
C)agricultural goods only.
D)industrial goods only.
If Countries X and Y face the production possibility curves A and B, respectively, Country Y has a comparative advantage in the production of:A)neither agricultural goods nor industrial goods.
B)both agricultural goods and industrial goods.
C)agricultural goods only.
D)industrial goods only.
فتح الحزمة
افتح القفل للوصول البطاقات البالغ عددها 109 في هذه المجموعة.
فتح الحزمة
k this deck
73
Suppose that in Colombia one unit of labor can produce 8 tons of papayas or 2 tons of bananas and in Brazil, one unit of labor can produce either 2 tons of papayas or 4 tons of bananas.If each country has two units of labor, which of the following consumption combinations can be attained only with trade?
A)Brazil consumes 8 tons of bananas and no papayas.
B)Colombia consumes 16 tons of papayas and no bananas.
C)Brazil consumes 2 tons of papayas and 4 tons of bananas.
D)Colombia consumes 8 tons of papayas and 4 tons of bananas.
A)Brazil consumes 8 tons of bananas and no papayas.
B)Colombia consumes 16 tons of papayas and no bananas.
C)Brazil consumes 2 tons of papayas and 4 tons of bananas.
D)Colombia consumes 8 tons of papayas and 4 tons of bananas.
فتح الحزمة
افتح القفل للوصول البطاقات البالغ عددها 109 في هذه المجموعة.
فتح الحزمة
k this deck
74
The production possibility frontiers of Northland and Southland are given.Without trade, Northland produces and consumes 20 apples and 5 bananas and Southland produces and consumes 10 apples and 40 bananas.Could they increase their consumption bundle by changing production and trading?
A)No; Southland does at least as well at producing both, so it would have no incentive to trade.
B)Yes; they could gain 75 bananas and 60 apples.
C)Yes; they could gain up to 60 apples without losing bananas
D)Yes; they could gain up to 15 bananas without losing apples.
A)No; Southland does at least as well at producing both, so it would have no incentive to trade.
B)Yes; they could gain 75 bananas and 60 apples.
C)Yes; they could gain up to 60 apples without losing bananas
D)Yes; they could gain up to 15 bananas without losing apples.
فتح الحزمة
افتح القفل للوصول البطاقات البالغ عددها 109 في هذه المجموعة.
فتح الحزمة
k this deck
75
Mexico has a comparative advantage in producing corn:
A)if its opportunity cost of producing corn is higher than the opportunity cost in other countries.
B)if its opportunity cost of producing corn is the same as the opportunity cost in other countries.
C)if its opportunity cost of producing corn is lower than the opportunity cost in other countries.
D)regardless of the opportunity cost in other countries.
فتح الحزمة
افتح القفل للوصول البطاقات البالغ عددها 109 في هذه المجموعة.
فتح الحزمة
k this deck
76
Given the production possibility tables for First and Second Bakeries shown, we know that the opportunity cost of producing pies:
A)is higher at First Bakery.
B)is higher at Second Bakery.
C)is the same at both bakeries.
D)cannot be computed without further information.
A)is higher at First Bakery.
B)is higher at Second Bakery.
C)is the same at both bakeries.
D)cannot be computed without further information.
فتح الحزمة
افتح القفل للوصول البطاقات البالغ عددها 109 في هذه المجموعة.
فتح الحزمة
k this deck
77
Two countries that specialize their production along the lines of comparative advantage and then trade with each other will be able to:
A)both produce and consume more.
B)produce more and consume less.
C)produce less and consume more.
D)both produce and consume less.
A)both produce and consume more.
B)produce more and consume less.
C)produce less and consume more.
D)both produce and consume less.
فتح الحزمة
افتح القفل للوصول البطاقات البالغ عددها 109 في هذه المجموعة.
فتح الحزمة
k this deck
78
Suppose that in Colombia one unit of labor can produce 8 tons of papayas or 2 tons of bananas and in Brazil, one unit of labor can produce either 4 tons of papayas or 1 ton of bananas.Given this information, which of the following statements is true?
A)Columbia has a comparative advantage in producing papayas but not bananas.
B)Columbia has a comparative advantage in producing papayas and bananas.
C)These countries would increase combined consumption if they specialized and traded.
D)These countries cannot gain from trading.
A)Columbia has a comparative advantage in producing papayas but not bananas.
B)Columbia has a comparative advantage in producing papayas and bananas.
C)These countries would increase combined consumption if they specialized and traded.
D)These countries cannot gain from trading.
فتح الحزمة
افتح القفل للوصول البطاقات البالغ عددها 109 في هذه المجموعة.
فتح الحزمة
k this deck
79
John can clean the house in three hours and do the laundry in four.Jane can clean the house in two hours or do the laundry in two.Can they benefit by specialization and trade?
A)Neither can benefit because John has nothing to offer.
B)John could benefit from an exchange, but Jane cannot because she is better at both.
C)Both can benefit because John has a comparative advantage in laundry.
D)Both can benefit because John has a comparative advantage in cleaning.
A)Neither can benefit because John has nothing to offer.
B)John could benefit from an exchange, but Jane cannot because she is better at both.
C)Both can benefit because John has a comparative advantage in laundry.
D)Both can benefit because John has a comparative advantage in cleaning.
فتح الحزمة
افتح القفل للوصول البطاقات البالغ عددها 109 في هذه المجموعة.
فتح الحزمة
k this deck
80
Suppose that in Slovakia one unit of labor can produce either 20 tons of wheat or 40 tons of soy and in Poland one unit of labor can produce either 40 tons of wheat or 20 tons of soy.If each country has two units of labor, which of the following consumption combinations can be attained only with trade?
A)Slovakia consumes 80 tons of soy.
B)Slovakia consumes 30 tons of both soy and wheat.
C)Poland consumes 80 tons of wheat.
D)Poland consumes 40 tons of wheat and 20 tons of soy.
A)Slovakia consumes 80 tons of soy.
B)Slovakia consumes 30 tons of both soy and wheat.
C)Poland consumes 80 tons of wheat.
D)Poland consumes 40 tons of wheat and 20 tons of soy.
فتح الحزمة
افتح القفل للوصول البطاقات البالغ عددها 109 في هذه المجموعة.
فتح الحزمة
k this deck
فتح الحزمة
افتح القفل للوصول البطاقات البالغ عددها 109 في هذه المجموعة.


