Deck 9: Estimating a Population Proportion
ملء الشاشة (f)
سؤال
The large sample confidence interval formula for estimating p can always safely be used if  .
.
. سؤال
سؤال
The standard error of  is
is  .
.
is . سؤال
سؤال
سؤال
سؤال
What proportion of college students have used cell phones to cheat on an exam?
Suppose you have been asked to estimate this proportion for students enrolled at a large college. Make an estimate of the margin of error (M) when there are 151 students in the survey. Assume a 95% confidence level.
A)
B)
C)
D)There is not enough information to make an estimate of M.
Suppose you have been asked to estimate this proportion for students enrolled at a large college. Make an estimate of the margin of error (M) when there are 151 students in the survey. Assume a 95% confidence level.
A)
B)
C)
D)There is not enough information to make an estimate of M.
سؤال
Three different statistics are being considered for estimating a population characteristic. The sampling distributions of the three statistics are shown in the following illustration: 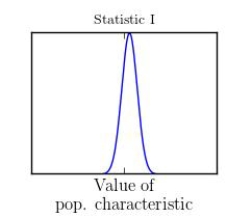
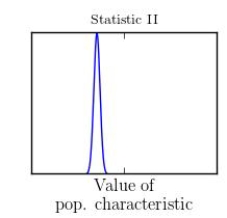
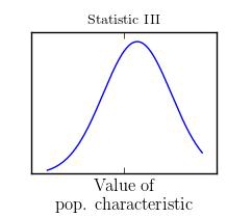 Which statistic would you recommend?
A)Statistic I
B)Statistic II
C)Statistic III
D)Statistic I or Statistic II
E)Statistic II or Statistic III
Which statistic would you recommend?A)Statistic I
B)Statistic II
C)Statistic III
D)Statistic I or Statistic II
E)Statistic II or Statistic III
سؤال
سؤال
سؤال
A random sample will be selected from the population of all adult residents of a particular city. The sample proportion  will be used to estimate p, the proportion of all adult residents who are registered to vote. For which of the following situations will the estimate tend to be closest to the actual value of p?
I.
II.
III.
A)I only
B)II only
C)III only
D)II and II only
E)All three estimates will be equally close to the actual value of p.
will be used to estimate p, the proportion of all adult residents who are registered to vote. For which of the following situations will the estimate tend to be closest to the actual value of p? I.
II.
III.
A)I only
B)II only
C)III only
D)II and II only
E)All three estimates will be equally close to the actual value of p.
سؤال
سؤال
سؤال
سؤال
سؤال
سؤال
سؤال
To estimate the proportion of faculty at a state university who own a home, a random sample of faculty is selected. For which of the following combinations of n and  would it be appropriate to use the confidence interval
 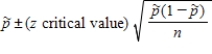 to estimate the population proportion?
A)
B)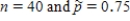
C)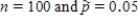
D)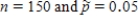
E)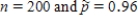
would it be appropriate to use the confidence interval to estimate the population proportion? A)
B)
C)
D)
E)
سؤال
سؤال
سؤال
سؤال
According to the article "The incidence of congenital heart disease." (Hoffman, J.I.E., Kaplan, S., J.Am.Coll.Cardiol. [2002]:1890-1900)about 1% of newborns in U.S. have congenital heart disease. A researcher wants to repeat this study to verify the results. He finds that 9 out of 984 newborns studied have congenital heart disease. Use the accompanying output from the "Bootstrap Confidence Interval for One Proportion" Shiny app to report a 95% bootstrap confidence interval for the proportion of the U.S. newborns who have congenital heart disease. Interpret the obtained result.
A)The 95% bootstrap confidence interval for the proportion of newborns with congenital heart disease is![<strong>According to the article The incidence of congenital heart disease. (Hoffman, J.I.E., Kaplan, S., J.Am.Coll.Cardiol. [2002]:1890-1900)about 1% of newborns in U.S. have congenital heart disease. A researcher wants to repeat this study to verify the results. He finds that 9 out of 984 newborns studied have congenital heart disease. Use the accompanying output from the Bootstrap Confidence Interval for One Proportion Shiny app to report a 95% bootstrap confidence interval for the proportion of the U.S. newborns who have congenital heart disease. Interpret the obtained result.</strong> A)The 95% bootstrap confidence interval for the proportion of newborns with congenital heart disease is .We can be 95% confident, that the actual proportion of newborns with congenital heart disease is somewhere between 0.1% and 1.7%. B)The 95% bootstrap confidence interval of proportion of newborns with congenital heart disease is .We can be 95% confident, that the actual proportion of newborns with congenital heart disease location between 0.6% and 1.2%. C)The 95% bootstrap confidence interval of proportion of newborns with congenital heart disease is .We can be 95% confident, that the actual proportion of newborns with congenital heart disease location between 0.3% and 1.5%. D)The 95% bootstrap confidence interval of proportion of newborns with congenital heart disease is .We can be 95% confident, that the actual proportion of newborns with congenital heart disease location between 0.5% and 1.4%. <div style=padding-top: 35px>](https://d2lvgg3v3hfg70.cloudfront.net/TB7677/11eb1903_1e14_3852_88d6_ebcae6aa92e8_TB7677_11.jpg) .We can be 95% confident, that the actual proportion of newborns with congenital heart disease is somewhere between 0.1% and 1.7%.
.We can be 95% confident, that the actual proportion of newborns with congenital heart disease is somewhere between 0.1% and 1.7%.
B)The 95% bootstrap confidence interval of proportion of newborns with congenital heart disease is![<strong>According to the article The incidence of congenital heart disease. (Hoffman, J.I.E., Kaplan, S., J.Am.Coll.Cardiol. [2002]:1890-1900)about 1% of newborns in U.S. have congenital heart disease. A researcher wants to repeat this study to verify the results. He finds that 9 out of 984 newborns studied have congenital heart disease. Use the accompanying output from the Bootstrap Confidence Interval for One Proportion Shiny app to report a 95% bootstrap confidence interval for the proportion of the U.S. newborns who have congenital heart disease. Interpret the obtained result.</strong> A)The 95% bootstrap confidence interval for the proportion of newborns with congenital heart disease is .We can be 95% confident, that the actual proportion of newborns with congenital heart disease is somewhere between 0.1% and 1.7%. B)The 95% bootstrap confidence interval of proportion of newborns with congenital heart disease is .We can be 95% confident, that the actual proportion of newborns with congenital heart disease location between 0.6% and 1.2%. C)The 95% bootstrap confidence interval of proportion of newborns with congenital heart disease is .We can be 95% confident, that the actual proportion of newborns with congenital heart disease location between 0.3% and 1.5%. D)The 95% bootstrap confidence interval of proportion of newborns with congenital heart disease is .We can be 95% confident, that the actual proportion of newborns with congenital heart disease location between 0.5% and 1.4%. <div style=padding-top: 35px>](https://d2lvgg3v3hfg70.cloudfront.net/TB7677/11eb1903_1e14_3853_88d6_7fbbb9fcfee7_TB7677_11.jpg) .We can be 95% confident, that the actual proportion of newborns with congenital heart disease location between 0.6% and 1.2%.
.We can be 95% confident, that the actual proportion of newborns with congenital heart disease location between 0.6% and 1.2%.
C)The 95% bootstrap confidence interval of proportion of newborns with congenital heart disease is![<strong>According to the article The incidence of congenital heart disease. (Hoffman, J.I.E., Kaplan, S., J.Am.Coll.Cardiol. [2002]:1890-1900)about 1% of newborns in U.S. have congenital heart disease. A researcher wants to repeat this study to verify the results. He finds that 9 out of 984 newborns studied have congenital heart disease. Use the accompanying output from the Bootstrap Confidence Interval for One Proportion Shiny app to report a 95% bootstrap confidence interval for the proportion of the U.S. newborns who have congenital heart disease. Interpret the obtained result.</strong> A)The 95% bootstrap confidence interval for the proportion of newborns with congenital heart disease is .We can be 95% confident, that the actual proportion of newborns with congenital heart disease is somewhere between 0.1% and 1.7%. B)The 95% bootstrap confidence interval of proportion of newborns with congenital heart disease is .We can be 95% confident, that the actual proportion of newborns with congenital heart disease location between 0.6% and 1.2%. C)The 95% bootstrap confidence interval of proportion of newborns with congenital heart disease is .We can be 95% confident, that the actual proportion of newborns with congenital heart disease location between 0.3% and 1.5%. D)The 95% bootstrap confidence interval of proportion of newborns with congenital heart disease is .We can be 95% confident, that the actual proportion of newborns with congenital heart disease location between 0.5% and 1.4%. <div style=padding-top: 35px>](https://d2lvgg3v3hfg70.cloudfront.net/TB7677/11eb1903_1e14_5f64_88d6_07831cb15000_TB7677_11.jpg) .We can be 95% confident, that the actual proportion of newborns with congenital heart disease location between 0.3% and 1.5%.
.We can be 95% confident, that the actual proportion of newborns with congenital heart disease location between 0.3% and 1.5%.
D)The 95% bootstrap confidence interval of proportion of newborns with congenital heart disease is![<strong>According to the article The incidence of congenital heart disease. (Hoffman, J.I.E., Kaplan, S., J.Am.Coll.Cardiol. [2002]:1890-1900)about 1% of newborns in U.S. have congenital heart disease. A researcher wants to repeat this study to verify the results. He finds that 9 out of 984 newborns studied have congenital heart disease. Use the accompanying output from the Bootstrap Confidence Interval for One Proportion Shiny app to report a 95% bootstrap confidence interval for the proportion of the U.S. newborns who have congenital heart disease. Interpret the obtained result.</strong> A)The 95% bootstrap confidence interval for the proportion of newborns with congenital heart disease is .We can be 95% confident, that the actual proportion of newborns with congenital heart disease is somewhere between 0.1% and 1.7%. B)The 95% bootstrap confidence interval of proportion of newborns with congenital heart disease is .We can be 95% confident, that the actual proportion of newborns with congenital heart disease location between 0.6% and 1.2%. C)The 95% bootstrap confidence interval of proportion of newborns with congenital heart disease is .We can be 95% confident, that the actual proportion of newborns with congenital heart disease location between 0.3% and 1.5%. D)The 95% bootstrap confidence interval of proportion of newborns with congenital heart disease is .We can be 95% confident, that the actual proportion of newborns with congenital heart disease location between 0.5% and 1.4%. <div style=padding-top: 35px>](https://d2lvgg3v3hfg70.cloudfront.net/TB7677/11eb1903_1e14_5f65_88d6_9b6bc91a9fac_TB7677_11.jpg) .We can be 95% confident, that the actual proportion of newborns with congenital heart disease location between 0.5% and 1.4%.
.We can be 95% confident, that the actual proportion of newborns with congenital heart disease location between 0.5% and 1.4%.
A)The 95% bootstrap confidence interval for the proportion of newborns with congenital heart disease is
.We can be 95% confident, that the actual proportion of newborns with congenital heart disease is somewhere between 0.1% and 1.7%.B)The 95% bootstrap confidence interval of proportion of newborns with congenital heart disease is
.We can be 95% confident, that the actual proportion of newborns with congenital heart disease location between 0.6% and 1.2%.C)The 95% bootstrap confidence interval of proportion of newborns with congenital heart disease is
.We can be 95% confident, that the actual proportion of newborns with congenital heart disease location between 0.3% and 1.5%.D)The 95% bootstrap confidence interval of proportion of newborns with congenital heart disease is
.We can be 95% confident, that the actual proportion of newborns with congenital heart disease location between 0.5% and 1.4%. سؤال
سؤال
سؤال
سؤال
سؤال
سؤال
سؤال
سؤال
سؤال
سؤال
Clara is a reporter of a local newspaper. For her new article she wants to find out the average percent of people in her city who prefer to shop online. For this purpose she had chosen several points in different areas of the city and questioned passers-by in these points. What would be the most convenient form for presenting the final results of the conducted survey in order to be sure that this information has minimum risk to be incorrect?
A) .Clara should use the confidence level of 90%.
B) .Clara should use the standard confidence level.
C) .Clara should use the confidence level of 95%.
D) .Clara should show only the value of the sample proportion.
E) .Clara should use the confidence level of 99%.
A)
.Clara should use the confidence level of 90%.B)
.Clara should use the standard confidence level.C)
.Clara should use the confidence level of 95%.D)
.Clara should show only the value of the sample proportion.E)
.Clara should use the confidence level of 99%. سؤال
سؤال
The management of the company decided to find out what percent of employees are late for work. According to the results of observations performed during the month, it was found that on average each day about 7.5% of employees are late for work. The standard error of the study was 0.011. Find and interpret the margin of error for this study with the confidence level of 95%.
A)The margin of error is 0.022.This estimate or 7.5% differs from the actual population proportion (real proportion of employees who are late for work) by no more than 0.022 (or 2.2%).
B)The margin of error is 0.018.This estimate or 7.5% differs from the actual population proportion (real proportion of employees who are late for work) by no more than 0.018 (or 1.8%).
C)The margin of error is 0.011.This estimate or 7.5% differs from the actual population proportion (real proportion of employees who are late for work) by no more than 0.011 (or 1.1%)
D)The margin of error is 0.022.This estimate or 7.5% differs from the actual population proportion (real proportion of employees who are late for work) by no more than 0.011 (or 1.1%).
E)The margin of error is 0.018.This estimate or 7.5% differs from the actual population proportion (real proportion of employees who are late for work) by no more than 0.009 (or 0.9%).
A)The margin of error is 0.022.This estimate
or 7.5% differs from the actual population proportion (real proportion of employees who are late for work) by no more than 0.022 (or 2.2%).B)The margin of error is 0.018.This estimate
or 7.5% differs from the actual population proportion (real proportion of employees who are late for work) by no more than 0.018 (or 1.8%).C)The margin of error is 0.011.This estimate
or 7.5% differs from the actual population proportion (real proportion of employees who are late for work) by no more than 0.011 (or 1.1%)D)The margin of error is 0.022.This estimate
or 7.5% differs from the actual population proportion (real proportion of employees who are late for work) by no more than 0.011 (or 1.1%).E)The margin of error is 0.018.This estimate
or 7.5% differs from the actual population proportion (real proportion of employees who are late for work) by no more than 0.009 (or 0.9%). سؤال
سؤال

فتح الحزمة
قم بالتسجيل لفتح البطاقات في هذه المجموعة!
Unlock Deck
Unlock Deck
1/36
العب
ملء الشاشة (f)
Deck 9: Estimating a Population Proportion
1
The large sample confidence interval formula for estimating p can always safely be used if .
.False
2
If the distribution of a population is symmetric, both the mean and median give unbiased estimates of the population mean. What criteria would you consider in choosing which statistic to use if you wanted to estimate the population mean?
Choose the statistic that has the lower variability (smaller standard deviation). If the distribution is normal, this will be the sample mean. If the distribution has heavy tails, then the sample median may be a better choice.
3
The standard error of is .
is .False
4
Using an unbiased statistic guarantees that there will be no systematic tendency to under- or overestimate the value of the population characteristic and that estimates will almost always be relatively close to the true value.
فتح الحزمة
افتح القفل للوصول البطاقات البالغ عددها 36 في هذه المجموعة.
فتح الحزمة
k this deck
5
What is the difference between an unbiased statistic and a biased statistic?
فتح الحزمة
افتح القفل للوصول البطاقات البالغ عددها 36 في هذه المجموعة.
فتح الحزمة
k this deck
6
A 90% confidence interval for a population proportion calculated using data from a random sample of size n = 51 is (0.573, 0.787). Which of the following is the 95% confidence interval calculated from the same data?
A)(0.602, 0.758)
B)(0.620, 0.740)
C)(0.553, 0.807)
D)(0.543, 0.817)
E)(0.486, 0.874)
A)(0.602, 0.758)
B)(0.620, 0.740)
C)(0.553, 0.807)
D)(0.543, 0.817)
E)(0.486, 0.874)
فتح الحزمة
افتح القفل للوصول البطاقات البالغ عددها 36 في هذه المجموعة.
فتح الحزمة
k this deck
7
What proportion of college students have used cell phones to cheat on an exam?
Suppose you have been asked to estimate this proportion for students enrolled at a large college. Make an estimate of the margin of error (M) when there are 151 students in the survey. Assume a 95% confidence level.
A)
B)
C)
D)There is not enough information to make an estimate of M.
Suppose you have been asked to estimate this proportion for students enrolled at a large college. Make an estimate of the margin of error (M) when there are 151 students in the survey. Assume a 95% confidence level.
A)
B)
C)
D)There is not enough information to make an estimate of M.
فتح الحزمة
افتح القفل للوصول البطاقات البالغ عددها 36 في هذه المجموعة.
فتح الحزمة
k this deck
8
Three different statistics are being considered for estimating a population characteristic. The sampling distributions of the three statistics are shown in the following illustration: Which statistic would you recommend?
A)Statistic I
B)Statistic II
C)Statistic III
D)Statistic I or Statistic II
E)Statistic II or Statistic III
Which statistic would you recommend?A)Statistic I
B)Statistic II
C)Statistic III
D)Statistic I or Statistic II
E)Statistic II or Statistic III
فتح الحزمة
افتح القفل للوصول البطاقات البالغ عددها 36 في هذه المجموعة.
فتح الحزمة
k this deck
9
Chuck has decided to increase the size of the sample he uses to estimate a population proportion.
What is the effect on the width of the associated confidence interval?
A)The width of the confidence interval increases.
B)The width of the confidence interval decreases.
C)The width of the confidence interval is unchanged.
D)There is not enough information to say.
What is the effect on the width of the associated confidence interval?
A)The width of the confidence interval increases.
B)The width of the confidence interval decreases.
C)The width of the confidence interval is unchanged.
D)There is not enough information to say.
فتح الحزمة
افتح القفل للوصول البطاقات البالغ عددها 36 في هذه المجموعة.
فتح الحزمة
k this deck
10
An unbiased statistic is one that
A)is closely approximated by a normal curve.
B)has the smallest variance.
C)is mound-shaped.
D)is nearly symmetric.
E)does not consistently tend to underestimate or to overestimate the value of a population characteristic.
A)is closely approximated by a normal curve.
B)has the smallest variance.
C)is mound-shaped.
D)is nearly symmetric.
E)does not consistently tend to underestimate or to overestimate the value of a population characteristic.
فتح الحزمة
افتح القفل للوصول البطاقات البالغ عددها 36 في هذه المجموعة.
فتح الحزمة
k this deck
11
A random sample will be selected from the population of all adult residents of a particular city. The sample proportion will be used to estimate p, the proportion of all adult residents who are registered to vote. For which of the following situations will the estimate tend to be closest to the actual value of p?
I.
II.
III.
A)I only
B)II only
C)III only
D)II and II only
E)All three estimates will be equally close to the actual value of p.
will be used to estimate p, the proportion of all adult residents who are registered to vote. For which of the following situations will the estimate tend to be closest to the actual value of p? I.
II.
III.
A)I only
B)II only
C)III only
D)II and II only
E)All three estimates will be equally close to the actual value of p.
فتح الحزمة
افتح القفل للوصول البطاقات البالغ عددها 36 في هذه المجموعة.
فتح الحزمة
k this deck
12
The sampling distribution of p tends to be more spread out for larger sample sizes than for smaller sample sizes.
فتح الحزمة
افتح القفل للوصول البطاقات البالغ عددها 36 في هذه المجموعة.
فتح الحزمة
k this deck
13
Jasmine has decided to decrease the confidence level in her estimation of a population proportion. What is the effect on the width of the associated confidence interval?
A)The width of the confidence interval increases.
B)The width of the confidence interval decreases.
C)The width of the confidence interval is unchanged.
D)There is not enough information to say.
A)The width of the confidence interval increases.
B)The width of the confidence interval decreases.
C)The width of the confidence interval is unchanged.
D)There is not enough information to say.
فتح الحزمة
افتح القفل للوصول البطاقات البالغ عددها 36 في هذه المجموعة.
فتح الحزمة
k this deck
14
A manufacturer of small appliances purchases plastic handles for coffeepots from an outside vendor. If a handle is cracked, it is considered defective and can't be used. A large shipment of plastic handles is received. How many handles from the shipment should be inspected in order to estimate p, the proportion of defective handles in the shipment, with a margin of error of 0.13 or less? (Assume a confidence level of 95%).
A)4 handles
B)113 handles
C)57 handles
D)228 handles
E)100 handles
A)4 handles
B)113 handles
C)57 handles
D)228 handles
E)100 handles
فتح الحزمة
افتح القفل للوصول البطاقات البالغ عددها 36 في هذه المجموعة.
فتح الحزمة
k this deck
15
Holding all other elements equal, an increase in sample size will result in a wider confidence interval.
فتح الحزمة
افتح القفل للوصول البطاقات البالغ عددها 36 في هذه المجموعة.
فتح الحزمة
k this deck
16
A statistic that is unbiased with a small standard error is likely to result in an estimate that is close to the actual value of the population characteristic.
فتح الحزمة
افتح القفل للوصول البطاقات البالغ عددها 36 في هذه المجموعة.
فتح الحزمة
k this deck
17
When choosing a statistic for computing an estimate, what factors should be considered?
فتح الحزمة
افتح القفل للوصول البطاقات البالغ عددها 36 في هذه المجموعة.
فتح الحزمة
k this deck
18
To estimate the proportion of faculty at a state university who own a home, a random sample of faculty is selected. For which of the following combinations of n and would it be appropriate to use the confidence interval to estimate the population proportion?
A)
B)
C)
D)
E)
would it be appropriate to use the confidence interval to estimate the population proportion? A)
B)
C)
D)
E)
فتح الحزمة
افتح القفل للوصول البطاقات البالغ عددها 36 في هذه المجموعة.
فتح الحزمة
k this deck
19
Suppose that a random sample of 85 high school classrooms in the state of Iowa is selected and a 95% confidence interval for the proportion that has Internet access is (0.73, 0.79). Which of the following is a correct interpretation of the 95% confidence level?
A)The method used to construct the interval will produce an interval that includes the value of the population proportion about 95% of the time in repeated sampling.
B)You can be 95% confident that the sample proportion is between 0.73 and 0.79.
C)There is a 95% chance that the proportion of all high school classrooms in Iowa that have Internet access is between 0.73 and 0.79.
D)You can be 95% confident that the proportion of all high school classrooms in Iowa that have Internet access is between 0.73 and 0.79.
E)None of the above is a correct interpretation of the confidence level.
فتح الحزمة
افتح القفل للوصول البطاقات البالغ عددها 36 في هذه المجموعة.
فتح الحزمة
k this deck
20
All else being equal, the higher the confidence level, the wider the confidence interval.
فتح الحزمة
افتح القفل للوصول البطاقات البالغ عددها 36 في هذه المجموعة.
فتح الحزمة
k this deck
21
Eyestrain is thought to be associated with different types of office work. The Acme Temp-Help Company provides short-term employees to substitute for vacationing data entry personnel. Previous research has shown that approximately 21% of full time data entry personnel have eyestrain, and Acme would like to estimate the proportion, p, of their 6,000 part-time data entry employees that have eyestrain.
a)They would like to estimate p to within 0.05 with 95% confidence. If they accept the starting value of 0.21 as a reasonable initial estimate of p, what sample size should they use for their study?
b)Suppose Acme had felt that the working conditions of their temporary data entry personnel were different enough that they should not depend on the 0.21 as an initial estimate. In a few sentences, explain how your procedure for choosing a samples size would differ from your solution in part (a). (Do NOT recalculate a new estimate of the necessary sample size!)
فتح الحزمة
افتح القفل للوصول البطاقات البالغ عددها 36 في هذه المجموعة.
فتح الحزمة
k this deck
22
According to the article "The incidence of congenital heart disease." (Hoffman, J.I.E., Kaplan, S., J.Am.Coll.Cardiol. [2002]:1890-1900)about 1% of newborns in U.S. have congenital heart disease. A researcher wants to repeat this study to verify the results. He finds that 9 out of 984 newborns studied have congenital heart disease. Use the accompanying output from the "Bootstrap Confidence Interval for One Proportion" Shiny app to report a 95% bootstrap confidence interval for the proportion of the U.S. newborns who have congenital heart disease. Interpret the obtained result.
A)The 95% bootstrap confidence interval for the proportion of newborns with congenital heart disease is .We can be 95% confident, that the actual proportion of newborns with congenital heart disease is somewhere between 0.1% and 1.7%.
B)The 95% bootstrap confidence interval of proportion of newborns with congenital heart disease is .We can be 95% confident, that the actual proportion of newborns with congenital heart disease location between 0.6% and 1.2%.
C)The 95% bootstrap confidence interval of proportion of newborns with congenital heart disease is .We can be 95% confident, that the actual proportion of newborns with congenital heart disease location between 0.3% and 1.5%.
D)The 95% bootstrap confidence interval of proportion of newborns with congenital heart disease is .We can be 95% confident, that the actual proportion of newborns with congenital heart disease location between 0.5% and 1.4%.
A)The 95% bootstrap confidence interval for the proportion of newborns with congenital heart disease is
.We can be 95% confident, that the actual proportion of newborns with congenital heart disease is somewhere between 0.1% and 1.7%.B)The 95% bootstrap confidence interval of proportion of newborns with congenital heart disease is
.We can be 95% confident, that the actual proportion of newborns with congenital heart disease location between 0.6% and 1.2%.C)The 95% bootstrap confidence interval of proportion of newborns with congenital heart disease is
.We can be 95% confident, that the actual proportion of newborns with congenital heart disease location between 0.3% and 1.5%.D)The 95% bootstrap confidence interval of proportion of newborns with congenital heart disease is
.We can be 95% confident, that the actual proportion of newborns with congenital heart disease location between 0.5% and 1.4%. فتح الحزمة
افتح القفل للوصول البطاقات البالغ عددها 36 في هذه المجموعة.
فتح الحزمة
k this deck
23
Conventional home smoke alarms have too often failed to awaken sleeping children--they are remarkably resistant to being awakened by sound, even in the daytime! Researchers are studying the possibility that a personalized "voice" smoke alarm would be more effective than mere sound. The idea is that a recording of the mother's voice calling the child's name may be an improvement over existing systems.
a)The researchers would like to estimate p to within 0.05 with 95% confidence. Past experience has shown that conventional alarms are effective about 0.58 of the time. If this is accepted as a reasonable initial estimate of p, what sample size should they use for their study?
b)Suppose the researchers felt that the original study, done with children of parents working in a single hospital, was different enough so that their results (p = 0.58) should not be relied upon. In a few sentences, explain how your procedure for choosing a samples size would differ from your solution in part (a). (Do NOT recalculate a new estimate of the necessary sample size!)
فتح الحزمة
افتح القفل للوصول البطاقات البالغ عددها 36 في هذه المجموعة.
فتح الحزمة
k this deck
24
One difficulty in measuring the nesting success of birds is that the researchers must count the eggs in the nest, which is disturbing to the parents. Even though the researcher does not harm the birds, the flight of the bird might alert predators to the presence of a nest. To see if researcher activity might degrade nesting success, the nest survival of 102 nests that had their eggs counted, was recorded. Sixty-four of the nests failed (i.e. the parent abandoned the nest).
a)Construct and interpret a 95% confidence interval for the proportion of nest failures in the population.
b)The "normal" nest failure rate of these birds is 29%. Based on the confidence interval from part (a), do you think that the researcher's activity affects nesting success? Justify your answer with an appropriate statistical argument.
فتح الحزمة
افتح القفل للوصول البطاقات البالغ عددها 36 في هذه المجموعة.
فتح الحزمة
k this deck
25
A recent study investigated the effects of a "Buckle Up Your Toddlers" campaign to get parents to use the grocery cart seat belts. Investigators observed a simple random sample of parents in a large city, and found 192 out of 594 parents buckling up their toddlers.
a)Compute an estimate of the true proportion of all parents who buckle up their toddlers.
b)Construct and interpret a 95% confidence interval for p, the true proportion of all parents who buckle up their toddlers.
a)Compute an estimate of the true proportion of all parents who buckle up their toddlers.
b)Construct and interpret a 95% confidence interval for p, the true proportion of all parents who buckle up their toddlers.
فتح الحزمة
افتح القفل للوصول البطاقات البالغ عددها 36 في هذه المجموعة.
فتح الحزمة
k this deck
26
Suppose that a newspaper conducts a survey of a random sample of 120 registered voters in order to predict the winner of a local election. The Republican candidate was favored by 62 of the respondents.
a)Construct and interpret a 99% CI for the true proportion of voters who prefer the Republican candidate.
b)If a candidate needs a simple majority of the votes to win the election, can the Republican candidate be confident of victory? Justify your response with an appropriate statistical argument.
a)Construct and interpret a 99% CI for the true proportion of voters who prefer the Republican candidate.
b)If a candidate needs a simple majority of the votes to win the election, can the Republican candidate be confident of victory? Justify your response with an appropriate statistical argument.
فتح الحزمة
افتح القفل للوصول البطاقات البالغ عددها 36 في هذه المجموعة.
فتح الحزمة
k this deck
27
A manager of a dealer center wants to know what is the percentage of consumers who prefer sedan cars. He collects some information about selling cars in his city from several dealer centers. It appears that 47 consumers out of 142 prefer sedan cars. Estimate the proportion of consumers who prefer a sedan and calculate the margin of error with the confidence level of 95%.
A)The proportion of consumers who prefer sedan cars is 0.33, the margin of error is 0.065.
B)The proportion of consumers who prefer sedan cars is 0.47, the margin of error is 0.078.
C)The proportion of consumers who prefer sedan cars is 0.33, the margin of error is 0.078.
D)The proportion of consumers who prefer sedan cars is 0.33, the margin of error is 0.033.
E)The proportion of consumers who prefer sedan cars is 0.47, the margin of error is 0.040.
فتح الحزمة
افتح القفل للوصول البطاقات البالغ عددها 36 في هذه المجموعة.
فتح الحزمة
k this deck
28
A researcher would like to determine the proportion of college students who support capping textbook prices. The researcher gathers a random sample of 500 students and asks whether or not they support textbook price caps. Of the 500 students, 378 say they support capping textbook prices. Determine if the large sample confidence interval procedure can be used for estimation and create a 95% confidence interval for the population proportion.
فتح الحزمة
افتح القفل للوصول البطاقات البالغ عددها 36 في هذه المجموعة.
فتح الحزمة
k this deck
29
Briefly define the following terms in your own words:
a)Confidence interval
b)The confidence level associated with a confidence interval
a)Confidence interval
b)The confidence level associated with a confidence interval
فتح الحزمة
افتح القفل للوصول البطاقات البالغ عددها 36 في هذه المجموعة.
فتح الحزمة
k this deck
30
In a very large school district student records have been kept in three distinct data bases, one each for elementary, middle, and high school. Because of this, data entry errors tend to be compounded as students move through the grades. The district now has a new data base and wishes to fix the original data entry errors. To allocate enough secretarial time to this task, an estimate of the proportion of records that contain errors must be made. Initial estimates are that there are fixable errors in about 15% of the records. Based on the 15% assumption, compute the sample size required to estimate the true proportion of records with errors to within .025 with 95% confidence.
فتح الحزمة
افتح القفل للوصول البطاقات البالغ عددها 36 في هذه المجموعة.
فتح الحزمة
k this deck
31
An understanding of bird's choices of habitat is a crucial element in understanding avian biology and ecology. One aspect of habitat choice is the pattern of their preferred vertical height when feeding in forests. In a study of small birds in an old-growth forest in the Pacific Northwest, researchers (suspended from a giant crane!) observed the landings of Golden-crowned kinglets (Regulus strapa). They found that 78 of the 163 landings were in the "mid" height region, 21-40 meters above ground.
a)Compute an estimate of the population proportion of all landings of these kinglets that are in the 21 - 40 meter height range.
b)Construct and interpret a 95% confidence interval for p, the population proportion of all landings of these kinglets that are in the 21 - 40 meter height range.
a)Compute an estimate of the population proportion of all landings of these kinglets that are in the 21 - 40 meter height range.
b)Construct and interpret a 95% confidence interval for p, the population proportion of all landings of these kinglets that are in the 21 - 40 meter height range.
فتح الحزمة
افتح القفل للوصول البطاقات البالغ عددها 36 في هذه المجموعة.
فتح الحزمة
k this deck
32
Clara is a reporter of a local newspaper. For her new article she wants to find out the average percent of people in her city who prefer to shop online. For this purpose she had chosen several points in different areas of the city and questioned passers-by in these points. What would be the most convenient form for presenting the final results of the conducted survey in order to be sure that this information has minimum risk to be incorrect?
A) .Clara should use the confidence level of 90%.
B) .Clara should use the standard confidence level.
C) .Clara should use the confidence level of 95%.
D) .Clara should show only the value of the sample proportion.
E) .Clara should use the confidence level of 99%.
A)
.Clara should use the confidence level of 90%.B)
.Clara should use the standard confidence level.C)
.Clara should use the confidence level of 95%.D)
.Clara should show only the value of the sample proportion.E)
.Clara should use the confidence level of 99%. فتح الحزمة
افتح القفل للوصول البطاقات البالغ عددها 36 في هذه المجموعة.
فتح الحزمة
k this deck
33
A 1976 study of smokers over 30 years of age who delivered premature babies (fewer than 260 days of gestation) reported an infant survival rate of 72%. Suppose researchers would like to estimate the current survival rate. Based on the assumption that the survival rate today would be roughly similar to the survival rate in 1976, compute the sample size required to estimate the true survival proportion to within .05 with 95% confidence.
فتح الحزمة
افتح القفل للوصول البطاقات البالغ عددها 36 في هذه المجموعة.
فتح الحزمة
k this deck
34
The management of the company decided to find out what percent of employees are late for work. According to the results of observations performed during the month, it was found that on average each day about 7.5% of employees are late for work. The standard error of the study was 0.011. Find and interpret the margin of error for this study with the confidence level of 95%.
A)The margin of error is 0.022.This estimate or 7.5% differs from the actual population proportion (real proportion of employees who are late for work) by no more than 0.022 (or 2.2%).
B)The margin of error is 0.018.This estimate or 7.5% differs from the actual population proportion (real proportion of employees who are late for work) by no more than 0.018 (or 1.8%).
C)The margin of error is 0.011.This estimate or 7.5% differs from the actual population proportion (real proportion of employees who are late for work) by no more than 0.011 (or 1.1%)
D)The margin of error is 0.022.This estimate or 7.5% differs from the actual population proportion (real proportion of employees who are late for work) by no more than 0.011 (or 1.1%).
E)The margin of error is 0.018.This estimate or 7.5% differs from the actual population proportion (real proportion of employees who are late for work) by no more than 0.009 (or 0.9%).
A)The margin of error is 0.022.This estimate
or 7.5% differs from the actual population proportion (real proportion of employees who are late for work) by no more than 0.022 (or 2.2%).B)The margin of error is 0.018.This estimate
or 7.5% differs from the actual population proportion (real proportion of employees who are late for work) by no more than 0.018 (or 1.8%).C)The margin of error is 0.011.This estimate
or 7.5% differs from the actual population proportion (real proportion of employees who are late for work) by no more than 0.011 (or 1.1%)D)The margin of error is 0.022.This estimate
or 7.5% differs from the actual population proportion (real proportion of employees who are late for work) by no more than 0.011 (or 1.1%).E)The margin of error is 0.018.This estimate
or 7.5% differs from the actual population proportion (real proportion of employees who are late for work) by no more than 0.009 (or 0.9%). فتح الحزمة
افتح القفل للوصول البطاقات البالغ عددها 36 في هذه المجموعة.
فتح الحزمة
k this deck
35
The city administration wants to find out how many college students visit the city library regularly. The survey has been conducted among the students of this city. There were 356 students who responded to the survey question, and 102 of them responded that they visited the city library regular. Estimate the proportion of the college students in the city who visit the library regularly and calculate the margin of error with the confidence level of 95%.
A)The proportion of college students in the city who visit the library regularly is 0.28, the margin of error is 0.047.
B)The proportion of college students in the city who visit the library regularly is 0.29, the margin of error is 0.039.
C)The proportion of college students in the city who visit the library regularly is 0.28, the margin of error is 0.039.
D)The proportion of college students in the city who visit the library regularly is 0.29, the margin of error is 0.047.
E)The proportion of college students in the city who visit the library regularly is 0.29, the margin of error is 0.024.
فتح الحزمة
افتح القفل للوصول البطاقات البالغ عددها 36 في هذه المجموعة.
فتح الحزمة
k this deck
36
A dietitian wants to know the average number of vegetarians in his State. He would like to obtain the data with the margin of error no more than 0.01 for the confidence level of 95%. According to his previous studies, he knows that the population proportion of vegetarians is approximately 3.2%. Four hundred people took part in the previously studied. Should the dietitian invite the same number of people for the new study to obtain the margin of error no more than 0.01?
A)The dietitian can invite 400 people for this study.
B)The dietitian needs to take more than 400 people for this study.
C)The dietitian can take less than 400 people, but more than 310 people.
D)We need more information to answer the question.
A)The dietitian can invite 400 people for this study.
B)The dietitian needs to take more than 400 people for this study.
C)The dietitian can take less than 400 people, but more than 310 people.
D)We need more information to answer the question.
فتح الحزمة
افتح القفل للوصول البطاقات البالغ عددها 36 في هذه المجموعة.
فتح الحزمة
k this deck
فتح الحزمة
افتح القفل للوصول البطاقات البالغ عددها 36 في هذه المجموعة.


