Deck 1: Introduction to Labour Market Economics
ملء الشاشة (f)
سؤال
سؤال
سؤال
سؤال
سؤال
سؤال
سؤال
سؤال
سؤال
سؤال
سؤال
سؤال
سؤال
سؤال
سؤال
سؤال
سؤال
سؤال
سؤال
سؤال
سؤال
سؤال
سؤال
سؤال
سؤال
سؤال
Use the chart below to answer the following two questions: 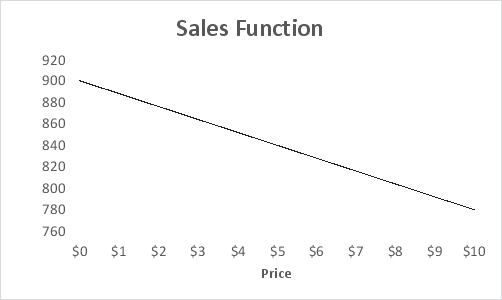
What is the slope of the sales function D = a - bP?
A) 4
B) 9
C) 12
D) 17
What is the slope of the sales function D = a - bP?
A) 4
B) 9
C) 12
D) 17
سؤال
سؤال
سؤال
سؤال
سؤال
سؤال
سؤال
سؤال
سؤال
سؤال
سؤال
سؤال
سؤال
سؤال
سؤال
سؤال
سؤال
سؤال
Use the chart below to answer the following two questions:
Which of the following is a difference between relative addressing and absolute addressing when using cell formulas in Excel?
A) A relative address uses a dollar sign before either the row or column label; an absolute address uses the ampersand symbol before either the row or column label.
B) A relative address uses a dollar sign before either the row or column label; an absolute address uses just the row and column label in the cell reference.
C) A relative address uses just the row and column label in the cell reference; an absolute address uses a dollar sign before either the row or column label.
D) A relative address uses only the column label in the cell reference; an absolute address uses the row.
سؤال
سؤال
سؤال
سؤال
سؤال
Use the chart below to answer the following two questions:
Which of the following ways would 102 × 53 / 100 - 73 be represented in an Excel spreadsheet?
A) 102) * 53) / 100 ^ 73
B) 102) ^ 53) / 100 - 73
C) 10^2 * 5^3 / 100 - 73
D) 10*2 ^ 5*3 / 100 - 73
Which of the following ways would 102 × 53 / 100 - 73 be represented in an Excel spreadsheet?
A) 102) * 53) / 100 ^ 73
B) 102) ^ 53) / 100 - 73
C) 10^2 * 5^3 / 100 - 73
D) 10*2 ^ 5*3 / 100 - 73
سؤال
سؤال
سؤال
Use the chart below to answer the following two questions:
How many gallons will be sold if the price is increased to $4.75?
A) 833.26
B) 843
C) 798.72
D) 818
How many gallons will be sold if the price is increased to $4.75?
A) 833.26
B) 843
C) 798.72
D) 818
سؤال
سؤال
سؤال
سؤال
سؤال
Use the chart below to answer the following two questions:
What does business analytics use to help managers make better decisions?
A) data and information technology.
B) statistical analysis and quantitative methods.
C) mathematical or computer-based models.
D) all of the above.
What does business analytics use to help managers make better decisions?
A) data and information technology.
B) statistical analysis and quantitative methods.
C) mathematical or computer-based models.
D) all of the above.
سؤال
Use the chart below to answer the following two questions:
Which of the following symbols is used to represent exponents in Excel?
A) ^
B) *
C) #
D) !
Which of the following symbols is used to represent exponents in Excel?
A) ^
B) *
C) #
D) !
سؤال
سؤال
سؤال
سؤال

فتح الحزمة
قم بالتسجيل لفتح البطاقات في هذه المجموعة!
Unlock Deck
Unlock Deck
1/62
العب
ملء الشاشة (f)
Deck 1: Introduction to Labour Market Economics
1
A trader who wants to predict short-term movements in stock prices is likely to use analytics.
A) predictive
B) descriptive
C) normative
D) prescriptive
A) predictive
B) descriptive
C) normative
D) prescriptive
predictive
2
Which of the following inputs of a decision model is an example of data?
A) estimated consumer demand
B) inflation rates
C) costs
D) investment allocations
A) estimated consumer demand
B) inflation rates
C) costs
D) investment allocations
costs
3
Descriptive analytics:
A) can predict risk and find relationships in data not readily apparent with traditional analyses.
B) helps companies classify their customers into segments to develop specific marketing campaigns.
C) helps detect hidden patterns in large quantities of data to group data into sets to predict behavior.
D) can use mathematical techniques with optimization to make decisions that take into account the uncertainty in the data.
helps companies classify their customers into segments to develop specific marketing campaigns.
4
Identify the uncontrollable variable from the following inputs of a decision model.
A) investment returns
B) machine capacities
C) staffing levels
D) intercity distances
A) investment returns
B) machine capacities
C) staffing levels
D) intercity distances
فتح الحزمة
افتح القفل للوصول البطاقات البالغ عددها 62 في هذه المجموعة.
فتح الحزمة
k this deck
5
Decision variables:
A) cannot be directly controlled by the decision maker.
B) are assumed to be constant.
C) are always uncertain.
D) can be selected at the discretion of the decision maker.
A) cannot be directly controlled by the decision maker.
B) are assumed to be constant.
C) are always uncertain.
D) can be selected at the discretion of the decision maker.
فتح الحزمة
افتح القفل للوصول البطاقات البالغ عددها 62 في هذه المجموعة.
فتح الحزمة
k this deck
6
Prescriptive decision models help:
A) make predictions of how demand is influenced by price.
B) make trade-offs between greater rewards and risks of potential losses.
C) decision makers identify the best solution to decision problems.
D) describe relationships and influence of various elements in the model.
A) make predictions of how demand is influenced by price.
B) make trade-offs between greater rewards and risks of potential losses.
C) decision makers identify the best solution to decision problems.
D) describe relationships and influence of various elements in the model.
فتح الحزمة
افتح القفل للوصول البطاقات البالغ عددها 62 في هذه المجموعة.
فتح الحزمة
k this deck
7
Predictive analytics:
A) summarizes data into meaningful charts and reports that can be standardized or customized.
B) identifies the best alternatives to minimize or maximize an objective.
C) uses data to determine a course of action to be executed in a given situation.
D) detects patterns in historical data and extrapolates them forward in time.
فتح الحزمة
افتح القفل للوصول البطاقات البالغ عددها 62 في هذه المجموعة.
فتح الحزمة
k this deck
8
During which phase in problem solving is a formal model often developed?
A) analyzing the problem
B) structuring the problem
C) defining the problem
D) implementing the solution
A) analyzing the problem
B) structuring the problem
C) defining the problem
D) implementing the solution
فتح الحزمة
افتح القفل للوصول البطاقات البالغ عددها 62 في هذه المجموعة.
فتح الحزمة
k this deck
9
A manager at Gampco Inc. wishes to know the company's revenue and profit in its previous quarter. Which of the following business analytics will help the manager?
A) prescriptive analytics
B) normative analytics
C) descriptive analytics
D) predictive analytics
A) prescriptive analytics
B) normative analytics
C) descriptive analytics
D) predictive analytics
فتح الحزمة
افتح القفل للوصول البطاقات البالغ عددها 62 في هذه المجموعة.
فتح الحزمة
k this deck
10
Which of the following questions will prescriptive analytics help a company address?
A) How many and what types of complaints did they resolve?
B) What is the best way of shipping goods from their factories to minimize costs?
C) What do they expect to pay for fuel over the next several months?
D) What will happen if demand falls by 10% or if supplier prices go up 5%?
A) How many and what types of complaints did they resolve?
B) What is the best way of shipping goods from their factories to minimize costs?
C) What do they expect to pay for fuel over the next several months?
D) What will happen if demand falls by 10% or if supplier prices go up 5%?
فتح الحزمة
افتح القفل للوصول البطاقات البالغ عددها 62 في هذه المجموعة.
فتح الحزمة
k this deck
11
Which of the following is the first phase in problem solving?
A) defining the problem
B) analyzing the problem
C) recognizing the problem
D) structuring the problem
A) defining the problem
B) analyzing the problem
C) recognizing the problem
D) structuring the problem
فتح الحزمة
افتح القفل للوصول البطاقات البالغ عددها 62 في هذه المجموعة.
فتح الحزمة
k this deck
12
Which decision model incorporates the process of optimization?
A) predictive
B) prescriptive
C) descriptive
D) normative
A) predictive
B) prescriptive
C) descriptive
D) normative
فتح الحزمة
افتح القفل للوصول البطاقات البالغ عددها 62 في هذه المجموعة.
فتح الحزمة
k this deck
13
The demand for coffee beans over a period of three months has been represented in the form of an L-shaped curve. Which form of model was used here?
A) mathematical model
B) visual model
C) kinesthetic tactile) model
D) verbal model
A) mathematical model
B) visual model
C) kinesthetic tactile) model
D) verbal model
فتح الحزمة
افتح القفل للوصول البطاقات البالغ عددها 62 في هذه المجموعة.
فتح الحزمة
k this deck
14
The manager at Goody Woods Inc., a manufacturer of wooden utensil sets, has observed that when the company sells its sets at $240, 1,540 units are sold, and when the price is raised to
$320, demand falls to 1,220 units. Use this information to answer the following two questions.
Develop a prescriptive model that will help Goody Woods identify the price that maximizes the total revenue.
$320, demand falls to 1,220 units. Use this information to answer the following two questions.
Develop a prescriptive model that will help Goody Woods identify the price that maximizes the total revenue.
فتح الحزمة
افتح القفل للوصول البطاقات البالغ عددها 62 في هذه المجموعة.
فتح الحزمة
k this deck
15
Descriptive decision models:
A) aim to predict what will happen in the future.
B) describe relationships but do not tell a manager what to do.
C) help analyze the risks associated with various decisions.
D) do not facilitate evaluation of different decisions.
A) aim to predict what will happen in the future.
B) describe relationships but do not tell a manager what to do.
C) help analyze the risks associated with various decisions.
D) do not facilitate evaluation of different decisions.
فتح الحزمة
افتح القفل للوصول البطاقات البالغ عددها 62 في هذه المجموعة.
فتح الحزمة
k this deck
16
The manager at Goody Woods Inc., a manufacturer of wooden utensil sets, has observed that when the company sells its sets at $240, 1,540 units are sold, and when the price is raised to
$320, demand falls to 1,220 units. Use this information to answer the following two questions.
Develop a linear model relating the demand for Goody Woods' units to the price.
$320, demand falls to 1,220 units. Use this information to answer the following two questions.
Develop a linear model relating the demand for Goody Woods' units to the price.
فتح الحزمة
افتح القفل للوصول البطاقات البالغ عددها 62 في هذه المجموعة.
فتح الحزمة
k this deck
17
Middle managers in operations:
A) develop staffing plans.
B) determine product mix.
C) develop advertising plans.
D) make pricing decisions.
A) develop staffing plans.
B) determine product mix.
C) develop advertising plans.
D) make pricing decisions.
فتح الحزمة
افتح القفل للوصول البطاقات البالغ عددها 62 في هذه المجموعة.
فتح الحزمة
k this deck
18
The product mix is determined by the:
A) accounting staff.
B) middle managers.
C) finance managers.
D) top managers.
A) accounting staff.
B) middle managers.
C) finance managers.
D) top managers.
فتح الحزمة
افتح القفل للوصول البطاقات البالغ عددها 62 في هذه المجموعة.
فتح الحزمة
k this deck
19
Which of the following is true about problem solving?
A) Recognizing problems involves stating goals and objectives.
B) Analyzing the problem involves characterizing the possible decisions.
C) Decision making involves translating the results of the model in the organization.
D) Structuring the problem involves identifying constraints.
A) Recognizing problems involves stating goals and objectives.
B) Analyzing the problem involves characterizing the possible decisions.
C) Decision making involves translating the results of the model in the organization.
D) Structuring the problem involves identifying constraints.
فتح الحزمة
افتح القفل للوصول البطاقات البالغ عددها 62 في هذه المجموعة.
فتح الحزمة
k this deck
20
Decision support systems evolved from efforts to improve military operations prior to and during World War II.
فتح الحزمة
افتح القفل للوصول البطاقات البالغ عددها 62 في هذه المجموعة.
فتح الحزمة
k this deck
21
Use the table below to answer the following questions).
Fiberia Accessories, a clothing retailer, is planning to introduce a new line of sweaters as part of the winter collection for $65 with an inventory of 1500. The main selling season is 60 days between November and December. The store then sells the remaining units in a clearance sale at 65 percent discount. Out of the 60 main retail days, Fiberia sells the sweaters at full retail price for only 45 days, while giving a discount of 25 percent for the remaining 15 days. The demand functions a, and b are given as 79.5 and 1.1 respectively.
-Calculate the total revenue during the full retail sales period.
A) $23,400
B) $16,200
C) $2,880
D) $17,550
فتح الحزمة
افتح القفل للوصول البطاقات البالغ عددها 62 في هذه المجموعة.
فتح الحزمة
k this deck
22
Data used in business analytics need to be reliable and valid. Explain.
فتح الحزمة
افتح القفل للوصول البطاقات البالغ عددها 62 في هذه المجموعة.
فتح الحزمة
k this deck
23
Use the table below to answer the following questions).
In the spreadsheet below, there is data on the price, cost, demand, and quantity produced for an item. There are also different "what if" values that can help a manager to calculate costs and revenue with variability in demand.
-If D is demand, P is the unit price, and c and d are constants where d > 0 is the price elasticity), which of the following is a nonlinear demand prediction model?
A) D = d + c × P)
B) D = d × P)c
C) D = cd × P
D) D = cP-d
فتح الحزمة
افتح القفل للوصول البطاقات البالغ عددها 62 في هذه المجموعة.
فتح الحزمة
k this deck
24
Use the table below to answer the following questions).
Fiberia Accessories, a clothing retailer, is planning to introduce a new line of sweaters as part of the winter collection for $65 with an inventory of 1500. The main selling season is 60 days between November and December. The store then sells the remaining units in a clearance sale at 65 percent discount. Out of the 60 main retail days, Fiberia sells the sweaters at full retail price for only 45 days, while giving a discount of 25 percent for the remaining 15 days. The demand functions a, and b are given as 79.5 and 1.1 respectively.
-What is the average daily sale during the full retail sales period?
A) 15
B) 33.33
C) 8
D) 24.55
فتح الحزمة
افتح القفل للوصول البطاقات البالغ عددها 62 في هذه المجموعة.
فتح الحزمة
k this deck
25
Prescriptive analytics:
A) summarizes data into meaningful charts and reports that can be standardized or customized.
B) identifies patterns and relationships existing in large data sets.
C) uses data to determine a course of action to be executed in a given situation.
D) detects patterns in historical data and extrapolates them forward in time.
فتح الحزمة
افتح القفل للوصول البطاقات البالغ عددها 62 في هذه المجموعة.
فتح الحزمة
k this deck
26
Use the chart below to answer the following two questions:
What is the slope of the sales function D = a - bP?
A) 4
B) 9
C) 12
D) 17
What is the slope of the sales function D = a - bP?
A) 4
B) 9
C) 12
D) 17
فتح الحزمة
افتح القفل للوصول البطاقات البالغ عددها 62 في هذه المجموعة.
فتح الحزمة
k this deck
27
The complexity of a problem increases when the problem belongs to an individual rather than a group.
فتح الحزمة
افتح القفل للوصول البطاقات البالغ عددها 62 في هذه المجموعة.
فتح الحزمة
k this deck
28
Use the table below to answer the following questions).
Fiberia Accessories, a clothing retailer, is planning to introduce a new line of sweaters as part of the winter collection for $65 with an inventory of 1500. The main selling season is 60 days between November and December. The store then sells the remaining units in a clearance sale at 65 percent discount. Out of the 60 main retail days, Fiberia sells the sweaters at full retail price for only 45 days, while giving a discount of 25 percent for the remaining 15 days. The demand functions a, and b are given as 79.5 and 1.1 respectively.
-Calculate the total units sold during the discount sales period.
A) 388.13
B) 25.88
C) 133.3
D) 39.28
فتح الحزمة
افتح القفل للوصول البطاقات البالغ عددها 62 في هذه المجموعة.
فتح الحزمة
k this deck
29
Which of the following is not a challenge faced by organizations that want to develop analytics capabilities?
A) a lack of understanding of how to use analytics.
B) competing business priorities.
C) understanding benefits versus perceived costs of analytics studies.
D) difficulty in getting good data and sharing information.
A) a lack of understanding of how to use analytics.
B) competing business priorities.
C) understanding benefits versus perceived costs of analytics studies.
D) difficulty in getting good data and sharing information.
فتح الحزمة
افتح القفل للوصول البطاقات البالغ عددها 62 في هذه المجموعة.
فتح الحزمة
k this deck
30
Use the table below to answer the following questions).
Fiberia Accessories, a clothing retailer, is planning to introduce a new line of sweaters as part of the winter collection for $65 with an inventory of 1500. The main selling season is 60 days between November and December. The store then sells the remaining units in a clearance sale at 65 percent discount. Out of the 60 main retail days, Fiberia sells the sweaters at full retail price for only 45 days, while giving a discount of 25 percent for the remaining 15 days. The demand functions a, and b are given as 79.5 and 1.1 respectively.
-Calculate the total revenue during the discount sales period.
A) $4,478.91
B) $18,921.09
C) $10,042.73
D) $43,321.09
فتح الحزمة
افتح القفل للوصول البطاقات البالغ عددها 62 في هذه المجموعة.
فتح الحزمة
k this deck
31
Why do predictive decision models incorporate uncertainty?
فتح الحزمة
افتح القفل للوصول البطاقات البالغ عددها 62 في هذه المجموعة.
فتح الحزمة
k this deck
32
A deterministic model is one in which all model input information is either known or assumed to be known with certainty.
فتح الحزمة
افتح القفل للوصول البطاقات البالغ عددها 62 في هذه المجموعة.
فتح الحزمة
k this deck
33
Use the table below to answer the following questions).
Fiberia Accessories, a clothing retailer, is planning to introduce a new line of sweaters as part of the winter collection for $65 with an inventory of 1500. The main selling season is 60 days between November and December. The store then sells the remaining units in a clearance sale at 65 percent discount. Out of the 60 main retail days, Fiberia sells the sweaters at full retail price for only 45 days, while giving a discount of 25 percent for the remaining 15 days. The demand functions a, and b are given as 79.5 and 1.1 respectively.
-Calculate the daily sales during the discount sales period.
A) 39.28
B) 133.3
C) 388.13
D) 25.88
فتح الحزمة
افتح القفل للوصول البطاقات البالغ عددها 62 في هذه المجموعة.
فتح الحزمة
k this deck
34
Explain how data are used by accountants, economists, and operations managers.
فتح الحزمة
افتح القفل للوصول البطاقات البالغ عددها 62 في هذه المجموعة.
فتح الحزمة
k this deck
35
Use the table below to answer the following questions).
In the spreadsheet below, there is data on the price, cost, demand, and quantity produced for an item. There are also different "what if" values that can help a manager to calculate costs and revenue with variability in demand.
-Which of the following is the Excel formula to determine the number of units sold?
A) =B8
B) =MIN0,B8,B9)
C) =MINB8,B9)
D) =MAX0,B8,B9)
فتح الحزمة
افتح القفل للوصول البطاقات البالغ عددها 62 في هذه المجموعة.
فتح الحزمة
k this deck
36
What are the three components of decision support systems DSS)?
فتح الحزمة
افتح القفل للوصول البطاقات البالغ عددها 62 في هذه المجموعة.
فتح الحزمة
k this deck
37
Use the table below to answer the following questions).
Fiberia Accessories, a clothing retailer, is planning to introduce a new line of sweaters as part of the winter collection for $65 with an inventory of 1500. The main selling season is 60 days between November and December. The store then sells the remaining units in a clearance sale at 65 percent discount. Out of the 60 main retail days, Fiberia sells the sweaters at full retail price for only 45 days, while giving a discount of 25 percent for the remaining 15 days. The demand functions a, and b are given as 79.5 and 1.1 respectively.
-Calculate the total number of units sold during the full retail sales period.
A) 33.33
B) 520
C) 187.5
D) 360
فتح الحزمة
افتح القفل للوصول البطاقات البالغ عددها 62 في هذه المجموعة.
فتح الحزمة
k this deck
38
Use the table below to answer the following questions).
Fiberia Accessories, a clothing retailer, is planning to introduce a new line of sweaters as part of the winter collection for $65 with an inventory of 1500. The main selling season is 60 days between November and December. The store then sells the remaining units in a clearance sale at 65 percent discount. Out of the 60 main retail days, Fiberia sells the sweaters at full retail price for only 45 days, while giving a discount of 25 percent for the remaining 15 days. The demand functions a, and b are given as 79.5 and 1.1 respectively.
-Calculate the revenue for the clearance sales period.
A) $18,921.09
B) $23,400
C) $48,871.88
D) $17,105.16
فتح الحزمة
افتح القفل للوصول البطاقات البالغ عددها 62 في هذه المجموعة.
فتح الحزمة
k this deck
39
Use the table below to answer the following questions).
Fiberia Accessories, a clothing retailer, is planning to introduce a new line of sweaters as part of the winter collection for $65 with an inventory of 1500. The main selling season is 60 days between November and December. The store then sells the remaining units in a clearance sale at 65 percent discount. Out of the 60 main retail days, Fiberia sells the sweaters at full retail price for only 45 days, while giving a discount of 25 percent for the remaining 15 days. The demand functions a, and b are given as 79.5 and 1.1 respectively.
-Calculate the total revenue for the new line of sweaters.
A) $59,426.25
B) $48,871.88
C) $23,400
D) $43,231.09
فتح الحزمة
افتح القفل للوصول البطاقات البالغ عددها 62 في هذه المجموعة.
فتح الحزمة
k this deck
40
A goal of Korel & Marke, a dot-com company, is to gain strategic advantage over its rival firms. How can Korel & Marke use analytics and exploit social media to accomplish this goal?
فتح الحزمة
افتح القفل للوصول البطاقات البالغ عددها 62 في هذه المجموعة.
فتح الحزمة
k this deck
41
Use the data given below to answer the following questions)
Below is the spreadsheet for demand prediction of a company that sells chocolates.
-If a dollar sign is used before the column label B4 $B4), how will the formula at B10 be represented in C11 using absolute addressing?
A) $B5-C6*B11
B) $C5-C6*A10
C) $B4-C5*B11
D) $A5-C6*B11
Below is the spreadsheet for demand prediction of a company that sells chocolates.
-If a dollar sign is used before the column label B4 $B4), how will the formula at B10 be represented in C11 using absolute addressing?
A) $B5-C6*B11
B) $C5-C6*A10
C) $B4-C5*B11
D) $A5-C6*B11
فتح الحزمة
افتح القفل للوصول البطاقات البالغ عددها 62 في هذه المجموعة.
فتح الحزمة
k this deck
42
Use the data given below to answer the following questions)
Below is the spreadsheet for demand prediction of a company that sells chocolates.
-Trace the process of copying and pasting a cell, which has a formula in it, such that the formula is not retained in the pasted cell.
A) Home - Paste - Paste Special - Paste Values
B) Home - Paste - Paste Special - Paste Validation
C) Home - Paste - Paste Special - Paste Formats
D) Home - Paste - Paste Special - Paste Formulas
فتح الحزمة
افتح القفل للوصول البطاقات البالغ عددها 62 في هذه المجموعة.
فتح الحزمة
k this deck
43
Use the data given below to answer the following questions)
Below is the spreadsheet for demand prediction of a company that sells chocolates.
-Using a $ sign before a column label .
A) keeps the reference to both the row and column fixed
B) keeps the reference to the row fixed, but allows the column reference to change
C) keeps the reference to column fixed, but allows the row reference to change
D) allows both the row and column references to change
فتح الحزمة
افتح القفل للوصول البطاقات البالغ عددها 62 في هذه المجموعة.
فتح الحزمة
k this deck
44
Use the chart below to answer the following two questions:
Which of the following is a difference between relative addressing and absolute addressing when using cell formulas in Excel?
A) A relative address uses a dollar sign before either the row or column label; an absolute address uses the ampersand symbol before either the row or column label.
B) A relative address uses a dollar sign before either the row or column label; an absolute address uses just the row and column label in the cell reference.
C) A relative address uses just the row and column label in the cell reference; an absolute address uses a dollar sign before either the row or column label.
D) A relative address uses only the column label in the cell reference; an absolute address uses the row.
فتح الحزمة
افتح القفل للوصول البطاقات البالغ عددها 62 في هذه المجموعة.
فتح الحزمة
k this deck
45
Use the data given below to answer the following questions)
Below is the spreadsheet for demand prediction of a company that sells chocolates.
-If, in the spreadsheet, cells B9 and B10 were empty, which of the following formulas should be entered in B8 so that the formula can be dragged to B9 and B10 to obtain their correct values?
A) B4-B5*A8
B) B4-B5*$A8
C) $B4-B5*$A8
D) $B$4-$B$5*$A8
فتح الحزمة
افتح القفل للوصول البطاقات البالغ عددها 62 في هذه المجموعة.
فتح الحزمة
k this deck
46
Use the data given below to answer the following questions).
Below is a spreadsheet of purchase orders for a computer hardware retailer.
-To find the total order cost, what Excel formula should be used in A12?
A) =COUNTC4:C10)
B) =COUNTC4:C7)
C) =MAXC4:C10)
D) =SUME4:E10)
Below is a spreadsheet of purchase orders for a computer hardware retailer.
-To find the total order cost, what Excel formula should be used in A12?
A) =COUNTC4:C10)
B) =COUNTC4:C7)
C) =MAXC4:C10)
D) =SUME4:E10)
فتح الحزمة
افتح القفل للوصول البطاقات البالغ عددها 62 في هذه المجموعة.
فتح الحزمة
k this deck
47
measures the worth of a stream of cash flows, taking into account the time value of money.
A) Accounting rate of return
B) Net present value
C) Internal rate of return
D) Adjusted present value
A) Accounting rate of return
B) Net present value
C) Internal rate of return
D) Adjusted present value
فتح الحزمة
افتح القفل للوصول البطاقات البالغ عددها 62 في هذه المجموعة.
فتح الحزمة
k this deck
48
The Excel function of is used to find the largest value in a range of cells.
A) SUMrange)
B) COUNTrange)
C) MAXrange)
D) COUNTIFrange, criteria)
A) SUMrange)
B) COUNTrange)
C) MAXrange)
D) COUNTIFrange, criteria)
فتح الحزمة
افتح القفل للوصول البطاقات البالغ عددها 62 في هذه المجموعة.
فتح الحزمة
k this deck
49
Use the chart below to answer the following two questions:
Which of the following ways would 102 × 53 / 100 - 73 be represented in an Excel spreadsheet?
A) 102) * 53) / 100 ^ 73
B) 102) ^ 53) / 100 - 73
C) 10^2 * 5^3 / 100 - 73
D) 10*2 ^ 5*3 / 100 - 73
Which of the following ways would 102 × 53 / 100 - 73 be represented in an Excel spreadsheet?
A) 102) * 53) / 100 ^ 73
B) 102) ^ 53) / 100 - 73
C) 10^2 * 5^3 / 100 - 73
D) 10*2 ^ 5*3 / 100 - 73
فتح الحزمة
افتح القفل للوصول البطاقات البالغ عددها 62 في هذه المجموعة.
فتح الحزمة
k this deck
50
What is the Insert function in Excel?
فتح الحزمة
افتح القفل للوصول البطاقات البالغ عددها 62 في هذه المجموعة.
فتح الحزمة
k this deck
51
Use the data given below to answer the following questions).
Below is a spreadsheet of purchase orders for a computer hardware retailer.
-The easiest way to locate a particular function is to select a cell and click on the Insert function button represented by on the Excel ribbon.
A) fx
B) ?
C) $
D) %
Below is a spreadsheet of purchase orders for a computer hardware retailer.
-The easiest way to locate a particular function is to select a cell and click on the Insert function button represented by on the Excel ribbon.
A) fx
B) ?
C) $
D) %
فتح الحزمة
افتح القفل للوصول البطاقات البالغ عددها 62 في هذه المجموعة.
فتح الحزمة
k this deck
52
Use the chart below to answer the following two questions:
How many gallons will be sold if the price is increased to $4.75?
A) 833.26
B) 843
C) 798.72
D) 818
How many gallons will be sold if the price is increased to $4.75?
A) 833.26
B) 843
C) 798.72
D) 818
فتح الحزمة
افتح القفل للوصول البطاقات البالغ عددها 62 في هذه المجموعة.
فتح الحزمة
k this deck
53
Use the data given below to answer the following questions)
Below is the spreadsheet for demand prediction of a company that sells chocolates.
-If a dollar sign is used after the column in B5 B$5), how will the formula at B8 be represented in C9 using absolute addressing?
A) C3-B$5*C9
B) C5-C$6*B9
C) C5-C$6*C9
D) C5-C$5*B9
Below is the spreadsheet for demand prediction of a company that sells chocolates.
-If a dollar sign is used after the column in B5 B$5), how will the formula at B8 be represented in C9 using absolute addressing?
A) C3-B$5*C9
B) C5-C$6*B9
C) C5-C$6*C9
D) C5-C$5*B9
فتح الحزمة
افتح القفل للوصول البطاقات البالغ عددها 62 في هذه المجموعة.
فتح الحزمة
k this deck
54
Use the data given below to answer the following questions).
Below is a spreadsheet of purchase orders for a computer hardware retailer.
-To find the average of the total cost of orders from Rex Technologies, what Excel formula should be used in A12?
A) =AVERAGEC4:C10)
B) =AVERAGEC4:C7)
C) =AVERAGEE4:E7)
D) =AVERAGEE4:E10)
Below is a spreadsheet of purchase orders for a computer hardware retailer.
-To find the average of the total cost of orders from Rex Technologies, what Excel formula should be used in A12?
A) =AVERAGEC4:C10)
B) =AVERAGEC4:C7)
C) =AVERAGEE4:E7)
D) =AVERAGEE4:E10)
فتح الحزمة
افتح القفل للوصول البطاقات البالغ عددها 62 في هذه المجموعة.
فتح الحزمة
k this deck
55
Use the data given below to answer the following questions)
Below is the spreadsheet for demand prediction of a company that sells chocolates.
-To copy a formula from a single cell or range of cells down a column or across a row, first , click and hold the mouse on the small square in the lower right-hand corner of the cell, and drag the formula to the "target" cells which you wish to copy.
A) press Ctrl-C
B) select the cell or range
C) press Ctrl-Enter
D) select the whole spreadsheet
فتح الحزمة
افتح القفل للوصول البطاقات البالغ عددها 62 في هذه المجموعة.
فتح الحزمة
k this deck
56
Use the data given below to answer the following questions).
Below is a spreadsheet of purchase orders for a computer hardware retailer.
-For which of the following columns can the COUNT function be performed?
A) column G
B) column E
C) column B
D) column A
Below is a spreadsheet of purchase orders for a computer hardware retailer.
-For which of the following columns can the COUNT function be performed?
A) column G
B) column E
C) column B
D) column A
فتح الحزمة
افتح القفل للوصول البطاقات البالغ عددها 62 في هذه المجموعة.
فتح الحزمة
k this deck
57
Use the chart below to answer the following two questions:
What does business analytics use to help managers make better decisions?
A) data and information technology.
B) statistical analysis and quantitative methods.
C) mathematical or computer-based models.
D) all of the above.
What does business analytics use to help managers make better decisions?
A) data and information technology.
B) statistical analysis and quantitative methods.
C) mathematical or computer-based models.
D) all of the above.
فتح الحزمة
افتح القفل للوصول البطاقات البالغ عددها 62 في هذه المجموعة.
فتح الحزمة
k this deck
58
Use the chart below to answer the following two questions:
Which of the following symbols is used to represent exponents in Excel?
A) ^
B) *
C) #
D) !
Which of the following symbols is used to represent exponents in Excel?
A) ^
B) *
C) #
D) !
فتح الحزمة
افتح القفل للوصول البطاقات البالغ عددها 62 في هذه المجموعة.
فتح الحزمة
k this deck
59
Use the data given below to answer the following questions)
Below is the spreadsheet for demand prediction of a company that sells chocolates.
-Given that D = a-bP, where D, is demand, "a" and "b," are linear constants, and P, is price, from the below spreadsheet, how will the formula in B9 be represented in Excel using relative addressing?
A) B4-B5*A9
B) C5-C6*A10
C) B4-B5*A10
D) B5-B6*A10
فتح الحزمة
افتح القفل للوصول البطاقات البالغ عددها 62 في هذه المجموعة.
فتح الحزمة
k this deck
60
The reflects the opportunity costs of spending funds now versus achieving a return through another investment, as well as the risks associated with not receiving returns until a later time.
A) modified internal rate of return
B) payback period
C) accounting rate of return
D) discount rate
A) modified internal rate of return
B) payback period
C) accounting rate of return
D) discount rate
فتح الحزمة
افتح القفل للوصول البطاقات البالغ عددها 62 في هذه المجموعة.
فتح الحزمة
k this deck
61
A positive NPV means that the investment will provide added value because the projected return exceeds the .
A) modified internal rate of return
B) discount rate
C) accounting rate of return
D) adjusted present value
A) modified internal rate of return
B) discount rate
C) accounting rate of return
D) adjusted present value
فتح الحزمة
افتح القفل للوصول البطاقات البالغ عددها 62 في هذه المجموعة.
فتح الحزمة
k this deck
62
Describe the method of calculating the net present value NPV) in Excel.
فتح الحزمة
افتح القفل للوصول البطاقات البالغ عددها 62 في هذه المجموعة.
فتح الحزمة
k this deck
فتح الحزمة
افتح القفل للوصول البطاقات البالغ عددها 62 في هذه المجموعة.


