Deck 26: Statistics and Data Analysis
ملء الشاشة (f)
سؤال
سؤال
As a preliminary step in its product testing, a fast food chain has two small groups (4 teenagers, 6 older adults) sample the item and "grade" it on "taste." According to the data below, what is the value of an appropriate nonparametric test statistic to determine if the two groups differ in opinion?
GLOBAL : Please place the table above the answers

A)9
B)10
C)11
D)12
E)13
GLOBAL : Please place the table above the answers
A)9
B)10
C)11
D)12
E)13
سؤال
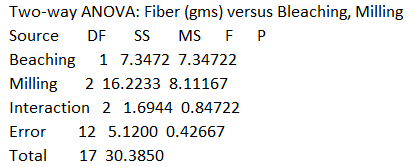
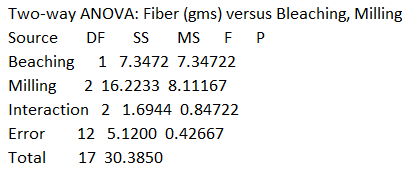
A company that processes wheat varies the milling time (short, medium and long) and bleaching (no bleaching and bleaching) and measure fiber content (gms/100 grams) of the resulting wheat product to determine the best combination for a desirable wheat product.According to ANOVA results below, the F statistic for testing whether bleaching has an effect on fiber content is ________________________ .
A)1.43
B)1.99
C)17.22
D)19.01
E)45.22
A)1.43
B)1.99
C)17.22
D)19.01
E)45.22
سؤال
Estimated profits for an investor would depend on how successful a bailout bill would be in helping the U.S.economy.The estimated annual return for two different investment strategies are shown in the following table.If there is a 30% chance that the economy will decline, 50% that there will be no change and 20% chance that it will rebound, the standard deviation associated with the investment strategy of allocating 80% to stocks and 20% to bonds is ________________________ .

A)$1782
B)$2245
C)$2567
D)$3473
E)$4500
A)$1782
B)$2245
C)$2567
D)$3473
E)$4500
سؤال
سؤال
The effectiveness of three brands of stain remover (EZ-Clean, SpotX, and OXYBoost) were rated (A = excellent to F = poor) by different groups of consumers.The calculated value of the statistic for the appropriate nonparametric test is ________________________ .

A)2.67
B)5.62
C)9.12
D)11.4
E)12.0
A)2.67
B)5.62
C)9.12
D)11.4
E)12.0
سؤال
سؤال
سؤال
سؤال
A manufacturer of solid wood cabinetry requires that its lumber has moisture content (MC) between 5% and 9%.Twenty-five subgroups, each consisting of six pieces of lumber, yield an average MC of 6.95% and an average range of 2.2%.The estimated process standard deviation ( ) is ________________________ .
A)0.18%
B)0.87%
C)1.22%
D)2.2%
E)2.74%
) is ________________________ .A)0.18%
B)0.87%
C)1.22%
D)2.2%
E)2.74%
سؤال
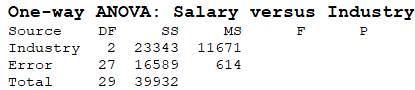
Based on the partial ANOVA results shown below, the F statistic value is ________________________ .
A)F = 19.01
B)F = 1.407
C)F = 48.7
D)F = 0.499
E)None of the above.
A)F = 19.01
B)F = 1.407
C)F = 48.7
D)F = 0.499
E)None of the above.
سؤال
سؤال
سؤال
Estimated profits for an investor would depend on how successful a bailout bill would be in helping the U.S.economy.The estimated annual return for two different investment strategies are shown in the following table.If there is a 30% chance that the economy will decline, 50% that there will be no change and 20% chance that it will rebound, the expected value with perfect information is ________________________ .

A)-$250
B)-$450
C)$590
D)$700
E)$1290
A)-$250
B)-$450
C)$590
D)$700
E)$1290
سؤال
سؤال
سؤال
سؤال
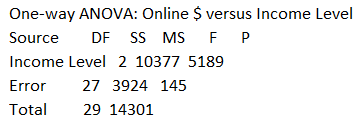
Data were analyzed to see if income level (1 = Low, 2 = Middle, 3 = High) influence the amount consumers spend online for holiday shopping.Based on the ANOVA results shown below, the F statistic value is ________________________ .
A)F = 0.500
B)F = 2.644
C)F = 35.79
D)F = 145
E)None of the above.
A)F = 0.500
B)F = 2.644
C)F = 35.79
D)F = 145
E)None of the above.
سؤال
A company that processes wheat varies the milling time (short, medium and long) and bleaching (no bleaching and bleaching) and measure fiber content (gms/100 grams) of the resulting wheat product to determine the best combination for a desirable wheat product.According to ANOVA results below, the F statistic for testing whether milling has an effect on fiber content is ________________________ .
A)1.43
B)1.99
C)17.22
D)19.01
E)45.22
A)1.43
B)1.99
C)17.22
D)19.01
E)45.22
سؤال
سؤال
Data were collected for a sample of 12 pharmacists to determine if years of experience and salary are related.Based on the results below, the standard error of the slope for this estimated regression equation is ________________________ .
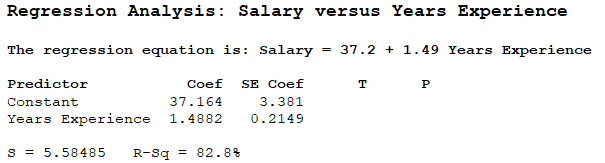
A)3.381
B)0.2149
C)5.58485
D)82.8
E)1.4882
A)3.381
B)0.2149
C)5.58485
D)82.8
E)1.4882
سؤال
سؤال
سؤال
سؤال
Three wines (California, Australian and Italian) were tasted by a different group of judges as part of an annual food and wine festival.The judges graded the wines on overall quality (A = excellent to F = poor).The calculated value of the statistic for the appropriate nonparametric test to determine differences in perceived quality is ________________________ .

A)1.25
B)10.78
C)9.45
D)4.34
E)3.45
A)1.25
B)10.78
C)9.45
D)4.34
E)3.45
سؤال
سؤال
سؤال
The following payoff table (in thousands of dollars) considers three possible levels of demand in a housing complex.If there is a 45% chance that the demand level will be low, 30% that it will be medium and 25% chance that it will be high, what is the expected value of perfect information?

A)$208.75
B)$225
C)$310
D)$326.25
E)$535
A)$208.75
B)$225
C)$310
D)$326.25
E)$535
سؤال
A major customer for a vendor of plastic containers requires that its containers have a volume of 10,000 cubic inches with a tolerance of 50 cubic inches.Forty subgroups of five containers each were selected periodically from the production process.The average of the means across all subgroups was found to be 10,012 cubic inches and the average range was 48 cubic inches.The estimated process standard deviation ( ) is ________________________ .
A)48 cubic inches
B)22.69 cubic inches
C)20.64 cubic inches
D)50 inches
E)32.99 cubic inches
) is ________________________ .A)48 cubic inches
B)22.69 cubic inches
C)20.64 cubic inches
D)50 inches
E)32.99 cubic inches
سؤال
سؤال
سؤال
سؤال
سؤال
Based on the following plot of residuals, what can you say about the conditions for ANOVA?
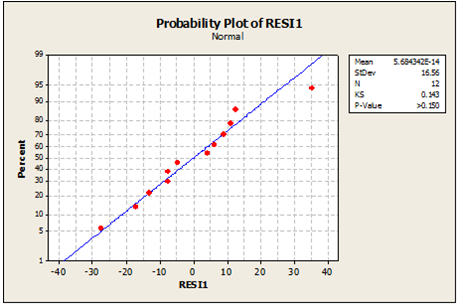
A)The equal variance assumption is satisfied.
B)The linearity assumption is satisfied.
C)The nearly normal assumption is satisfied.
D)The nearly normal assumption is not satisfied.
E)The additive assumption is satisfied.
A)The equal variance assumption is satisfied.
B)The linearity assumption is satisfied.
C)The nearly normal assumption is satisfied.
D)The nearly normal assumption is not satisfied.
E)The additive assumption is satisfied.
سؤال
The following payoff table (in thousands of dollars) considers three possible levels of demand in a housing complex.Using the maximax approach, the action taken should be to ________________________ .

A)build a small complex
B)build a large complex
C)build a large complex with high demand
D)build a small complex with low demand
E)do not build any size complex
A)build a small complex
B)build a large complex
C)build a large complex with high demand
D)build a small complex with low demand
E)do not build any size complex
سؤال
سؤال
سؤال
سؤال
Suppose that six different e-readers were evaluated by two senior citizen groups with respect to their suitability for use among the older segment of the population.The rankings from 1 (best) to 6 (worst) are shown below.Using the appropriate nonparametric method, the value of the calculated test statistic to determine if there is a difference in the rankings between the two magazines is ________________________ .
GLOBAL : Please place the table above and answers below

A)2.5
B)3
C)5.5
D)7.5
E)10
GLOBAL : Please place the table above and answers below
A)2.5
B)3
C)5.5
D)7.5
E)10
سؤال
The following payoff table (in thousands of dollars) considers three possible levels of demand in a housing complex.If there is a 45% chance that the demand level will be low, 30% that it will be medium and 25% chance that it will be high, the expected value (in thousands of dollars) associated with the best action is ________________________ .

A)$208.75
B)$225
C)$310
D)$326.25
E)$535
A)$208.75
B)$225
C)$310
D)$326.25
E)$535
سؤال
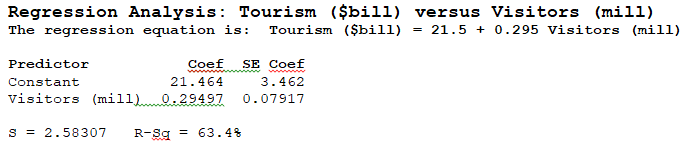
According to the regression analysis output below, how much of the variability in tourism revenue is accounted for by the number of foreign visitors?
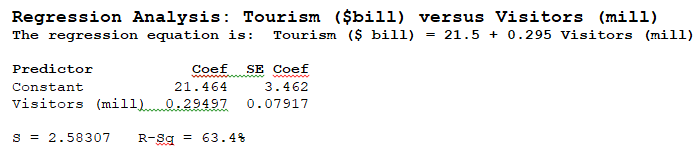
A)63.4 %
B)13.8 %
C)2.58 billion $
D)21.464 %
E)3.73 billion $
A)63.4 %
B)13.8 %
C)2.58 billion $
D)21.464 %
E)3.73 billion $
سؤال
سؤال
Based on the output below from regression analysis performed to develop a model for predicting a firm's Price-Earnings Ratio (PE) based on Growth Rate, Profit Margin, and whether or not the firm is Green (1 = Yes, 0 = No), we can conclude (α = .05) that ________________________ .
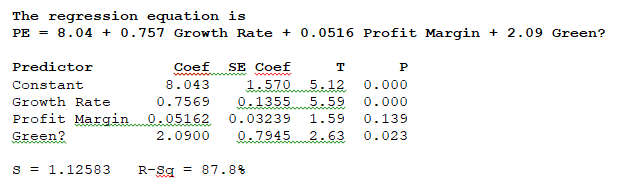
A)Growth Rate is not a significant variable in predicting a firm's PE ratio
B)Profit Margin is a significant variable in predicting a firm's PE ratio
C)the regression coefficient associated with Growth Rate is not significantly different from zero
D)whether or not a firm is Green is significant in predicting its PE ratio
E)the regression coefficient associated with Profit Margin is significantly different from zero
سؤال
سؤال
سؤال
Data were collected for a sample of 12 pharmacists to determine if years of experience and salary are related.Based on the results below, the calculated t-statistic to test whether the regression slope is significant is ________________________ .
A)10.99
B)47.97
C)31.2
D)6.93
E)5.58485
A)10.99
B)47.97
C)31.2
D)6.93
E)5.58485
سؤال
سؤال
A regression model:

Was developed to predict a firm's Price-Earnings Ratio (PE) using Growth Rate, Profit Margin, and whether the firm is Green (1 = Yes, 0 = No).Which of the following is the correct interpretation for the regression coefficient of Green?
A)The regression coefficient indicates that the PE ratio of a firm that is green will, on average, be 2.09 higher than a firm that is not green with the same growth rate and profit margin.
B)The regression coefficient indicates that the PE ratio of a firm that is green will, on average, be 2.09 lower than a firm that is not green with the same growth rate and profit margin.
C)The regression coefficient indicates that the PE ratio of a firm that is green will, on average, be 2.09 times higher than a firm that is not green with the same growth rate and profit margin.
D)The regression coefficient indicates that the PE ratio of a firm that is green will, on average, be 2.09 times lower than a firm that is not green with the same growth rate and profit margin.
E)The regression coefficient is not significantly different from zero.
سؤال
According to the results below, what is the correlation between stock price and EPS?
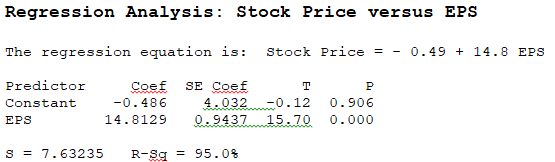
A)-0.975
B)0.906
C)0.950
D)0.975
E)Cannot be determined from the information given.
A)-0.975
B)0.906
C)0.950
D)0.975
E)Cannot be determined from the information given.
سؤال
سؤال
سؤال
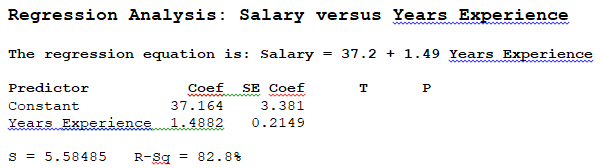
Data were collected for a sample of 12 pharmacists to determine if years of experience and salary are related.Based on the output below, how much of the variability in pharmacists' salary is accounted for by years of experience?
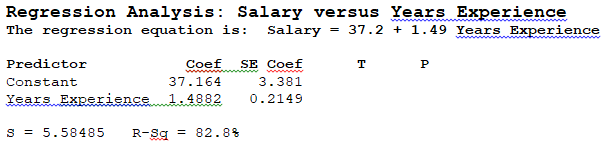
A)82.8 %
B)47.97 %
C)5.58485 thousand dollars
D)10.99 %
E)98.9 %
A)82.8 %
B)47.97 %
C)5.58485 thousand dollars
D)10.99 %
E)98.9 %
سؤال
A first-order autoregressive model, AR (1) was fit to monthly closing stock prices, adjusted for dividends, of Boeing Corporation from January 2006 through August 2008 (closing price on the first trading day of the month).Based on the results shown below, the forecast a month in which the previous month's closing price was $67.52 is ________________________ .
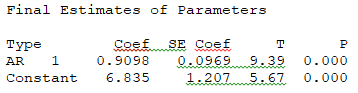
A)$65.67
B)$68.26
C)$71.25
D)$74.06
E)Cannot be determined from the information given.
A)$65.67
B)$68.26
C)$71.25
D)$74.06
E)Cannot be determined from the information given.
سؤال
According to the partial regression analysis output below, what is the t-statistic to test whether the regression slope is significant?
A)6.20
B)13.88
C)0.07917
D)2.58307
E)3.73
A)6.20
B)13.88
C)0.07917
D)2.58307
E)3.73
سؤال
The model
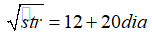
Can be used to predict the breaking strength (pounds) of a rope from its diameter (inches).According to this model, how much force should a rope one-half inch in diameter withstand?
A)484 pounds
B)16 pounds
C)22 pounds
D)256 pounds
E)4.7 pounds
Can be used to predict the breaking strength (pounds) of a rope from its diameter (inches).According to this model, how much force should a rope one-half inch in diameter withstand?
A)484 pounds
B)16 pounds
C)22 pounds
D)256 pounds
E)4.7 pounds
سؤال
According to the output below, which of the following statement is true about the correlation between stock price and earnings per share (EPS)?
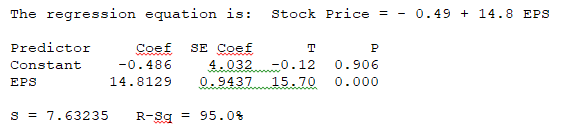
A)The correlation is negative.
B)The correlation is not significantly different from zero.
C)The correlation is positive and significantly different from zero.
D)The correlation is positive but not significantly different from zero.
E)Cannot be determined from the information given.
A)The correlation is negative.
B)The correlation is not significantly different from zero.
C)The correlation is positive and significantly different from zero.
D)The correlation is positive but not significantly different from zero.
E)Cannot be determined from the information given.
سؤال
A least squares estimated regression line has been fitted to a set of data and the resulting residual plot is shown.Which is true?
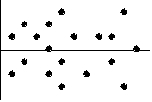
A)The linear model is appropriate.
B)The linear model is poor because some residuals are large.
C)The linear model is poor because the correlation is near 0.
D)A curved model would be better.
E)A transformation of the data is required.
A)The linear model is appropriate.
B)The linear model is poor because some residuals are large.
C)The linear model is poor because the correlation is near 0.
D)A curved model would be better.
E)A transformation of the data is required.
سؤال
If the point in the upper left corner of the scatterplot shown below is removed, what will happen to the correlation (r) and the slope of the line of best fit (b)?
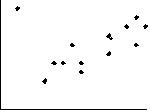
A)They will not change.
B)Both will increase.
C)Both will decrease.
D)r will increase and b will decrease.
E)r will decrease and b will increase.
A)They will not change.
B)Both will increase.
C)Both will decrease.
D)r will increase and b will decrease.
E)r will decrease and b will increase.
سؤال
Data are collected on the number of foreign visitors to a country (million) and total tourism revenue ($billion) for a sample of 10 countries.According to the following output, what is standard error of the slope for this estimated regression equation?
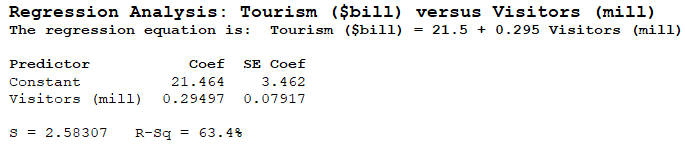
A)2.58307
B)3.462
C)0.07917
D)6.672
E)0.29497
A)2.58307
B)3.462
C)0.07917
D)6.672
E)0.29497
سؤال
Using this regression equation: Salary = 37.2 + 1.49 Years' Experience to predict salary for pharmacists with 10 years of experience gives the following results.Which of the following is true?

A)95% of pharmacists with 10 years of experience earn between $38,960 and $65,130.
B)95% of pharmacists with 10 years of experience earn between $48,010 and $56,080.
C)We are 95% confident that a particular pharmacist who has 10 years of experience earns between $38,960 and $65,130.
D)We are 95% confident that a particular pharmacist who has 10 years of experience earns between $48,010 and $56,080
E)95% of pharmacists with 10 years experience on average earn between $48,010 and $56,080.
سؤال
سؤال
For the following data, the forecasted monthly return for January 2008 using a three-month moving average is ________________________ .

A)1.77
B)1.9
C)1.55
D)2.47
E)1.47
A)1.77
B)1.9
C)1.55
D)2.47
E)1.47
سؤال
سؤال
The regression equation to predict the job performance of new hires based on age, GPA and gender (female = 1 and male = 0) is

Which of the following is the correct interpretation for the regression coefficient of Gender?
A)The regression coefficient indicates that the job performance score for a female will, on average, be 9.06 points higher than for males of the same age and GPA.
B)The regression coefficient indicates that the job performance score for a female will, on average, be 9.06 points lower than for males of the same age and GPA.
C)The regression coefficient indicates that the job performance score for a female will, on average, be 9.06 times higher than for males.
D)The regression coefficient indicates that the job performance score for a female will, on average, be 9.06 times lower than for males.
E)The regression coefficient is not significantly different from zero.
سؤال
سؤال
The following scatterplot shows output/hour labor and years.The graphical display is an example of what type of data?
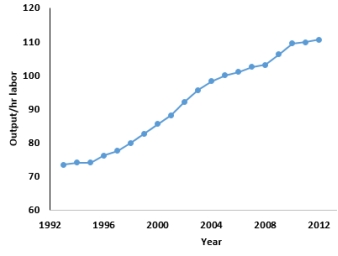
A)Cross-sectional
B)Nominal
C)Categorical
D)Time Series
E)Ordinal
A)Cross-sectional
B)Nominal
C)Categorical
D)Time Series
E)Ordinal
سؤال
According to the residual plot for a linear regression model shown to the right, the linear model ________________________ .
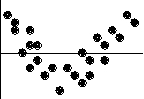
A)okay because the same number of points is above the line as below it
B)okay because the association between the two variables is fairly strong
C)no good because the correlation is near 0
D)no good because some residuals are large
E)no good because of the curve in the residuals
A)okay because the same number of points is above the line as below it
B)okay because the association between the two variables is fairly strong
C)no good because the correlation is near 0
D)no good because some residuals are large
E)no good because of the curve in the residuals
سؤال
A consumer research group investigating the relationship between the price of meat (per pound) and the fat content (grams) gathered data that produced the following scatterplot.The residual of the point ($2.00 per pound, 6 grams of fat) is
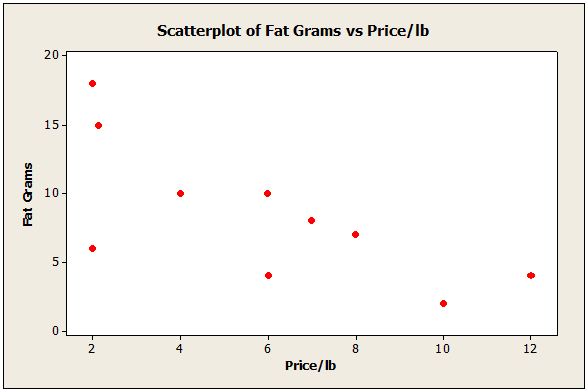
A)A large positive value
B)A large negative value
C)Affecting the correlation of the variables
D)Both B and C
E)Both A and C
A)A large positive value
B)A large negative value
C)Affecting the correlation of the variables
D)Both B and C
E)Both A and C
سؤال
A recent survey of online shoppers asked them to indicate the primary reason they shop via the Internet.The table summarizes responses by reason and gender.What percent of respondents cite Convenience as the primary reason they shop online?

A)42%
B)23%
C)62%
D)85%
E)33%
A)42%
B)23%
C)62%
D)85%
E)33%
سؤال
According to the multiple regression model to predict the job performance of new hires based on age, GPA and gender (female = 1 and male = 0) shown below, how much of the variability in Job Performance is explained by the model?
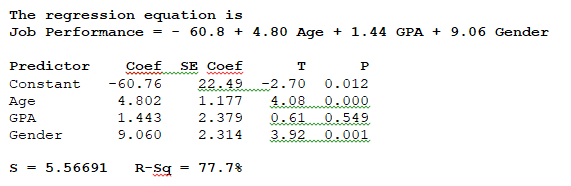
A)30.33 %
B)77.7 %
C)5.56 %
D)60.76 %
E)Cannot be determined.
A)30.33 %
B)77.7 %
C)5.56 %
D)60.76 %
E)Cannot be determined.
سؤال
Based on the actual and forecasted returns shown below, the MAD is ________________________ .

A)0.507
B)2.344
C)0.249
D)1.531
E)None of the above
A)0.507
B)2.344
C)0.249
D)1.531
E)None of the above
سؤال
سؤال
The results of a multiple regression model to predict the job performance of new hires based on age, GPA and gender (female = 1 and male = 0 are shown below.At
Α = .05 we can conclude that ________________________ .
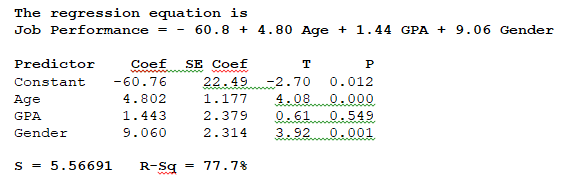
A)Age is not a significant variable in predicting job performance
B)GPA is a significant variable in predicting job performance
C)the regression coefficient associated with GPA is significantly different from zero
D)Gender is a significant variable in predicting job performance
E)the regression coefficient associated with Age is not significantly different from zero
Α = .05 we can conclude that ________________________ .
A)Age is not a significant variable in predicting job performance
B)GPA is a significant variable in predicting job performance
C)the regression coefficient associated with GPA is significantly different from zero
D)Gender is a significant variable in predicting job performance
E)the regression coefficient associated with Age is not significantly different from zero
سؤال
The time series graph below shows monthly sales figures for a specialty gift item sold on the Home Shopping Network (HSN).The dominant component in these data is ________________________ .
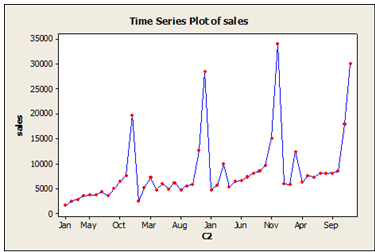
A)Cyclical
B)Seasonal
C)Randomness
D)Irregular
E)Error
A)Cyclical
B)Seasonal
C)Randomness
D)Irregular
E)Error
سؤال
Use a single exponential smoothing (SES) model with α = .8 to forecast for January 2008 for the following data.Assuming that the forecast for December 2007 was 1.18 %, this value is ________________________ .

A)1.50
B)1.18
C)1.75
D)1.90
E)2.20
A)1.50
B)1.18
C)1.75
D)1.90
E)2.20
سؤال
The following scatterplot shows output/unit capital and years.The data show
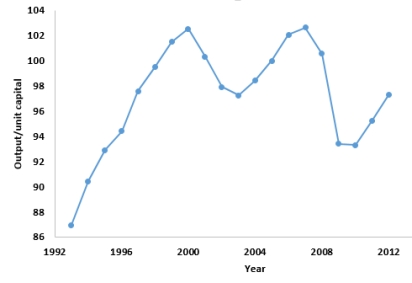
A)There is no consistent increasing or decreasing over time.
B)There is no evidence of a seasonal component.
C)There is some evidence of a cyclical component.
D)There is no linear trend over the time period.
E)All of the above.
A)There is no consistent increasing or decreasing over time.
B)There is no evidence of a seasonal component.
C)There is some evidence of a cyclical component.
D)There is no linear trend over the time period.
E)All of the above.
سؤال
سؤال
According to the following regression analysis, the correlation between average annual cash bonus and average annual pay using α = 0.05 is ________________________ .
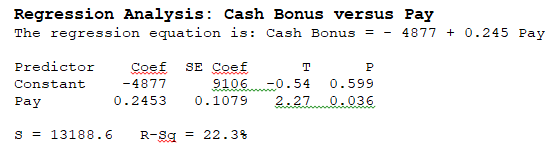
A)not significantly different from zero
B)negative but not significantly different from zero
C)positive and significantly different from zero
D)negative and significantly different from zero
E)Cannot be determined from the information given
A)not significantly different from zero
B)negative but not significantly different from zero
C)positive and significantly different from zero
D)negative and significantly different from zero
E)Cannot be determined from the information given
سؤال
سؤال
Using the following regression analysis of the relationship between the size of cash bonuses and pay scale, find the correlation between average annual cash bonus and average annual pay?
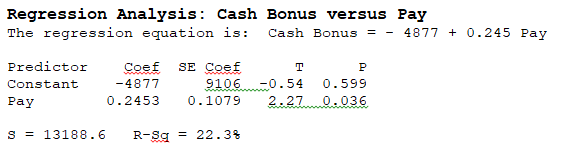
A)-0.540
B)-0.223
C)0.108
D)0.472
E)Cannot be determined from the information given.
A)-0.540
B)-0.223
C)0.108
D)0.472
E)Cannot be determined from the information given.

فتح الحزمة
قم بالتسجيل لفتح البطاقات في هذه المجموعة!
Unlock Deck
Unlock Deck
1/207
العب
ملء الشاشة (f)
Deck 26: Statistics and Data Analysis
1
A company that processes wheat varies the milling time (short, medium and long) and bleaching (no bleaching and bleaching) and measure fiber content (gms/100 grams) of the resulting wheat product to determine the best combination for a desirable wheat product.Which of the following is true about this study?
A)It is an observational study.
B)It is a completely randomized design in one factor.
C)The different levels of milling time act as blocks in the design.
D)It is an experimental study.
E)The different level of bleaching act as blocks in the design.
A)It is an observational study.
B)It is a completely randomized design in one factor.
C)The different levels of milling time act as blocks in the design.
D)It is an experimental study.
E)The different level of bleaching act as blocks in the design.
It is an experimental study.
2
As a preliminary step in its product testing, a fast food chain has two small groups (4 teenagers, 6 older adults) sample the item and "grade" it on "taste." According to the data below, what is the value of an appropriate nonparametric test statistic to determine if the two groups differ in opinion?
GLOBAL : Please place the table above the answers
A)9
B)10
C)11
D)12
E)13
GLOBAL : Please place the table above the answers
A)9
B)10
C)11
D)12
E)13
11
3
A company that processes wheat varies the milling time (short, medium and long) and bleaching (no bleaching and bleaching) and measure fiber content (gms/100 grams) of the resulting wheat product to determine the best combination for a desirable wheat product.According to ANOVA results below, the F statistic for testing whether bleaching has an effect on fiber content is ________________________ .
A)1.43
B)1.99
C)17.22
D)19.01
E)45.22
A)1.43
B)1.99
C)17.22
D)19.01
E)45.22
17.22
4
Estimated profits for an investor would depend on how successful a bailout bill would be in helping the U.S.economy.The estimated annual return for two different investment strategies are shown in the following table.If there is a 30% chance that the economy will decline, 50% that there will be no change and 20% chance that it will rebound, the standard deviation associated with the investment strategy of allocating 80% to stocks and 20% to bonds is ________________________ .
A)$1782
B)$2245
C)$2567
D)$3473
E)$4500
A)$1782
B)$2245
C)$2567
D)$3473
E)$4500
فتح الحزمة
افتح القفل للوصول البطاقات البالغ عددها 207 في هذه المجموعة.
فتح الحزمة
k this deck
5
Suppose that over the last 20 weeks, a law firm had a total of 1045 consultation calls, and that 126 of them did not get an appointment for an initial consult within 24 hours.The lower and upper control limits on the appropriate control chart for these data are ________________________ .
A)0.091 and 0.151
B)0 and 0.124
C)0 and 0.342
D)0.184 and 0.262
E)0.366 and 0.458
A)0.091 and 0.151
B)0 and 0.124
C)0 and 0.342
D)0.184 and 0.262
E)0.366 and 0.458
فتح الحزمة
افتح القفل للوصول البطاقات البالغ عددها 207 في هذه المجموعة.
فتح الحزمة
k this deck
6
The effectiveness of three brands of stain remover (EZ-Clean, SpotX, and OXYBoost) were rated (A = excellent to F = poor) by different groups of consumers.The calculated value of the statistic for the appropriate nonparametric test is ________________________ .
A)2.67
B)5.62
C)9.12
D)11.4
E)12.0
A)2.67
B)5.62
C)9.12
D)11.4
E)12.0
فتح الحزمة
افتح القفل للوصول البطاقات البالغ عددها 207 في هذه المجموعة.
فتح الحزمة
k this deck
7
Suppose that a textile manufacturer finds is an average of 5.5 defects per 100 square foot sections of carpet as part of its quality assurance program.An appropriate control chart to use for these data is the ________________________ .
A)p chart
B)c chart
C)x-bar and r chart
D)Pareto chart
E)ARL chart
A)p chart
B)c chart
C)x-bar and r chart
D)Pareto chart
E)ARL chart
فتح الحزمة
افتح القفل للوصول البطاقات البالغ عددها 207 في هذه المجموعة.
فتح الحزمة
k this deck
8
A manufacturer of solid wood cabinetry requires that its lumber has moisture content (MC) between 5% and 9%.Twenty-five subgroups, each consisting of six pieces of lumber, yield an average MC of 6.95% and an average range of 2.2%.What is the Cpk index?
A)0.37
B)0.75
C)1.53
D)1.99
E)2.67
A)0.37
B)0.75
C)1.53
D)1.99
E)2.67
فتح الحزمة
افتح القفل للوصول البطاقات البالغ عددها 207 في هذه المجموعة.
فتح الحزمة
k this deck
9
As a preliminary step in its product testing, a fast food chain has two small groups (4 teenagers, 6 older adults) sample the item and "grade" it on "taste." Ratings were grades A to C (including + and -).What nonparametric method is appropriate to determine if the two groups differ in opinion?
A)Wilcoxon Rank-Sum
B)Wilcoxon Signed-Rank
C)Spearman's rho
D)Kruskal Wallis
E)Kendall's tau
A)Wilcoxon Rank-Sum
B)Wilcoxon Signed-Rank
C)Spearman's rho
D)Kruskal Wallis
E)Kendall's tau
فتح الحزمة
افتح القفل للوصول البطاقات البالغ عددها 207 في هذه المجموعة.
فتح الحزمة
k this deck
10
A manufacturer of solid wood cabinetry requires that its lumber has moisture content (MC) between 5% and 9%.Twenty-five subgroups, each consisting of six pieces of lumber, yield an average MC of 6.95% and an average range of 2.2%.The estimated process standard deviation () is ________________________ .
A)0.18%
B)0.87%
C)1.22%
D)2.2%
E)2.74%
) is ________________________ .A)0.18%
B)0.87%
C)1.22%
D)2.2%
E)2.74%
فتح الحزمة
افتح القفل للوصول البطاقات البالغ عددها 207 في هذه المجموعة.
فتح الحزمة
k this deck
11
Based on the partial ANOVA results shown below, the F statistic value is ________________________ .
A)F = 19.01
B)F = 1.407
C)F = 48.7
D)F = 0.499
E)None of the above.
A)F = 19.01
B)F = 1.407
C)F = 48.7
D)F = 0.499
E)None of the above.
فتح الحزمة
افتح القفل للوصول البطاقات البالغ عددها 207 في هذه المجموعة.
فتح الحزمة
k this deck
12
Suppose that over the last 20 weeks, a law firm had a total of 1045 consultation calls, and that 126 of them did not get an appointment for an initial consult within 24 hours.An appropriate control chart to use for these data is the ________________________ .
A)p chart
B)c chart
C)x-bar and r chart
D)Pareto chart
E)ARL chart
A)p chart
B)c chart
C)x-bar and r chart
D)Pareto chart
E)ARL chart
فتح الحزمة
افتح القفل للوصول البطاقات البالغ عددها 207 في هذه المجموعة.
فتح الحزمة
k this deck
13
Suppose that over the last 20 weeks, a law firm had a total of 1045 consultation calls, and that 126 of them did not get an appointment for an initial consult within 24 hours.The centerline on the appropriate control chart for these data is ________________________ .
A)0.006
B)0.098
C)0.121
D)0.223
E)0.412
A)0.006
B)0.098
C)0.121
D)0.223
E)0.412
فتح الحزمة
افتح القفل للوصول البطاقات البالغ عددها 207 في هذه المجموعة.
فتح الحزمة
k this deck
14
Estimated profits for an investor would depend on how successful a bailout bill would be in helping the U.S.economy.The estimated annual return for two different investment strategies are shown in the following table.If there is a 30% chance that the economy will decline, 50% that there will be no change and 20% chance that it will rebound, the expected value with perfect information is ________________________ .
A)-$250
B)-$450
C)$590
D)$700
E)$1290
A)-$250
B)-$450
C)$590
D)$700
E)$1290
فتح الحزمة
افتح القفل للوصول البطاقات البالغ عددها 207 في هذه المجموعة.
فتح الحزمة
k this deck
15
The effectiveness of three brands of stain remover (EZ-Clean, SpotX, and OXYBoost) were rated (A = excellent to F = poor) by different groups of consumers.The appropriate nonparametric procedure to use to determine whether there differences in the perceived effectiveness among the three brands?
A)Wilcoxon Signed-Rank test.
B)Wilcoxon Rank Sum test.
C)Kruskal Wallis test.
D)Spearman's rho.
E)Mann-Whitney test.
A)Wilcoxon Signed-Rank test.
B)Wilcoxon Rank Sum test.
C)Kruskal Wallis test.
D)Spearman's rho.
E)Mann-Whitney test.
فتح الحزمة
افتح القفل للوصول البطاقات البالغ عددها 207 في هذه المجموعة.
فتح الحزمة
k this deck
16
Suppose that a textile manufacturer finds is an average of 5.5 defects per 100 square foot sections of carpet as part of its quality assurance program.The lower and upper control limits for the appropriate control chart for these data are ________________________ .
A)0 and 7.688
B)0 and 10.986
C)0 and 12.536
D)2.0 and 9.0
E)2.567 and 12.536
A)0 and 7.688
B)0 and 10.986
C)0 and 12.536
D)2.0 and 9.0
E)2.567 and 12.536
فتح الحزمة
افتح القفل للوصول البطاقات البالغ عددها 207 في هذه المجموعة.
فتح الحزمة
k this deck
17
In data mining, which of the following is an example of a transactional variable?
A)Household income
B)Occupation
C)Age
D)Annual charitable donations
E)Number of children in household
A)Household income
B)Occupation
C)Age
D)Annual charitable donations
E)Number of children in household
فتح الحزمة
افتح القفل للوصول البطاقات البالغ عددها 207 في هذه المجموعة.
فتح الحزمة
k this deck
18
Data were analyzed to see if income level (1 = Low, 2 = Middle, 3 = High) influence the amount consumers spend online for holiday shopping.Based on the ANOVA results shown below, the F statistic value is ________________________ .
A)F = 0.500
B)F = 2.644
C)F = 35.79
D)F = 145
E)None of the above.
A)F = 0.500
B)F = 2.644
C)F = 35.79
D)F = 145
E)None of the above.
فتح الحزمة
افتح القفل للوصول البطاقات البالغ عددها 207 في هذه المجموعة.
فتح الحزمة
k this deck
19
A company that processes wheat varies the milling time (short, medium and long) and bleaching (no bleaching and bleaching) and measure fiber content (gms/100 grams) of the resulting wheat product to determine the best combination for a desirable wheat product.According to ANOVA results below, the F statistic for testing whether milling has an effect on fiber content is ________________________ .
A)1.43
B)1.99
C)17.22
D)19.01
E)45.22
A)1.43
B)1.99
C)17.22
D)19.01
E)45.22
فتح الحزمة
افتح القفل للوصول البطاقات البالغ عددها 207 في هذه المجموعة.
فتح الحزمة
k this deck
20
The nonparametric alternative to the paired t-test is the _______________________ .
A)Kruskal-Wallis test
B)Kendall's tau
C)Wilcoxon Rank Sum test
D)Friedman test
E)Wilcoxon Signed Rank test
A)Kruskal-Wallis test
B)Kendall's tau
C)Wilcoxon Rank Sum test
D)Friedman test
E)Wilcoxon Signed Rank test
فتح الحزمة
افتح القفل للوصول البطاقات البالغ عددها 207 في هذه المجموعة.
فتح الحزمة
k this deck
21
Data were collected for a sample of 12 pharmacists to determine if years of experience and salary are related.Based on the results below, the standard error of the slope for this estimated regression equation is ________________________ .
A)3.381
B)0.2149
C)5.58485
D)82.8
E)1.4882
A)3.381
B)0.2149
C)5.58485
D)82.8
E)1.4882
فتح الحزمة
افتح القفل للوصول البطاقات البالغ عددها 207 في هذه المجموعة.
فتح الحزمة
k this deck
22
The experiment is run once for each combination of brand of AAA batteries and device (TV remote, hand-held game, flashlight and digital camera).The twelve runs are ordered randomly.The time (in minutes) that each battery lasts under continuous usage is recorded.Which of the following statements is true about this design?
A)This is a completely randomized design in one factor.
B)The devices serve as blocks to account for the variability between the lengths of time batteries last in different devices.
C)The interaction effect between brand of battery and type of device is significant.
D)This is an observational study.
E)This is a retrospective study.
فتح الحزمة
افتح القفل للوصول البطاقات البالغ عددها 207 في هذه المجموعة.
فتح الحزمة
k this deck
23
A major customer for a vendor of plastic containers requires that its containers have a volume of 10,000 cubic inches with a tolerance of 50 cubic inches.Forty subgroups of five containers each were selected periodically from the production process.The average of the means across all subgroups was found to be 10,012 cubic inches and the average range was 48 cubic inches.What is the Cp index?
A)0.203
B)0.807
C)1.615
D)2.667
E)4.845
A)0.203
B)0.807
C)1.615
D)2.667
E)4.845
فتح الحزمة
افتح القفل للوصول البطاقات البالغ عددها 207 في هذه المجموعة.
فتح الحزمة
k this deck
24
A company counts and records the number of data entry errors made on the first order form completed each day for a month (control charting).An appropriate control chart to use for these data is the ________________________ .
A)p chart
B)c chart
C)x-bar and r chart
D)Pareto chart
E)ARL chart
A)p chart
B)c chart
C)x-bar and r chart
D)Pareto chart
E)ARL chart
فتح الحزمة
افتح القفل للوصول البطاقات البالغ عددها 207 في هذه المجموعة.
فتح الحزمة
k this deck
25
Three wines (California, Australian and Italian) were tasted by a different group of judges as part of an annual food and wine festival.The judges graded the wines on overall quality (A = excellent to F = poor).The calculated value of the statistic for the appropriate nonparametric test to determine differences in perceived quality is ________________________ .
A)1.25
B)10.78
C)9.45
D)4.34
E)3.45
A)1.25
B)10.78
C)9.45
D)4.34
E)3.45
فتح الحزمة
افتح القفل للوصول البطاقات البالغ عددها 207 في هذه المجموعة.
فتح الحزمة
k this deck
26
Disparate databases that include demographic and transactional variables merged together are referred to as ________________________ .
A)Data storage bins
B)Data mines
C)OLAP
D)CRISP
E)Data warehouses
A)Data storage bins
B)Data mines
C)OLAP
D)CRISP
E)Data warehouses
فتح الحزمة
افتح القفل للوصول البطاقات البالغ عددها 207 في هذه المجموعة.
فتح الحزمة
k this deck
27
A major customer for a vendor of plastic containers requires that its containers have a volume of 10,000 cubic inches with a tolerance of 50 cubic inches.Forty subgroups of five containers each were selected periodically from the production process.The average of the means across all subgroups was found to be 10,012 cubic inches and the average range was 48 cubic inches.The lower and upper control limits for the R chart are ________________________ .
A)0 and 111.65 cubic inches
B)9984.30 and 10,039.70 cubic inches
C)9910.53 and 10,113.47 cubic inches
D)0 and 101.47 cubic inches
E)0 to 98 cubic inches
A)0 and 111.65 cubic inches
B)9984.30 and 10,039.70 cubic inches
C)9910.53 and 10,113.47 cubic inches
D)0 and 101.47 cubic inches
E)0 to 98 cubic inches
فتح الحزمة
افتح القفل للوصول البطاقات البالغ عددها 207 في هذه المجموعة.
فتح الحزمة
k this deck
28
The following payoff table (in thousands of dollars) considers three possible levels of demand in a housing complex.If there is a 45% chance that the demand level will be low, 30% that it will be medium and 25% chance that it will be high, what is the expected value of perfect information?
A)$208.75
B)$225
C)$310
D)$326.25
E)$535
A)$208.75
B)$225
C)$310
D)$326.25
E)$535
فتح الحزمة
افتح القفل للوصول البطاقات البالغ عددها 207 في هذه المجموعة.
فتح الحزمة
k this deck
29
A major customer for a vendor of plastic containers requires that its containers have a volume of 10,000 cubic inches with a tolerance of 50 cubic inches.Forty subgroups of five containers each were selected periodically from the production process.The average of the means across all subgroups was found to be 10,012 cubic inches and the average range was 48 cubic inches.The estimated process standard deviation () is ________________________ .
A)48 cubic inches
B)22.69 cubic inches
C)20.64 cubic inches
D)50 inches
E)32.99 cubic inches
) is ________________________ .A)48 cubic inches
B)22.69 cubic inches
C)20.64 cubic inches
D)50 inches
E)32.99 cubic inches
فتح الحزمة
افتح القفل للوصول البطاقات البالغ عددها 207 في هذه المجموعة.
فتح الحزمة
k this deck
30
Suppose that six different e-readers were evaluated by two senior citizen consumer groups using rankings from 1 (best) to 6 (worst).What nonparametric method should be used to determine the association between these rankings?
A)Spearman's rho
B)Pearson's rho
C)Wilcoxon Signed-Rank test
D)Mann-Whitney test
E)Wilcoxon's rho
A)Spearman's rho
B)Pearson's rho
C)Wilcoxon Signed-Rank test
D)Mann-Whitney test
E)Wilcoxon's rho
فتح الحزمة
افتح القفل للوصول البطاقات البالغ عددها 207 في هذه المجموعة.
فتح الحزمة
k this deck
31
Three wines (California, Australian and Italian) were tasted by a different group of judges as part of an annual food and wine festival.The judges graded the wines on overall quality (A = excellent to F = poor).The appropriate nonparametric procedure to determine differences in perceived quality is ________________________ .
A)Wilcoxon Signed-Rank test
B)Wilcoxon Rank Sum test
C)Kruskal Wallis test
D)Spearman's rho
E)Mann-Whitney test
A)Wilcoxon Signed-Rank test
B)Wilcoxon Rank Sum test
C)Kruskal Wallis test
D)Spearman's rho
E)Mann-Whitney test
فتح الحزمة
افتح القفل للوصول البطاقات البالغ عددها 207 في هذه المجموعة.
فتح الحزمة
k this deck
32
Suppose that six different e-readers were evaluated by two senior citizen consumer groups using rankings from 1 (best) to 6 (worst).To determine if there is a difference in the rankings between the two magazines, the appropriate nonparametric method is the ________________________ .
A)Wilcoxon Rank-Sum test
B)Wilcoxon Signed-Rank test
C)Spearman's rho
D)Kruskal Wallis test
E)Kendall's tau
A)Wilcoxon Rank-Sum test
B)Wilcoxon Signed-Rank test
C)Spearman's rho
D)Kruskal Wallis test
E)Kendall's tau
فتح الحزمة
افتح القفل للوصول البطاقات البالغ عددها 207 في هذه المجموعة.
فتح الحزمة
k this deck
33
Suppose the P-value associated with the F-statistic for testing whether brand affects battery lifetime is 0.128.Based on this we can conclude that ________________________ .
A)we should reject the null hypothesis
B)there is a difference in the mean lifetimes among the different brands
C)there is a difference in the mean lifetimes among the different devices
D)there is no significant interaction effect
E)there is no difference in the mean lifetimes among the different brands
فتح الحزمة
افتح القفل للوصول البطاقات البالغ عددها 207 في هذه المجموعة.
فتح الحزمة
k this deck
34
Based on the following plot of residuals, what can you say about the conditions for ANOVA?
A)The equal variance assumption is satisfied.
B)The linearity assumption is satisfied.
C)The nearly normal assumption is satisfied.
D)The nearly normal assumption is not satisfied.
E)The additive assumption is satisfied.
A)The equal variance assumption is satisfied.
B)The linearity assumption is satisfied.
C)The nearly normal assumption is satisfied.
D)The nearly normal assumption is not satisfied.
E)The additive assumption is satisfied.
فتح الحزمة
افتح القفل للوصول البطاقات البالغ عددها 207 في هذه المجموعة.
فتح الحزمة
k this deck
35
The following payoff table (in thousands of dollars) considers three possible levels of demand in a housing complex.Using the maximax approach, the action taken should be to ________________________ .
A)build a small complex
B)build a large complex
C)build a large complex with high demand
D)build a small complex with low demand
E)do not build any size complex
A)build a small complex
B)build a large complex
C)build a large complex with high demand
D)build a small complex with low demand
E)do not build any size complex
فتح الحزمة
افتح القفل للوصول البطاقات البالغ عددها 207 في هذه المجموعة.
فتح الحزمة
k this deck
36
The nonparametric alternative to the two sample t-test is the ________________________ .
A)Kruskal-Wallis test
B)Kendall's tau
C)Wilcoxon Rank Sum test
D)Friedman test
E)Wilcoxon Signed Rank test
A)Kruskal-Wallis test
B)Kendall's tau
C)Wilcoxon Rank Sum test
D)Friedman test
E)Wilcoxon Signed Rank test
فتح الحزمة
افتح القفل للوصول البطاقات البالغ عددها 207 في هذه المجموعة.
فتح الحزمة
k this deck
37
A major customer for a vendor of plastic containers requires that its containers have a volume of 10,000 cubic inches with a tolerance of 50 cubic inches.Forty subgroups of five containers each were selected periodically from the production process.The average of the means across all subgroups was found to be 10,012 cubic inches and the average range was 48 cubic inches.The lower and upper control limits for the X-bar chart are ________________________ .
A)0 and 111.65 cubic inches
B)9984.30 and 10,039.70 cubic inches
C)9910.53 and 10,113.47 cubic inches
D)0 and 101.47 cubic inches
E)9950 and 10,050 cubic inches
A)0 and 111.65 cubic inches
B)9984.30 and 10,039.70 cubic inches
C)9910.53 and 10,113.47 cubic inches
D)0 and 101.47 cubic inches
E)9950 and 10,050 cubic inches
فتح الحزمة
افتح القفل للوصول البطاقات البالغ عددها 207 في هذه المجموعة.
فتح الحزمة
k this deck
38
To initiate control charting, twenty-five samples of size five are periodically taken and the resistance (in ohms) of each copper wire is measured.An appropriate control chart to use for these data is the ________________________ .
A)p chart
B)c chart
C)x-bar and r chart
D)Pareto chart
E)ARL chart
A)p chart
B)c chart
C)x-bar and r chart
D)Pareto chart
E)ARL chart
فتح الحزمة
افتح القفل للوصول البطاقات البالغ عددها 207 في هذه المجموعة.
فتح الحزمة
k this deck
39
Suppose that six different e-readers were evaluated by two senior citizen groups with respect to their suitability for use among the older segment of the population.The rankings from 1 (best) to 6 (worst) are shown below.Using the appropriate nonparametric method, the value of the calculated test statistic to determine if there is a difference in the rankings between the two magazines is ________________________ .
GLOBAL : Please place the table above and answers below
A)2.5
B)3
C)5.5
D)7.5
E)10
GLOBAL : Please place the table above and answers below
A)2.5
B)3
C)5.5
D)7.5
E)10
فتح الحزمة
افتح القفل للوصول البطاقات البالغ عددها 207 في هذه المجموعة.
فتح الحزمة
k this deck
40
The following payoff table (in thousands of dollars) considers three possible levels of demand in a housing complex.If there is a 45% chance that the demand level will be low, 30% that it will be medium and 25% chance that it will be high, the expected value (in thousands of dollars) associated with the best action is ________________________ .
A)$208.75
B)$225
C)$310
D)$326.25
E)$535
A)$208.75
B)$225
C)$310
D)$326.25
E)$535
فتح الحزمة
افتح القفل للوصول البطاقات البالغ عددها 207 في هذه المجموعة.
فتح الحزمة
k this deck
41
According to the regression analysis output below, how much of the variability in tourism revenue is accounted for by the number of foreign visitors?
A)63.4 %
B)13.8 %
C)2.58 billion $
D)21.464 %
E)3.73 billion $
A)63.4 %
B)13.8 %
C)2.58 billion $
D)21.464 %
E)3.73 billion $
فتح الحزمة
افتح القفل للوصول البطاقات البالغ عددها 207 في هذه المجموعة.
فتح الحزمة
k this deck
42
Quarterly returns were forecasted for a mutual fund comprised of technology stocks.The forecast errors for the last six quarters are as follows: -0.47, 1.12, -0.85, 1.27, 0.07, and -0.05.The MAD based on these forecast errors is ________________________ .
A)0.18
B)0.22
C)0.64
D)0.77
E)0.98
A)0.18
B)0.22
C)0.64
D)0.77
E)0.98
فتح الحزمة
افتح القفل للوصول البطاقات البالغ عددها 207 في هذه المجموعة.
فتح الحزمة
k this deck
43
Based on the output below from regression analysis performed to develop a model for predicting a firm's Price-Earnings Ratio (PE) based on Growth Rate, Profit Margin, and whether or not the firm is Green (1 = Yes, 0 = No), we can conclude (α = .05) that ________________________ .
A)Growth Rate is not a significant variable in predicting a firm's PE ratio
B)Profit Margin is a significant variable in predicting a firm's PE ratio
C)the regression coefficient associated with Growth Rate is not significantly different from zero
D)whether or not a firm is Green is significant in predicting its PE ratio
E)the regression coefficient associated with Profit Margin is significantly different from zero
فتح الحزمة
افتح القفل للوصول البطاقات البالغ عددها 207 في هذه المجموعة.
فتح الحزمة
k this deck
44
Quarterly returns were forecasted for a mutual fund comprised of technology stocks.The forecast errors for the last six quarters are as follows: -0.47, 1.12, -0.85, 1.27, 0.07, and -0.05.The MSE based on these forecast errors is ________________________ .
A)0.18
B)0.22
C)0.64
D)0.77
E)0.98
A)0.18
B)0.22
C)0.64
D)0.77
E)0.98
فتح الحزمة
افتح القفل للوصول البطاقات البالغ عددها 207 في هذه المجموعة.
فتح الحزمة
k this deck
45
If we were interested in using regression methods to predict the tourism revenue for a particular country that had 30 million foreign visitors we should ________________________ .
A)construct a confidence interval using the regression equation
B)construct a predication interval using the regression equation
C)use the correlation
D)use the standard error
E)None of these.
A)construct a confidence interval using the regression equation
B)construct a predication interval using the regression equation
C)use the correlation
D)use the standard error
E)None of these.
فتح الحزمة
افتح القفل للوصول البطاقات البالغ عددها 207 في هذه المجموعة.
فتح الحزمة
k this deck
46
Data were collected for a sample of 12 pharmacists to determine if years of experience and salary are related.Based on the results below, the calculated t-statistic to test whether the regression slope is significant is ________________________ .
A)10.99
B)47.97
C)31.2
D)6.93
E)5.58485
A)10.99
B)47.97
C)31.2
D)6.93
E)5.58485
فتح الحزمة
افتح القفل للوصول البطاقات البالغ عددها 207 في هذه المجموعة.
فتح الحزمة
k this deck
47
A Durbin Watson statistic calculated on a regression model has a value of 0.279.This indicates that the ________________________ .
A)residuals are positively autocorrelated
B)residuals are negatively autocorrelated
C)residuals are not autocorrelated
D)test is inconclusive
E)Durbin Watson cannot be used for this model
A)residuals are positively autocorrelated
B)residuals are negatively autocorrelated
C)residuals are not autocorrelated
D)test is inconclusive
E)Durbin Watson cannot be used for this model
فتح الحزمة
افتح القفل للوصول البطاقات البالغ عددها 207 في هذه المجموعة.
فتح الحزمة
k this deck
48
A regression model:
Was developed to predict a firm's Price-Earnings Ratio (PE) using Growth Rate, Profit Margin, and whether the firm is Green (1 = Yes, 0 = No).Which of the following is the correct interpretation for the regression coefficient of Green?
A)The regression coefficient indicates that the PE ratio of a firm that is green will, on average, be 2.09 higher than a firm that is not green with the same growth rate and profit margin.
B)The regression coefficient indicates that the PE ratio of a firm that is green will, on average, be 2.09 lower than a firm that is not green with the same growth rate and profit margin.
C)The regression coefficient indicates that the PE ratio of a firm that is green will, on average, be 2.09 times higher than a firm that is not green with the same growth rate and profit margin.
D)The regression coefficient indicates that the PE ratio of a firm that is green will, on average, be 2.09 times lower than a firm that is not green with the same growth rate and profit margin.
E)The regression coefficient is not significantly different from zero.
فتح الحزمة
افتح القفل للوصول البطاقات البالغ عددها 207 في هذه المجموعة.
فتح الحزمة
k this deck
49
According to the results below, what is the correlation between stock price and EPS?
A)-0.975
B)0.906
C)0.950
D)0.975
E)Cannot be determined from the information given.
A)-0.975
B)0.906
C)0.950
D)0.975
E)Cannot be determined from the information given.
فتح الحزمة
افتح القفل للوصول البطاقات البالغ عددها 207 في هذه المجموعة.
فتح الحزمة
k this deck
50
Which of the following measures is used to check for collinearity when building a multiple regression model?
A)Cook's Distance.
B)Variance Inflation Factor.
C)Determination Coefficient.
D)Standardized Residual.
E)Chef's Distance.
A)Cook's Distance.
B)Variance Inflation Factor.
C)Determination Coefficient.
D)Standardized Residual.
E)Chef's Distance.
فتح الحزمة
افتح القفل للوصول البطاقات البالغ عددها 207 في هذه المجموعة.
فتح الحزمة
k this deck
51
Which of the following statements about a residual plot is true?
A)A curved pattern indicates nonlinear association between the variables.
B)A pattern of increasing spread indicates the predicted values become less reliable as the explanatory variable increases.
C)If all of the residuals are very small, the model will predict accurately.
D)It should not be used if the regression results are not significant.
E)It cannot be used to analyze linear association.
فتح الحزمة
افتح القفل للوصول البطاقات البالغ عددها 207 في هذه المجموعة.
فتح الحزمة
k this deck
52
Data were collected for a sample of 12 pharmacists to determine if years of experience and salary are related.Based on the output below, how much of the variability in pharmacists' salary is accounted for by years of experience?
A)82.8 %
B)47.97 %
C)5.58485 thousand dollars
D)10.99 %
E)98.9 %
A)82.8 %
B)47.97 %
C)5.58485 thousand dollars
D)10.99 %
E)98.9 %
فتح الحزمة
افتح القفل للوصول البطاقات البالغ عددها 207 في هذه المجموعة.
فتح الحزمة
k this deck
53
A first-order autoregressive model, AR (1) was fit to monthly closing stock prices, adjusted for dividends, of Boeing Corporation from January 2006 through August 2008 (closing price on the first trading day of the month).Based on the results shown below, the forecast a month in which the previous month's closing price was $67.52 is ________________________ .
A)$65.67
B)$68.26
C)$71.25
D)$74.06
E)Cannot be determined from the information given.
A)$65.67
B)$68.26
C)$71.25
D)$74.06
E)Cannot be determined from the information given.
فتح الحزمة
افتح القفل للوصول البطاقات البالغ عددها 207 في هذه المجموعة.
فتح الحزمة
k this deck
54
According to the partial regression analysis output below, what is the t-statistic to test whether the regression slope is significant?
A)6.20
B)13.88
C)0.07917
D)2.58307
E)3.73
A)6.20
B)13.88
C)0.07917
D)2.58307
E)3.73
فتح الحزمة
افتح القفل للوصول البطاقات البالغ عددها 207 في هذه المجموعة.
فتح الحزمة
k this deck
55
The model
Can be used to predict the breaking strength (pounds) of a rope from its diameter (inches).According to this model, how much force should a rope one-half inch in diameter withstand?
A)484 pounds
B)16 pounds
C)22 pounds
D)256 pounds
E)4.7 pounds
Can be used to predict the breaking strength (pounds) of a rope from its diameter (inches).According to this model, how much force should a rope one-half inch in diameter withstand?
A)484 pounds
B)16 pounds
C)22 pounds
D)256 pounds
E)4.7 pounds
فتح الحزمة
افتح القفل للوصول البطاقات البالغ عددها 207 في هذه المجموعة.
فتح الحزمة
k this deck
56
According to the output below, which of the following statement is true about the correlation between stock price and earnings per share (EPS)?
A)The correlation is negative.
B)The correlation is not significantly different from zero.
C)The correlation is positive and significantly different from zero.
D)The correlation is positive but not significantly different from zero.
E)Cannot be determined from the information given.
A)The correlation is negative.
B)The correlation is not significantly different from zero.
C)The correlation is positive and significantly different from zero.
D)The correlation is positive but not significantly different from zero.
E)Cannot be determined from the information given.
فتح الحزمة
افتح القفل للوصول البطاقات البالغ عددها 207 في هذه المجموعة.
فتح الحزمة
k this deck
57
A least squares estimated regression line has been fitted to a set of data and the resulting residual plot is shown.Which is true?
A)The linear model is appropriate.
B)The linear model is poor because some residuals are large.
C)The linear model is poor because the correlation is near 0.
D)A curved model would be better.
E)A transformation of the data is required.
A)The linear model is appropriate.
B)The linear model is poor because some residuals are large.
C)The linear model is poor because the correlation is near 0.
D)A curved model would be better.
E)A transformation of the data is required.
فتح الحزمة
افتح القفل للوصول البطاقات البالغ عددها 207 في هذه المجموعة.
فتح الحزمة
k this deck
58
If the point in the upper left corner of the scatterplot shown below is removed, what will happen to the correlation (r) and the slope of the line of best fit (b)?
A)They will not change.
B)Both will increase.
C)Both will decrease.
D)r will increase and b will decrease.
E)r will decrease and b will increase.
A)They will not change.
B)Both will increase.
C)Both will decrease.
D)r will increase and b will decrease.
E)r will decrease and b will increase.
فتح الحزمة
افتح القفل للوصول البطاقات البالغ عددها 207 في هذه المجموعة.
فتح الحزمة
k this deck
59
Data are collected on the number of foreign visitors to a country (million) and total tourism revenue ($billion) for a sample of 10 countries.According to the following output, what is standard error of the slope for this estimated regression equation?
A)2.58307
B)3.462
C)0.07917
D)6.672
E)0.29497
A)2.58307
B)3.462
C)0.07917
D)6.672
E)0.29497
فتح الحزمة
افتح القفل للوصول البطاقات البالغ عددها 207 في هذه المجموعة.
فتح الحزمة
k this deck
60
Using this regression equation: Salary = 37.2 + 1.49 Years' Experience to predict salary for pharmacists with 10 years of experience gives the following results.Which of the following is true?
A)95% of pharmacists with 10 years of experience earn between $38,960 and $65,130.
B)95% of pharmacists with 10 years of experience earn between $48,010 and $56,080.
C)We are 95% confident that a particular pharmacist who has 10 years of experience earns between $38,960 and $65,130.
D)We are 95% confident that a particular pharmacist who has 10 years of experience earns between $48,010 and $56,080
E)95% of pharmacists with 10 years experience on average earn between $48,010 and $56,080.
فتح الحزمة
افتح القفل للوصول البطاقات البالغ عددها 207 في هذه المجموعة.
فتح الحزمة
k this deck
61
What scale of measurement is type of workplace injuries (slip and fall, stress related, etc.)?
A)Quantitative
B)Interval
C)Nominal
D)Ordinal
E)Numerical
A)Quantitative
B)Interval
C)Nominal
D)Ordinal
E)Numerical
فتح الحزمة
افتح القفل للوصول البطاقات البالغ عددها 207 في هذه المجموعة.
فتح الحزمة
k this deck
62
For the following data, the forecasted monthly return for January 2008 using a three-month moving average is ________________________ .
A)1.77
B)1.9
C)1.55
D)2.47
E)1.47
A)1.77
B)1.9
C)1.55
D)2.47
E)1.47
فتح الحزمة
افتح القفل للوصول البطاقات البالغ عددها 207 في هذه المجموعة.
فتح الحزمة
k this deck
63
Which statement about influential points is true?
A)Removal of an influential point changes the regression line.
B)A high leverage point is always influential.
C)Influential points have large residuals.
D)All outliers are influential.
E)None of these.
A)Removal of an influential point changes the regression line.
B)A high leverage point is always influential.
C)Influential points have large residuals.
D)All outliers are influential.
E)None of these.
فتح الحزمة
افتح القفل للوصول البطاقات البالغ عددها 207 في هذه المجموعة.
فتح الحزمة
k this deck
64
The regression equation to predict the job performance of new hires based on age, GPA and gender (female = 1 and male = 0) is
Which of the following is the correct interpretation for the regression coefficient of Gender?
A)The regression coefficient indicates that the job performance score for a female will, on average, be 9.06 points higher than for males of the same age and GPA.
B)The regression coefficient indicates that the job performance score for a female will, on average, be 9.06 points lower than for males of the same age and GPA.
C)The regression coefficient indicates that the job performance score for a female will, on average, be 9.06 times higher than for males.
D)The regression coefficient indicates that the job performance score for a female will, on average, be 9.06 times lower than for males.
E)The regression coefficient is not significantly different from zero.
فتح الحزمة
افتح القفل للوصول البطاقات البالغ عددها 207 في هذه المجموعة.
فتح الحزمة
k this deck
65
The U.S.Bureau of Labor Statistics (BLS) compiles data on a number of variables.Which of the following BLS variables is categorical?
A)Consumer expenditures
B)Type of workplace injuries
C)Wages by occupation
D)Employment costs
E)Productivity by industry
A)Consumer expenditures
B)Type of workplace injuries
C)Wages by occupation
D)Employment costs
E)Productivity by industry
فتح الحزمة
افتح القفل للوصول البطاقات البالغ عددها 207 في هذه المجموعة.
فتح الحزمة
k this deck
66
The following scatterplot shows output/hour labor and years.The graphical display is an example of what type of data?
A)Cross-sectional
B)Nominal
C)Categorical
D)Time Series
E)Ordinal
A)Cross-sectional
B)Nominal
C)Categorical
D)Time Series
E)Ordinal
فتح الحزمة
افتح القفل للوصول البطاقات البالغ عددها 207 في هذه المجموعة.
فتح الحزمة
k this deck
67
According to the residual plot for a linear regression model shown to the right, the linear model ________________________ .
A)okay because the same number of points is above the line as below it
B)okay because the association between the two variables is fairly strong
C)no good because the correlation is near 0
D)no good because some residuals are large
E)no good because of the curve in the residuals
A)okay because the same number of points is above the line as below it
B)okay because the association between the two variables is fairly strong
C)no good because the correlation is near 0
D)no good because some residuals are large
E)no good because of the curve in the residuals
فتح الحزمة
افتح القفل للوصول البطاقات البالغ عددها 207 في هذه المجموعة.
فتح الحزمة
k this deck
68
A consumer research group investigating the relationship between the price of meat (per pound) and the fat content (grams) gathered data that produced the following scatterplot.The residual of the point ($2.00 per pound, 6 grams of fat) is
A)A large positive value
B)A large negative value
C)Affecting the correlation of the variables
D)Both B and C
E)Both A and C
A)A large positive value
B)A large negative value
C)Affecting the correlation of the variables
D)Both B and C
E)Both A and C
فتح الحزمة
افتح القفل للوصول البطاقات البالغ عددها 207 في هذه المجموعة.
فتح الحزمة
k this deck
69
A recent survey of online shoppers asked them to indicate the primary reason they shop via the Internet.The table summarizes responses by reason and gender.What percent of respondents cite Convenience as the primary reason they shop online?
A)42%
B)23%
C)62%
D)85%
E)33%
A)42%
B)23%
C)62%
D)85%
E)33%
فتح الحزمة
افتح القفل للوصول البطاقات البالغ عددها 207 في هذه المجموعة.
فتح الحزمة
k this deck
70
According to the multiple regression model to predict the job performance of new hires based on age, GPA and gender (female = 1 and male = 0) shown below, how much of the variability in Job Performance is explained by the model?
A)30.33 %
B)77.7 %
C)5.56 %
D)60.76 %
E)Cannot be determined.
A)30.33 %
B)77.7 %
C)5.56 %
D)60.76 %
E)Cannot be determined.
فتح الحزمة
افتح القفل للوصول البطاقات البالغ عددها 207 في هذه المجموعة.
فتح الحزمة
k this deck
71
Based on the actual and forecasted returns shown below, the MAD is ________________________ .
A)0.507
B)2.344
C)0.249
D)1.531
E)None of the above
A)0.507
B)2.344
C)0.249
D)1.531
E)None of the above
فتح الحزمة
افتح القفل للوصول البطاقات البالغ عددها 207 في هذه المجموعة.
فتح الحزمة
k this deck
72
The U.S.Bureau of Labor Statistics publishes the monthly CPI (consumer price index).This index shows the change in prices paid by urban consumers for a market basket of goods and services.These data are
A)Cross-sectional
B)Nominal
C)Categorical
D)Time Series
E)Ordinal
A)Cross-sectional
B)Nominal
C)Categorical
D)Time Series
E)Ordinal
فتح الحزمة
افتح القفل للوصول البطاقات البالغ عددها 207 في هذه المجموعة.
فتح الحزمة
k this deck
73
The results of a multiple regression model to predict the job performance of new hires based on age, GPA and gender (female = 1 and male = 0 are shown below.At
Α = .05 we can conclude that ________________________ .
A)Age is not a significant variable in predicting job performance
B)GPA is a significant variable in predicting job performance
C)the regression coefficient associated with GPA is significantly different from zero
D)Gender is a significant variable in predicting job performance
E)the regression coefficient associated with Age is not significantly different from zero
فتح الحزمة
افتح القفل للوصول البطاقات البالغ عددها 207 في هذه المجموعة.
فتح الحزمة
k this deck
74
The time series graph below shows monthly sales figures for a specialty gift item sold on the Home Shopping Network (HSN).The dominant component in these data is ________________________ .
A)Cyclical
B)Seasonal
C)Randomness
D)Irregular
E)Error
A)Cyclical
B)Seasonal
C)Randomness
D)Irregular
E)Error
فتح الحزمة
افتح القفل للوصول البطاقات البالغ عددها 207 في هذه المجموعة.
فتح الحزمة
k this deck
75
Use a single exponential smoothing (SES) model with α = .8 to forecast for January 2008 for the following data.Assuming that the forecast for December 2007 was 1.18 %, this value is ________________________ .
A)1.50
B)1.18
C)1.75
D)1.90
E)2.20
A)1.50
B)1.18
C)1.75
D)1.90
E)2.20
فتح الحزمة
افتح القفل للوصول البطاقات البالغ عددها 207 في هذه المجموعة.
فتح الحزمة
k this deck
76
The following scatterplot shows output/unit capital and years.The data show
A)There is no consistent increasing or decreasing over time.
B)There is no evidence of a seasonal component.
C)There is some evidence of a cyclical component.
D)There is no linear trend over the time period.
E)All of the above.
A)There is no consistent increasing or decreasing over time.
B)There is no evidence of a seasonal component.
C)There is some evidence of a cyclical component.
D)There is no linear trend over the time period.
E)All of the above.
فتح الحزمة
افتح القفل للوصول البطاقات البالغ عددها 207 في هذه المجموعة.
فتح الحزمة
k this deck
77
The Durbin-Watson statistic for a regression model of weekly commodity prices for heating oil (cents) against time was found to be 0.244822.This value indicates that the ________________________ .
A)residuals are positively autocorrelated
B)residuals are negatively autocorrelated
C)residuals are not autocorrelated
D)test is inconclusive
E)none of the above; the Durbin Watson cannot be used for this model
A)residuals are positively autocorrelated
B)residuals are negatively autocorrelated
C)residuals are not autocorrelated
D)test is inconclusive
E)none of the above; the Durbin Watson cannot be used for this model
فتح الحزمة
افتح القفل للوصول البطاقات البالغ عددها 207 في هذه المجموعة.
فتح الحزمة
k this deck
78
According to the following regression analysis, the correlation between average annual cash bonus and average annual pay using α = 0.05 is ________________________ .
A)not significantly different from zero
B)negative but not significantly different from zero
C)positive and significantly different from zero
D)negative and significantly different from zero
E)Cannot be determined from the information given
A)not significantly different from zero
B)negative but not significantly different from zero
C)positive and significantly different from zero
D)negative and significantly different from zero
E)Cannot be determined from the information given
فتح الحزمة
افتح القفل للوصول البطاقات البالغ عددها 207 في هذه المجموعة.
فتح الحزمة
k this deck
79
A farmer has increased his wheat production by about the same amount each year.His most useful predictive model is most probably ________________________ .
A)exponential
B)linear
C)logarithmic
D)power
E)quadratic
A)exponential
B)linear
C)logarithmic
D)power
E)quadratic
فتح الحزمة
افتح القفل للوصول البطاقات البالغ عددها 207 في هذه المجموعة.
فتح الحزمة
k this deck
80
Using the following regression analysis of the relationship between the size of cash bonuses and pay scale, find the correlation between average annual cash bonus and average annual pay?
A)-0.540
B)-0.223
C)0.108
D)0.472
E)Cannot be determined from the information given.
A)-0.540
B)-0.223
C)0.108
D)0.472
E)Cannot be determined from the information given.
فتح الحزمة
افتح القفل للوصول البطاقات البالغ عددها 207 في هذه المجموعة.
فتح الحزمة
k this deck
فتح الحزمة
افتح القفل للوصول البطاقات البالغ عددها 207 في هذه المجموعة.


