Deck 20: Time Series Analysis
ملء الشاشة (f)
سؤال
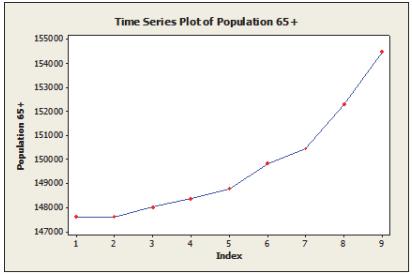
Annual estimates of the population in the age group 65 + in Alameda County, California from 1999 (t = 1) onward are shown in the time series graph below.The dominant component in the time series is ________________________
A)cyclicity
B)randomness
C)seasonality
D)trend
E)None of the above.
A)cyclicity
B)randomness
C)seasonality
D)trend
E)None of the above.
سؤال
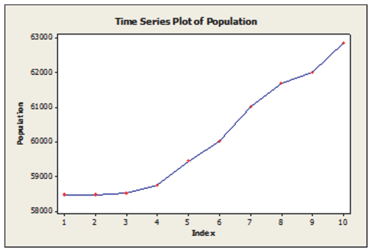
Annual estimates of the population in Kauai County, Hawaii from 1999 (t = 1) onward are shown in the time series graph below.The dominant component in this time series is ________________________ .
A)cyclicity
B)randomness
C)seasonality
D)trend
E)None of the above.
A)cyclicity
B)randomness
C)seasonality
D)trend
E)None of the above.
سؤال
The table below shows the actual closing daily stock prices for Kyocera Corporation for September 2 through September 5, 2008.Suppose the forecast for Sept.2 is 81.88.Using SES (single exponential smoothing) with a smoothing constant of 0.2 (α = 0.2), what is the forecast for Sept.3?

A)81.86
B)81.78
C)81.81
D)81.55
E)None of the above.
A)81.86
B)81.78
C)81.81
D)81.55
E)None of the above.
سؤال
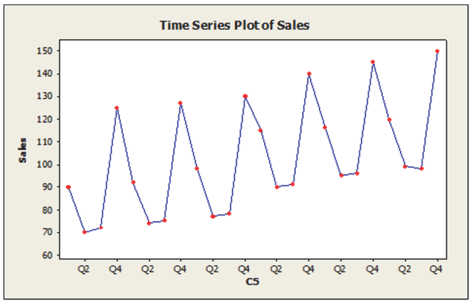
Quarterly sales data (in $10,000) for a small company specializing in green cleaning products are shown in the time series graph below.The forecasting method that would likely fit these data the best is ________________________
A)single exponential smoothing
B)linear trend
C)seasonal regression model
D)moving average
E)naive
A)single exponential smoothing
B)linear trend
C)seasonal regression model
D)moving average
E)naive
سؤال
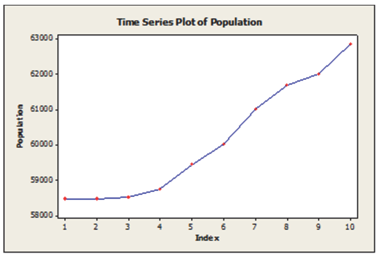
Annual estimates of the population in Kauai County, Hawaii from 1999 (t = 1) onward are shown in the graph below.The most appropriate forecasting method for this series is ________________________ .
A)single exponential smoothing
B)quadratic trend
C)moving average
D)naïve
E)linear trend
A)single exponential smoothing
B)quadratic trend
C)moving average
D)naïve
E)linear trend
سؤال
The table below shows the actual closing daily stock prices for Kyocera Corporation for September 2 through September 5, 2008, as well as 4-day moving average and naïve forecasts.The MAD for the Naïve method is 1.22.What is the MAD for the 4-period MA and how does it compare with the Naïve?

A)MAD (4-Period MA) is 1.59; the Naïve method is better.
B)MAD (4-Period MA) is 1.59; the Naïve method is worse.
C)MAD (4-Period MA) is 1.81; the Naïve method is better.
D)MAD (4-Period MA) is 1.01; the Naïve method is worse.
E)MAD (4-Period MA) is 2.87; the Naïve method is worse.
A)MAD (4-Period MA) is 1.59; the Naïve method is better.
B)MAD (4-Period MA) is 1.59; the Naïve method is worse.
C)MAD (4-Period MA) is 1.81; the Naïve method is better.
D)MAD (4-Period MA) is 1.01; the Naïve method is worse.
E)MAD (4-Period MA) is 2.87; the Naïve method is worse.
سؤال
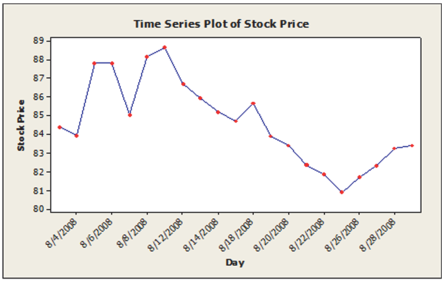
Daily closing stock prices for Kyocera Corporation were obtained from August 1, 2008 through August 29, 2008 and appear in the time series graph below.The dominant component in this time series is ________________________ .
A)trend
B)irregular
C)seasonality
D)systematic
E)None of the above.
A)trend
B)irregular
C)seasonality
D)systematic
E)None of the above.
سؤال
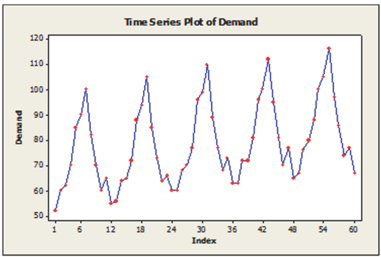
American Spinners, a large automobile parts supplier, keeps track of the demand for a particular part needed by its customers, automobile manufacturers.The time series plot below shows monthly demand for this part (in thousands) for a five year period.The dominant component in this time series is ________________________ .
A)cyclicity.
B)randomness.
C)seasonality.
D)systematic.
E)None of the above.
A)cyclicity.
B)randomness.
C)seasonality.
D)systematic.
E)None of the above.
سؤال
The table below shows the actual closing daily stock prices for Kyocera Corporation for September 2 through September 4, 2008.What is the 2-day moving average forecast for September 5?

A)80.96
B)79.94
C)82.87
D)80.12
E)81.99
A)80.96
B)79.94
C)82.87
D)80.12
E)81.99
سؤال
The following table shows actual sales values and forecasts.The MSE for the forecasting method used is ________________________ .

A)7.111
B)9.187
C)82.656
D)113.899
E)None of the above.
A)7.111
B)9.187
C)82.656
D)113.899
E)None of the above.
سؤال
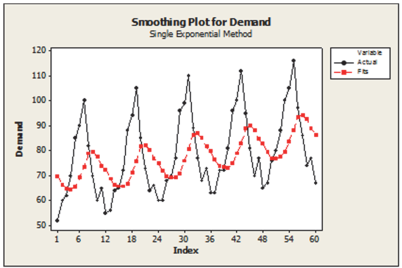
Suppose that the single exponential smoothing (SES) model was applied to data measuring demand for a particular part needed by customer with results as shown below.The likely value used for α is ________________________
A)1.0
B)0.9
C)0.8
D)0.5
E)0.2
A)1.0
B)0.9
C)0.8
D)0.5
E)0.2
سؤال
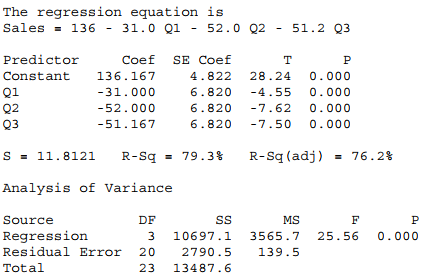
A seasonal regression model was fit to quarterly sales data (in $10,000) for a small company specializing in green cleaning products.The results are shown below.The regression coefficients in the seasonal regression model indicate that sales are on average ________________________ .
A)lower in the first, second and third quarters compared with the fourth quarter
B)lowest in the fourth quarter
C)higher in the first, second and third quarters compared with the fourth quarter
D)lowest in the first quarter
E)None of the above.
A)lower in the first, second and third quarters compared with the fourth quarter
B)lowest in the fourth quarter
C)higher in the first, second and third quarters compared with the fourth quarter
D)lowest in the first quarter
E)None of the above.
سؤال
سؤال
A seasonal regression model was fit to quarterly sales data (in $10,000) for a small company specializing in green cleaning products.The results are shown below.What is the forecast (in $10,000) for the second quarter of the next year?
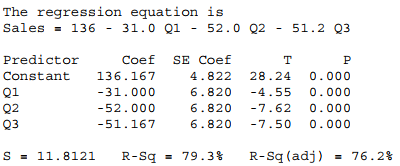
A)105
B)84
C)52
D)136
E)31
A)105
B)84
C)52
D)136
E)31
سؤال
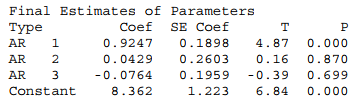
A third-order autoregressive model, AR (3) was fit to monthly closing stock prices, adjusted for dividends, of Boeing Corporation from January 2006 through August 2008 (closing price on the first trading day of the month).Based on the results shown below, the estimated model is ________________________ .
A)Price (t) = 1.223 + .1898 Price (t-1) + .2603 Price (t-2) + 1959 Price (t-3)
B)Price (t) = 8.362 - .0764 Price (t-1) + .0429 Price (t-2) + .9247 Price (t-3)
C)Price (t) = 1.223 + .1959 Price (t-1) + .2603 Price (t-2) + .1898 Price (t-3)
D)Price (t) = 8.362 + .9247 Price (t-1) + .0429 Price (t-2) - .0764 Price (t-3)
E)None of the above.
سؤال
The following table shows actual sales values and forecasts.The MAD for the forecasting method used is ________________________ .

A)7.111
B)9.187
C)82.656
D)113.899
E)None of the above.
A)7.111
B)9.187
C)82.656
D)113.899
E)None of the above.
سؤال
A first-order autoregressive model, AR (3) was fit to monthly closing stock prices, adjusted for dividends, of Boeing Corporation from January 2006 through August 2008 (closing price on the first trading day of the month).Based on the results shown below, the estimated model is ________________________ .
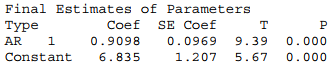
A)Price (t) = 6.835 + .9098 Price (t-1)
B)Price (t) = 0.0969 + 1.207 Price (t-1)
C)Price (t) = 1.207 + 0.0969 Price (t-1)
D)Price (t) = 6.835 + 1.207 Price (t-1)
E)Price (t) = 6.835 - 0.9098 Price (t-1)
A)Price (t) = 6.835 + .9098 Price (t-1)
B)Price (t) = 0.0969 + 1.207 Price (t-1)
C)Price (t) = 1.207 + 0.0969 Price (t-1)
D)Price (t) = 6.835 + 1.207 Price (t-1)
E)Price (t) = 6.835 - 0.9098 Price (t-1)
سؤال

فتح الحزمة
قم بالتسجيل لفتح البطاقات في هذه المجموعة!
Unlock Deck
Unlock Deck
1/18
العب
ملء الشاشة (f)
Deck 20: Time Series Analysis
1
Annual estimates of the population in the age group 65 + in Alameda County, California from 1999 (t = 1) onward are shown in the time series graph below.The dominant component in the time series is ________________________
A)cyclicity
B)randomness
C)seasonality
D)trend
E)None of the above.
A)cyclicity
B)randomness
C)seasonality
D)trend
E)None of the above.
trend
2
Annual estimates of the population in Kauai County, Hawaii from 1999 (t = 1) onward are shown in the time series graph below.The dominant component in this time series is ________________________ .
A)cyclicity
B)randomness
C)seasonality
D)trend
E)None of the above.
A)cyclicity
B)randomness
C)seasonality
D)trend
E)None of the above.
trend
3
The table below shows the actual closing daily stock prices for Kyocera Corporation for September 2 through September 5, 2008.Suppose the forecast for Sept.2 is 81.88.Using SES (single exponential smoothing) with a smoothing constant of 0.2 (α = 0.2), what is the forecast for Sept.3?
A)81.86
B)81.78
C)81.81
D)81.55
E)None of the above.
A)81.86
B)81.78
C)81.81
D)81.55
E)None of the above.
81.78
4
Quarterly sales data (in $10,000) for a small company specializing in green cleaning products are shown in the time series graph below.The forecasting method that would likely fit these data the best is ________________________
A)single exponential smoothing
B)linear trend
C)seasonal regression model
D)moving average
E)naive
A)single exponential smoothing
B)linear trend
C)seasonal regression model
D)moving average
E)naive
فتح الحزمة
افتح القفل للوصول البطاقات البالغ عددها 18 في هذه المجموعة.
فتح الحزمة
k this deck
5
Annual estimates of the population in Kauai County, Hawaii from 1999 (t = 1) onward are shown in the graph below.The most appropriate forecasting method for this series is ________________________ .
A)single exponential smoothing
B)quadratic trend
C)moving average
D)naïve
E)linear trend
A)single exponential smoothing
B)quadratic trend
C)moving average
D)naïve
E)linear trend
فتح الحزمة
افتح القفل للوصول البطاقات البالغ عددها 18 في هذه المجموعة.
فتح الحزمة
k this deck
6
The table below shows the actual closing daily stock prices for Kyocera Corporation for September 2 through September 5, 2008, as well as 4-day moving average and naïve forecasts.The MAD for the Naïve method is 1.22.What is the MAD for the 4-period MA and how does it compare with the Naïve?
A)MAD (4-Period MA) is 1.59; the Naïve method is better.
B)MAD (4-Period MA) is 1.59; the Naïve method is worse.
C)MAD (4-Period MA) is 1.81; the Naïve method is better.
D)MAD (4-Period MA) is 1.01; the Naïve method is worse.
E)MAD (4-Period MA) is 2.87; the Naïve method is worse.
A)MAD (4-Period MA) is 1.59; the Naïve method is better.
B)MAD (4-Period MA) is 1.59; the Naïve method is worse.
C)MAD (4-Period MA) is 1.81; the Naïve method is better.
D)MAD (4-Period MA) is 1.01; the Naïve method is worse.
E)MAD (4-Period MA) is 2.87; the Naïve method is worse.
فتح الحزمة
افتح القفل للوصول البطاقات البالغ عددها 18 في هذه المجموعة.
فتح الحزمة
k this deck
7
Daily closing stock prices for Kyocera Corporation were obtained from August 1, 2008 through August 29, 2008 and appear in the time series graph below.The dominant component in this time series is ________________________ .
A)trend
B)irregular
C)seasonality
D)systematic
E)None of the above.
A)trend
B)irregular
C)seasonality
D)systematic
E)None of the above.
فتح الحزمة
افتح القفل للوصول البطاقات البالغ عددها 18 في هذه المجموعة.
فتح الحزمة
k this deck
8
American Spinners, a large automobile parts supplier, keeps track of the demand for a particular part needed by its customers, automobile manufacturers.The time series plot below shows monthly demand for this part (in thousands) for a five year period.The dominant component in this time series is ________________________ .
A)cyclicity.
B)randomness.
C)seasonality.
D)systematic.
E)None of the above.
A)cyclicity.
B)randomness.
C)seasonality.
D)systematic.
E)None of the above.
فتح الحزمة
افتح القفل للوصول البطاقات البالغ عددها 18 في هذه المجموعة.
فتح الحزمة
k this deck
9
The table below shows the actual closing daily stock prices for Kyocera Corporation for September 2 through September 4, 2008.What is the 2-day moving average forecast for September 5?
A)80.96
B)79.94
C)82.87
D)80.12
E)81.99
A)80.96
B)79.94
C)82.87
D)80.12
E)81.99
فتح الحزمة
افتح القفل للوصول البطاقات البالغ عددها 18 في هذه المجموعة.
فتح الحزمة
k this deck
10
The following table shows actual sales values and forecasts.The MSE for the forecasting method used is ________________________ .
A)7.111
B)9.187
C)82.656
D)113.899
E)None of the above.
A)7.111
B)9.187
C)82.656
D)113.899
E)None of the above.
فتح الحزمة
افتح القفل للوصول البطاقات البالغ عددها 18 في هذه المجموعة.
فتح الحزمة
k this deck
11
Suppose that the single exponential smoothing (SES) model was applied to data measuring demand for a particular part needed by customer with results as shown below.The likely value used for α is ________________________
A)1.0
B)0.9
C)0.8
D)0.5
E)0.2
A)1.0
B)0.9
C)0.8
D)0.5
E)0.2
فتح الحزمة
افتح القفل للوصول البطاقات البالغ عددها 18 في هذه المجموعة.
فتح الحزمة
k this deck
12
A seasonal regression model was fit to quarterly sales data (in $10,000) for a small company specializing in green cleaning products.The results are shown below.The regression coefficients in the seasonal regression model indicate that sales are on average ________________________ .
A)lower in the first, second and third quarters compared with the fourth quarter
B)lowest in the fourth quarter
C)higher in the first, second and third quarters compared with the fourth quarter
D)lowest in the first quarter
E)None of the above.
A)lower in the first, second and third quarters compared with the fourth quarter
B)lowest in the fourth quarter
C)higher in the first, second and third quarters compared with the fourth quarter
D)lowest in the first quarter
E)None of the above.
فتح الحزمة
افتح القفل للوصول البطاقات البالغ عددها 18 في هذه المجموعة.
فتح الحزمة
k this deck
13
A quadratic trend model was fit to data on annual estimates of the population in the age group 65 + in Alameda County, California from 1999 (t = 1) onward.The results are shown below.Using this model, the estimate of population in the 65+ age group in Alameda County for 2008 (t = 10) is ________________________ .
Fitted Trend Equation: Yt = 148187 - 554*t + 135.5*t**2
A)153,713
B)148,187
C)161,737
D)156,197
E)167,277
Fitted Trend Equation: Yt = 148187 - 554*t + 135.5*t**2
A)153,713
B)148,187
C)161,737
D)156,197
E)167,277
فتح الحزمة
افتح القفل للوصول البطاقات البالغ عددها 18 في هذه المجموعة.
فتح الحزمة
k this deck
14
A seasonal regression model was fit to quarterly sales data (in $10,000) for a small company specializing in green cleaning products.The results are shown below.What is the forecast (in $10,000) for the second quarter of the next year?
A)105
B)84
C)52
D)136
E)31
A)105
B)84
C)52
D)136
E)31
فتح الحزمة
افتح القفل للوصول البطاقات البالغ عددها 18 في هذه المجموعة.
فتح الحزمة
k this deck
15
A third-order autoregressive model, AR (3) was fit to monthly closing stock prices, adjusted for dividends, of Boeing Corporation from January 2006 through August 2008 (closing price on the first trading day of the month).Based on the results shown below, the estimated model is ________________________ .
A)Price (t) = 1.223 + .1898 Price (t-1) + .2603 Price (t-2) + 1959 Price (t-3)
B)Price (t) = 8.362 - .0764 Price (t-1) + .0429 Price (t-2) + .9247 Price (t-3)
C)Price (t) = 1.223 + .1959 Price (t-1) + .2603 Price (t-2) + .1898 Price (t-3)
D)Price (t) = 8.362 + .9247 Price (t-1) + .0429 Price (t-2) - .0764 Price (t-3)
E)None of the above.
A)Price (t) = 1.223 + .1898 Price (t-1) + .2603 Price (t-2) + 1959 Price (t-3)
B)Price (t) = 8.362 - .0764 Price (t-1) + .0429 Price (t-2) + .9247 Price (t-3)
C)Price (t) = 1.223 + .1959 Price (t-1) + .2603 Price (t-2) + .1898 Price (t-3)
D)Price (t) = 8.362 + .9247 Price (t-1) + .0429 Price (t-2) - .0764 Price (t-3)
E)None of the above.
فتح الحزمة
افتح القفل للوصول البطاقات البالغ عددها 18 في هذه المجموعة.
فتح الحزمة
k this deck
16
The following table shows actual sales values and forecasts.The MAD for the forecasting method used is ________________________ .
A)7.111
B)9.187
C)82.656
D)113.899
E)None of the above.
A)7.111
B)9.187
C)82.656
D)113.899
E)None of the above.
فتح الحزمة
افتح القفل للوصول البطاقات البالغ عددها 18 في هذه المجموعة.
فتح الحزمة
k this deck
17
A first-order autoregressive model, AR (3) was fit to monthly closing stock prices, adjusted for dividends, of Boeing Corporation from January 2006 through August 2008 (closing price on the first trading day of the month).Based on the results shown below, the estimated model is ________________________ .
A)Price (t) = 6.835 + .9098 Price (t-1)
B)Price (t) = 0.0969 + 1.207 Price (t-1)
C)Price (t) = 1.207 + 0.0969 Price (t-1)
D)Price (t) = 6.835 + 1.207 Price (t-1)
E)Price (t) = 6.835 - 0.9098 Price (t-1)
A)Price (t) = 6.835 + .9098 Price (t-1)
B)Price (t) = 0.0969 + 1.207 Price (t-1)
C)Price (t) = 1.207 + 0.0969 Price (t-1)
D)Price (t) = 6.835 + 1.207 Price (t-1)
E)Price (t) = 6.835 - 0.9098 Price (t-1)
فتح الحزمة
افتح القفل للوصول البطاقات البالغ عددها 18 في هذه المجموعة.
فتح الحزمة
k this deck
18
Annual estimates of the population in the age group 65 + in Alameda County, California from 1999 (t = 1) onward are used to estimate the following quadratic trend model: Yt = 148187 - 554*t + 135.5*t**2.Using this model, the estimate for 2008 is ________________________ .
A)157,218
B)156,197
C)153,713
D)161,312
E)None of the above.
A)157,218
B)156,197
C)153,713
D)161,312
E)None of the above.
فتح الحزمة
افتح القفل للوصول البطاقات البالغ عددها 18 في هذه المجموعة.
فتح الحزمة
k this deck
فتح الحزمة
افتح القفل للوصول البطاقات البالغ عددها 18 في هذه المجموعة.


