Deck 11: Chi-Square and Analysis of Variance
ملء الشاشة (f)
سؤال
سؤال
سؤال
Use a 0.01 significance level to test the claim that the proportion of men who plan to vote in
the next election is the same as the proportion of women who plan to vote. 300 men and 300
women were randomly selected and asked whether they planned to vote in the next election.
The results are shown below.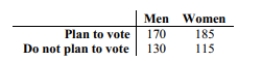
the next election is the same as the proportion of women who plan to vote. 300 men and 300
women were randomly selected and asked whether they planned to vote in the next election.
The results are shown below.
سؤال
Use a  test to test the claim that in the given contingency table, the row variable and the_
column variable are independent. 160 students who were majoring in either math or English
were asked a test question, and the researcher recorded whether they answered the question
correctly. The sample results are given below. At the 0.10 significance level, test the claim that
response and major are independent.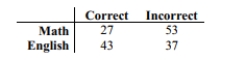
test to test the claim that in the given contingency table, the row variable and the_column variable are independent. 160 students who were majoring in either math or English
were asked a test question, and the researcher recorded whether they answered the question
correctly. The sample results are given below. At the 0.10 significance level, test the claim that
response and major are independent.
سؤال
Perform the indicated goodness-of-fit test. A company manager wishes to test a union leader's_
claim that absences occur on the
different week days with the same frequencies. Test this claim at the 0.05 level of
significance if the following sample data have been compiled.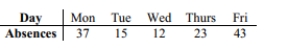
claim that absences occur on the
different week days with the same frequencies. Test this claim at the 0.05 level of
significance if the following sample data have been compiled.
سؤال
Perform the indicated goodness-of-fit test. You roll a die 48 times with the following results. 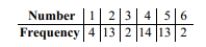 Use a significance level of 0.05 to test the claim that the die is fair.
Use a significance level of 0.05 to test the claim that the die is fair. سؤال
According to Benford's Law, a variety of different data sets include numbers with leading
(first)digits that follow the distribution shown in the table below. Test for goodness-of-fit
with Benford's Law.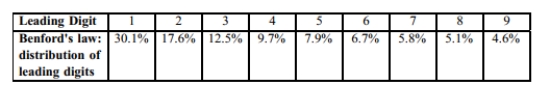 When working for the Brooklyn District Attorney, investigator Robert Burton analyzed the
leading digits of the amounts from 784 checks issued by seven suspect companies. The
frequencies were found to be 0, 18, 0, 79, 476, 180, 8, 23, and 0, and those digits correspond
to the leading digits of 1, 2, 3, 4, 5, 6, 7, 8, and 9, respectively. If the observed frequencies are
substantially different from the frequencies expected with Benford's Law, the check amounts
appear to result from fraud. Use a 0.05 significance level to test for goodness-of-fit with
Benford's Law. Does it appear that the checks are the result of fraud?
(first)digits that follow the distribution shown in the table below. Test for goodness-of-fit
with Benford's Law.
When working for the Brooklyn District Attorney, investigator Robert Burton analyzed theleading digits of the amounts from 784 checks issued by seven suspect companies. The
frequencies were found to be 0, 18, 0, 79, 476, 180, 8, 23, and 0, and those digits correspond
to the leading digits of 1, 2, 3, 4, 5, 6, 7, 8, and 9, respectively. If the observed frequencies are
substantially different from the frequencies expected with Benford's Law, the check amounts
appear to result from fraud. Use a 0.05 significance level to test for goodness-of-fit with
Benford's Law. Does it appear that the checks are the result of fraud?
سؤال
سؤال
Use the sample data below to test whether car color affects the likelihood of being in an_
accident. Use a significance level of 0.01.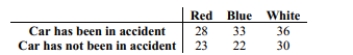
accident. Use a significance level of 0.01.
سؤال
Use a  test to test the claim that in the given contingency table, the row variable and the
column variable are independent. The table below shows the age and favorite type of music of
668 randomly selected people.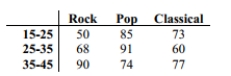 Use a 5 percent level of significance to test the null hypothesis that age and preferred
music type are independent.
test to test the claim that in the given contingency table, the row variable and thecolumn variable are independent. The table below shows the age and favorite type of music of
668 randomly selected people.
Use a 5 percent level of significance to test the null hypothesis that age and preferredmusic type are independent.
سؤال
Describe the null hypothesis for the test of independence. List the assumptions for the  test_
test_
of independence.
test_of independence.
سؤال
A survey of students at a college was asked if they lived at home with their parents, rented an
apartment, or owned their own home. The results are shown in the table below sorted by
gender. test the claim that living accommodations are independent of the gender
of the student.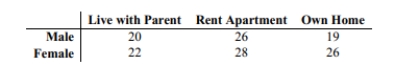
apartment, or owned their own home. The results are shown in the table below sorted by
gender.
test the claim that living accommodations are independent of the genderof the student.
سؤال
سؤال
A researcher wishes to test whether the proportion of college students who smoke is the_
same at four different colleges. She randomly selects 100 students from each college and
records the number that smoke. The results are shown below.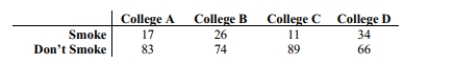 Use a 0.01 significance level to test the claim that the proportion of students smoking is the
same at all four colleges.
same at four different colleges. She randomly selects 100 students from each college and
records the number that smoke. The results are shown below.
Use a 0.01 significance level to test the claim that the proportion of students smoking is thesame at all four colleges.
سؤال
Use a  test to test the claim that in the given contingency table, the row variable and the
column variable are independent. Tests for adverse reactions to a new drug yielded the results
given in the table. At the 0.05 significance level, test the claim that the treatment (drug or
placebo)is independent of the reaction (whether or not headaches were experienced).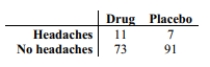
test to test the claim that in the given contingency table, the row variable and thecolumn variable are independent. Tests for adverse reactions to a new drug yielded the results
given in the table. At the 0.05 significance level, test the claim that the treatment (drug or
placebo)is independent of the reaction (whether or not headaches were experienced).
سؤال
سؤال
The following table shows the number of employees who called in sick at a business for_
different days of a particular week.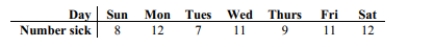 i)At the 0.05 level of significance, test the claim that sick days occur with equal frequency on
the different days of the week.
ii)Test the claim after changing the frequency for Saturday to 152. Describe the effect of this
outlier on the test.
different days of a particular week.
i)At the 0.05 level of significance, test the claim that sick days occur with equal frequency onthe different days of the week.
ii)Test the claim after changing the frequency for Saturday to 152. Describe the effect of this
outlier on the test.
سؤال
سؤال
سؤال
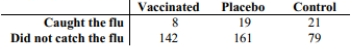
A researcher wishes to test the effectiveness of a flu vaccination. 150 people are vaccinated,
180 people are vaccinated with a placebo, and 100 people are not vaccinated. The number in
each group who later caught the flu was recorded. The results are shown below.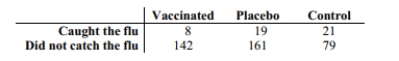 Use a 0.05 significance level to test the claim that the proportion of people catching the flu is
the same in all three groups.
180 people are vaccinated with a placebo, and 100 people are not vaccinated. The number in
each group who later caught the flu was recorded. The results are shown below.
Use a 0.05 significance level to test the claim that the proportion of people catching the flu isthe same in all three groups.
سؤال
A researcher wishes to test whether the proportion of college students who smoke is the same
in four different colleges. She randomly selects 100 students from each college and records
the number that smoke. The results are shown below.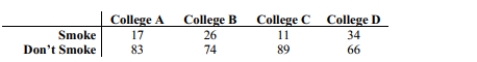 Use a 0.01 significance level to test the claim that the proportion of students smoking is the
same at all four colleges.
in four different colleges. She randomly selects 100 students from each college and records
the number that smoke. The results are shown below.
Use a 0.01 significance level to test the claim that the proportion of students smoking is thesame at all four colleges.
سؤال
A survey of students at a college was asked if they lived at home with their parents, rented an
apartment, or owned their own home. The results are shown in the table below sorted by
gender. At = 0.05, test the claim that living accommodations are independent of the
gender of the student.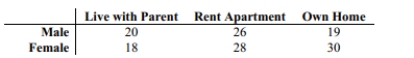
apartment, or owned their own home. The results are shown in the table below sorted by
gender. At
= 0.05, test the claim that living accommodations are independent of thegender of the student.
سؤال
سؤال
سؤال
Describe the null hypothesis for the test of independence. List the assumptions for the  test_
test_
of independence.
test_of independence.
سؤال
Use a  test to test the claim that in the given contingency table, the row variable and the
column variable are independent. The table below shows the age and favorite type of music of
668 randomly selected people.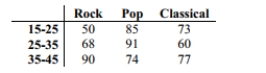 Use a 5 percent level of significance to test the null hypothesis that age and preferred
music type are independent.
test to test the claim that in the given contingency table, the row variable and thecolumn variable are independent. The table below shows the age and favorite type of music of
668 randomly selected people.
Use a 5 percent level of significance to test the null hypothesis that age and preferredmusic type are independent.
سؤال
سؤال
Perform the indicated goodness-of-fit test. You roll a die 48 times with the following results._ 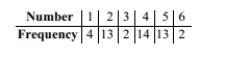 Use a significance level of 0.05 to test the claim that the die is fair.
Use a significance level of 0.05 to test the claim that the die is fair. سؤال
سؤال
In studying the responses to a multiple-choice test question, the following sample data were_
obtained. At the 0.05 significance level, test the claim that the responses occur with the same
frequency.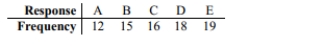
obtained. At the 0.05 significance level, test the claim that the responses occur with the same
frequency.
سؤال
سؤال
A researcher wishes to test the effectiveness of a flu vaccination. 150 people are vaccinated, 180 people are vaccinated with a placebo, and 100 people are not vaccinated. The number in each group who later caught the flu was recorded. The results are shown below.
سؤال
Using the data below and a 0.05 significance level, test the claim that the responses occur with_
percentages of 15%, 20%, 25%, 25%, and 15% respectively.
percentages of 15%, 20%, 25%, 25%, and 15% respectively.
سؤال
سؤال
According to Benford's Law, a variety of different data sets include numbers with leading (first)7)____________
digits that follow the distribution shown in the table below. Test for goodness-of-fit with
Benford's Law.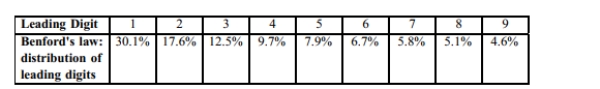 When working for the Brooklyn District Attorney, investigator Robert Burton analyzed the
leading digits of the amounts from 784 checks issued by seven suspect companies. The
frequencies were found to be 0, 18, 0, 79, 476, 180, 8, 23, and 0, and those digits correspond to
the leading digits of 1, 2, 3, 4, 5, 6, 7, 8, and 9, respectively. If the observed frequencies
are substantially different from the frequencies expected with Benford's Law, the check
amounts appear to result from fraud. Use a 0.05 significance level to test for
goodness-of-fit with Benford's Law. Does it appear that the checks are the result of fraud?
digits that follow the distribution shown in the table below. Test for goodness-of-fit with
Benford's Law.
When working for the Brooklyn District Attorney, investigator Robert Burton analyzed theleading digits of the amounts from 784 checks issued by seven suspect companies. The
frequencies were found to be 0, 18, 0, 79, 476, 180, 8, 23, and 0, and those digits correspond to
the leading digits of 1, 2, 3, 4, 5, 6, 7, 8, and 9, respectively. If the observed frequencies
are substantially different from the frequencies expected with Benford's Law, the check
amounts appear to result from fraud. Use a 0.05 significance level to test for
goodness-of-fit with Benford's Law. Does it appear that the checks are the result of fraud?
سؤال
Use a 0.01 significance level to test the claim that the proportion of men who plan to vote in
the next election is the same as the proportion of women who plan to vote. 300 men and 300
women were randomly selected and asked whether they planned to vote in the next election.
The results are shown below.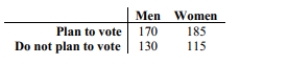
the next election is the same as the proportion of women who plan to vote. 300 men and 300
women were randomly selected and asked whether they planned to vote in the next election.
The results are shown below.
سؤال
سؤال
Use a  test to test the claim that in the given contingency table, the row variable and the
column variable are independent. 160 students who were majoring in either math or English
were asked a test question, and the researcher recorded whether they answered the question
correctly. The sample results are given below. At the 0.10 significance level, test the claim
that response and major are independent.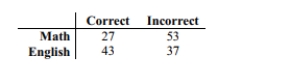
test to test the claim that in the given contingency table, the row variable and thecolumn variable are independent. 160 students who were majoring in either math or English
were asked a test question, and the researcher recorded whether they answered the question
correctly. The sample results are given below. At the 0.10 significance level, test the claim
that response and major are independent.
سؤال
سؤال
Use a  test to test the claim that in the given contingency table, the row variable and the
column variable are independent. Responses to a survey question are broken down according
to employment status and the sample results are given below. At the 0.10 significance level,
test the claim that response and employment status are independent.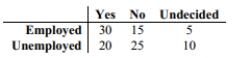
test to test the claim that in the given contingency table, the row variable and thecolumn variable are independent. Responses to a survey question are broken down according
to employment status and the sample results are given below. At the 0.10 significance level,
test the claim that response and employment status are independent.
سؤال
سؤال
In studying the occurrence of genetic characteristics, the following sample data were_ obtained. You would like to test the claim that the characteristics occur with the same
Frequency at the 0.05 significance level. What is value of the test statistic?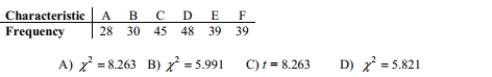
Frequency at the 0.05 significance level. What is value of the test statistic?
سؤال
سؤال
The following table represents the number of absences on various days of the week at an_ elementary school. 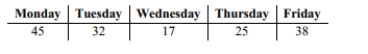 Identify the critical value for a goodness-of-fit test, assuming a 0.05 significance level.
A)χ2 = 5.991
B)χ2 = 7.815
C)χ2 = 9.488
D)χ2 = 11.071
Identify the critical value for a goodness-of-fit test, assuming a 0.05 significance level.A)χ2 = 5.991
B)χ2 = 7.815
C)χ2 = 9.488
D)χ2 = 11.071
سؤال
سؤال
سؤال
At a high school debate tournament, half of the teams were asked to wear suits and ties_ and the rest were asked to wear jeans and t-shirts. The results are given in the table below. In
Order to test the claim at the 0.05 level that the proportion of wins is the same for teams
Wearing suits as for teams wearing jeans, what would the null hypothesis be?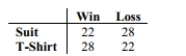
A)The proportions of wins is the same for teams wearing suits as for teams wearing jeans.
B)The proportions of wins is different for teams wearing suits as for teams wearing jeans.
C)The mean number of wins is the same for teams wearing suits as for teams wearing jeans.
D)The mean number of wins is the same for teams wearing suits as for teams wearing jeans.
سؤال
Responses to a survey question about color preference for a candy are broken down according to gender in the table given below. At the 0.05 significance level, test the claim that candy
Color preference and gender are independent.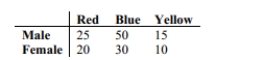 What is your conclusion about the null hypothesis and about the claim?
A)Fail to reject the null hypothesis. There is not sufficient evidence to warrant rejection of the claim that candy color preference and gender are independent.
B)Reject the null hypothesis. There is not sufficient evidence to warrant rejection of the claim that candy color preference and gender are independent.
C)Fail to reject the null hypothesis. There is sufficient evidence to warrant rejection of the claim that candy color preference and gender are independent.
D)Reject the null hypothesis. There is sufficient evidence to warrant rejection of the claim that candy color preference and gender are independent.
Color preference and gender are independent.
What is your conclusion about the null hypothesis and about the claim?A)Fail to reject the null hypothesis. There is not sufficient evidence to warrant rejection of the claim that candy color preference and gender are independent.
B)Reject the null hypothesis. There is not sufficient evidence to warrant rejection of the claim that candy color preference and gender are independent.
C)Fail to reject the null hypothesis. There is sufficient evidence to warrant rejection of the claim that candy color preference and gender are independent.
D)Reject the null hypothesis. There is sufficient evidence to warrant rejection of the claim that candy color preference and gender are independent.
سؤال
سؤال
سؤال
According to Benford's Law, a variety of different data sets include numbers with leading (first)1)____________ digits that follow the distribution shown in the table below. Test for goodness-of-fit with
Benford's Law.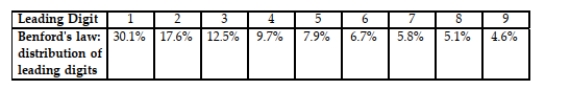 When working for the Brooklyn District Attorney, investigator Robert Burton analyzed the
Leading digits of the amounts from 784 checks issued by seven suspect companies. The
Frequencies were found to be 0, 12, 0, 73, 482, 186, 8, 23, and 0, and those digits correspond to the
Leading digits of 1, 2, 3, 4, 5, 6, 7, 8, and 9, respectively. If the observed frequenciesare
Substantially different from the frequencies expected with Benford's Law, the check
Amounts appear to result from fraud. Use a 0.05 significance level to test for
Goodness-of-fit with Benford's Law. What is the value of the test statistic? Does it appear that the
Checks are the result of fraud?
A)χ2 = 3711.409 It does appear that the checks are the result of fraud.
B)χ2 = 3711.409 It does not appear that the checks are the result of fraud.
C)χ2 = 15.507 It does appear that the checks are the result of fraud.
D)χ2 = 15.507 It does not appear that the checks are the result of fraud.
Benford's Law.
When working for the Brooklyn District Attorney, investigator Robert Burton analyzed theLeading digits of the amounts from 784 checks issued by seven suspect companies. The
Frequencies were found to be 0, 12, 0, 73, 482, 186, 8, 23, and 0, and those digits correspond to the
Leading digits of 1, 2, 3, 4, 5, 6, 7, 8, and 9, respectively. If the observed frequenciesare
Substantially different from the frequencies expected with Benford's Law, the check
Amounts appear to result from fraud. Use a 0.05 significance level to test for
Goodness-of-fit with Benford's Law. What is the value of the test statistic? Does it appear that the
Checks are the result of fraud?
A)χ2 = 3711.409 It does appear that the checks are the result of fraud.
B)χ2 = 3711.409 It does not appear that the checks are the result of fraud.
C)χ2 = 15.507 It does appear that the checks are the result of fraud.
D)χ2 = 15.507 It does not appear that the checks are the result of fraud.
سؤال
سؤال
سؤال
سؤال
The following table represents the number of absences on various days of the week at an_ elementary school. 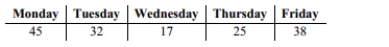 Identify the number of degrees of freedom for a goodness-of-fit test (for a uniform
Distribution), assuming a 0.05 significance level.
A)2
B)3
C)4
D)5
Identify the number of degrees of freedom for a goodness-of-fit test (for a uniformDistribution), assuming a 0.05 significance level.
A)2
B)3
C)4
D)5
سؤال
A survey conducted in a small business yielded the results shown in the table. 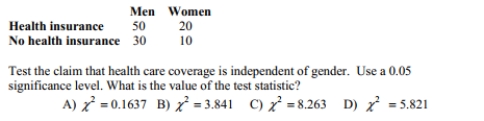
سؤال
A survey of students at a college was asked if they lived at home with their parents, rented an apartment, or owned their own home. The results are shown in the table below sorted by
Gender. At = 0.05, test the claim that living accommodations are independent of the gender
Of the student.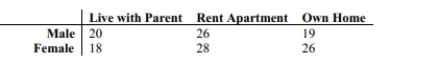
A)Reject the null hypothesis. There is sufficient evident to warrant rejection of the claim that living accommodation and gender are independent.
B)Reject the null hypothesis. There is not sufficient evident to warrant rejection of the claim that living accommodation and gender are independent.
C)Fail to reject the null hypothesis. There is sufficient evident to warrant rejection of the claim that living accommodation and gender are independent.
D)Fail to reject the null hypothesis. There is not sufficient evident to warrant rejection of the claim that living accommodation and gender are independent.
Gender. At
= 0.05, test the claim that living accommodations are independent of the genderOf the student.
A)Reject the null hypothesis. There is sufficient evident to warrant rejection of the claim that living accommodation and gender are independent.
B)Reject the null hypothesis. There is not sufficient evident to warrant rejection of the claim that living accommodation and gender are independent.
C)Fail to reject the null hypothesis. There is sufficient evident to warrant rejection of the claim that living accommodation and gender are independent.
D)Fail to reject the null hypothesis. There is not sufficient evident to warrant rejection of the claim that living accommodation and gender are independent.
سؤال
In studying the occurrence of genetic characteristics, the following sample data were_ obtained. You would like to test the claim that the characteristics occur with the same
Frequency at the 0.05 significance level.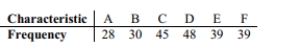 What is the expected value for D?
A)28
B)38
C)42
D)48
Frequency at the 0.05 significance level.
What is the expected value for D?A)28
B)38
C)42
D)48
سؤال
At a high school debate tournament, half of the teams were asked to wear suits and ties and the rest were asked to wear jeans and t-shirts. The results are given in the table below.
Test the claim at the 0.05 level that the proportion of wins is the same for teams wearing suits
As for teams wearing jeans.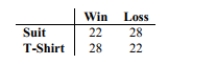 What is your conclusion about the null hypothesis?
A)Fail to reject the null hypothesis.
B)Reject the null hypothesis.
C)Fail to support the null hypothesis.
D)Support the null hypothesis.
Test the claim at the 0.05 level that the proportion of wins is the same for teams wearing suits
As for teams wearing jeans.
What is your conclusion about the null hypothesis?A)Fail to reject the null hypothesis.
B)Reject the null hypothesis.
C)Fail to support the null hypothesis.
D)Support the null hypothesis.
سؤال

فتح الحزمة
قم بالتسجيل لفتح البطاقات في هذه المجموعة!
Unlock Deck
Unlock Deck
1/60
العب
ملء الشاشة (f)
Deck 11: Chi-Square and Analysis of Variance
1
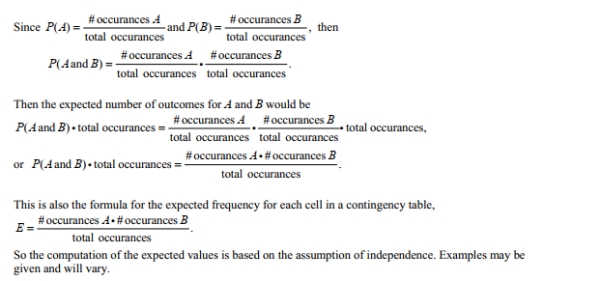
Explain the computation of expected values for contingency tables in terms of probabilities._
Refer to the assumptions of the null hypothesis as part of your explanation. You might give a
brief example to illustrate.
Refer to the assumptions of the null hypothesis as part of your explanation. You might give a
brief example to illustrate.
Suppose A and B are two categories in a contingency table. In probability computations, the P(A and B)would
be computed as PA( )· P(B), provided A and B are independent. The assumption of the null hypothesis is
that A and B are in fact independent, so we use the formula PA()and B= P(A)· P(B).
be computed as PA( )· P(B), provided A and B are independent. The assumption of the null hypothesis is
that A and B are in fact independent, so we use the formula PA()and B= P(A)· P(B).
2
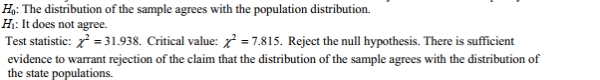
Among the four northwestern states, Washington has 51% of the total population, Oregon has
30%, Idaho has 11%, and Montana has 8%. A market researcher selects a sample of
1000 subjects, with 450 in Washington, 340 in Oregon, 150 in Idaho, and 60 in Montana. At
the 0.05 significance level, test the claim that the sample of 1000 subjects has a distribution
that agrees with the distribution of state populations.
3
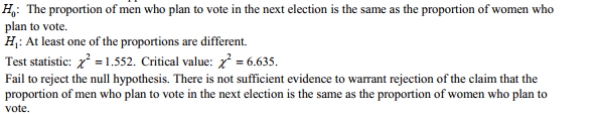
Use a 0.01 significance level to test the claim that the proportion of men who plan to vote in
the next election is the same as the proportion of women who plan to vote. 300 men and 300
women were randomly selected and asked whether they planned to vote in the next election.
The results are shown below.
the next election is the same as the proportion of women who plan to vote. 300 men and 300
women were randomly selected and asked whether they planned to vote in the next election.
The results are shown below.
4
Use a test to test the claim that in the given contingency table, the row variable and the_
column variable are independent. 160 students who were majoring in either math or English
were asked a test question, and the researcher recorded whether they answered the question
correctly. The sample results are given below. At the 0.10 significance level, test the claim that
response and major are independent.
test to test the claim that in the given contingency table, the row variable and the_column variable are independent. 160 students who were majoring in either math or English
were asked a test question, and the researcher recorded whether they answered the question
correctly. The sample results are given below. At the 0.10 significance level, test the claim that
response and major are independent.
فتح الحزمة
افتح القفل للوصول البطاقات البالغ عددها 60 في هذه المجموعة.
فتح الحزمة
k this deck
5
Perform the indicated goodness-of-fit test. A company manager wishes to test a union leader's_
claim that absences occur on the
different week days with the same frequencies. Test this claim at the 0.05 level of
significance if the following sample data have been compiled.
claim that absences occur on the
different week days with the same frequencies. Test this claim at the 0.05 level of
significance if the following sample data have been compiled.
فتح الحزمة
افتح القفل للوصول البطاقات البالغ عددها 60 في هذه المجموعة.
فتح الحزمة
k this deck
6
Perform the indicated goodness-of-fit test. You roll a die 48 times with the following results. Use a significance level of 0.05 to test the claim that the die is fair.
Use a significance level of 0.05 to test the claim that the die is fair. فتح الحزمة
افتح القفل للوصول البطاقات البالغ عددها 60 في هذه المجموعة.
فتح الحزمة
k this deck
7
According to Benford's Law, a variety of different data sets include numbers with leading
(first)digits that follow the distribution shown in the table below. Test for goodness-of-fit
with Benford's Law. When working for the Brooklyn District Attorney, investigator Robert Burton analyzed the
leading digits of the amounts from 784 checks issued by seven suspect companies. The
frequencies were found to be 0, 18, 0, 79, 476, 180, 8, 23, and 0, and those digits correspond
to the leading digits of 1, 2, 3, 4, 5, 6, 7, 8, and 9, respectively. If the observed frequencies are
substantially different from the frequencies expected with Benford's Law, the check amounts
appear to result from fraud. Use a 0.05 significance level to test for goodness-of-fit with
Benford's Law. Does it appear that the checks are the result of fraud?
(first)digits that follow the distribution shown in the table below. Test for goodness-of-fit
with Benford's Law.
When working for the Brooklyn District Attorney, investigator Robert Burton analyzed theleading digits of the amounts from 784 checks issued by seven suspect companies. The
frequencies were found to be 0, 18, 0, 79, 476, 180, 8, 23, and 0, and those digits correspond
to the leading digits of 1, 2, 3, 4, 5, 6, 7, 8, and 9, respectively. If the observed frequencies are
substantially different from the frequencies expected with Benford's Law, the check amounts
appear to result from fraud. Use a 0.05 significance level to test for goodness-of-fit with
Benford's Law. Does it appear that the checks are the result of fraud?
فتح الحزمة
افتح القفل للوصول البطاقات البالغ عددها 60 في هذه المجموعة.
فتح الحزمة
k this deck
8
The table in number 18 is called a two-way table. Why is the terminology of two-way table
used?
used?
فتح الحزمة
افتح القفل للوصول البطاقات البالغ عددها 60 في هذه المجموعة.
فتح الحزمة
k this deck
9
Use the sample data below to test whether car color affects the likelihood of being in an_
accident. Use a significance level of 0.01.
accident. Use a significance level of 0.01.
فتح الحزمة
افتح القفل للوصول البطاقات البالغ عددها 60 في هذه المجموعة.
فتح الحزمة
k this deck
10
Use a test to test the claim that in the given contingency table, the row variable and the
column variable are independent. The table below shows the age and favorite type of music of
668 randomly selected people. Use a 5 percent level of significance to test the null hypothesis that age and preferred
music type are independent.
test to test the claim that in the given contingency table, the row variable and thecolumn variable are independent. The table below shows the age and favorite type of music of
668 randomly selected people.
Use a 5 percent level of significance to test the null hypothesis that age and preferredmusic type are independent.
فتح الحزمة
افتح القفل للوصول البطاقات البالغ عددها 60 في هذه المجموعة.
فتح الحزمة
k this deck
11
Describe the null hypothesis for the test of independence. List the assumptions for the test_
of independence.
test_of independence.
فتح الحزمة
افتح القفل للوصول البطاقات البالغ عددها 60 في هذه المجموعة.
فتح الحزمة
k this deck
12
A survey of students at a college was asked if they lived at home with their parents, rented an
apartment, or owned their own home. The results are shown in the table below sorted by
gender. test the claim that living accommodations are independent of the gender
of the student.
apartment, or owned their own home. The results are shown in the table below sorted by
gender.
test the claim that living accommodations are independent of the genderof the student.
فتح الحزمة
افتح القفل للوصول البطاقات البالغ عددها 60 في هذه المجموعة.
فتح الحزمة
k this deck
13
Discuss the three characteristics of a chi-square distribution._
فتح الحزمة
افتح القفل للوصول البطاقات البالغ عددها 60 في هذه المجموعة.
فتح الحزمة
k this deck
14
A researcher wishes to test whether the proportion of college students who smoke is the_
same at four different colleges. She randomly selects 100 students from each college and
records the number that smoke. The results are shown below. Use a 0.01 significance level to test the claim that the proportion of students smoking is the
same at all four colleges.
same at four different colleges. She randomly selects 100 students from each college and
records the number that smoke. The results are shown below.
Use a 0.01 significance level to test the claim that the proportion of students smoking is thesame at all four colleges.
فتح الحزمة
افتح القفل للوصول البطاقات البالغ عددها 60 في هذه المجموعة.
فتح الحزمة
k this deck
15
Use a test to test the claim that in the given contingency table, the row variable and the
column variable are independent. Tests for adverse reactions to a new drug yielded the results
given in the table. At the 0.05 significance level, test the claim that the treatment (drug or
placebo)is independent of the reaction (whether or not headaches were experienced).
test to test the claim that in the given contingency table, the row variable and thecolumn variable are independent. Tests for adverse reactions to a new drug yielded the results
given in the table. At the 0.05 significance level, test the claim that the treatment (drug or
placebo)is independent of the reaction (whether or not headaches were experienced).
فتح الحزمة
افتح القفل للوصول البطاقات البالغ عددها 60 في هذه المجموعة.
فتح الحزمة
k this deck
16
Describe the test of homogeneity. What characteristic distinguishes a test of homogeneity from
a test of independence?
a test of independence?
فتح الحزمة
افتح القفل للوصول البطاقات البالغ عددها 60 في هذه المجموعة.
فتح الحزمة
k this deck
17
The following table shows the number of employees who called in sick at a business for_
different days of a particular week. i)At the 0.05 level of significance, test the claim that sick days occur with equal frequency on
the different days of the week.
ii)Test the claim after changing the frequency for Saturday to 152. Describe the effect of this
outlier on the test.
different days of a particular week.
i)At the 0.05 level of significance, test the claim that sick days occur with equal frequency onthe different days of the week.
ii)Test the claim after changing the frequency for Saturday to 152. Describe the effect of this
outlier on the test.
فتح الحزمة
افتح القفل للوصول البطاقات البالغ عددها 60 في هذه المجموعة.
فتح الحزمة
k this deck
18
Describe a goodness-of-fit test. What assumptions are made when using a goodness-of-fit test?_
فتح الحزمة
افتح القفل للوصول البطاقات البالغ عددها 60 في هذه المجموعة.
فتح الحزمة
k this deck
19
A table summarizes the success and failures when subjects used different methods (yoga,
acupuncture, and chiropractor)to relieve back pain. If we test the claim at a 5% level of
significance that success is independent of the method used, technology provides a P-value of
0.0355. What does the P-value tell us about the claim?
acupuncture, and chiropractor)to relieve back pain. If we test the claim at a 5% level of
significance that success is independent of the method used, technology provides a P-value of
0.0355. What does the P-value tell us about the claim?
فتح الحزمة
افتح القفل للوصول البطاقات البالغ عددها 60 في هذه المجموعة.
فتح الحزمة
k this deck
20
A researcher wishes to test the effectiveness of a flu vaccination. 150 people are vaccinated,
180 people are vaccinated with a placebo, and 100 people are not vaccinated. The number in
each group who later caught the flu was recorded. The results are shown below. Use a 0.05 significance level to test the claim that the proportion of people catching the flu is
the same in all three groups.
180 people are vaccinated with a placebo, and 100 people are not vaccinated. The number in
each group who later caught the flu was recorded. The results are shown below.
Use a 0.05 significance level to test the claim that the proportion of people catching the flu isthe same in all three groups.
فتح الحزمة
افتح القفل للوصول البطاقات البالغ عددها 60 في هذه المجموعة.
فتح الحزمة
k this deck
21
A researcher wishes to test whether the proportion of college students who smoke is the same
in four different colleges. She randomly selects 100 students from each college and records
the number that smoke. The results are shown below. Use a 0.01 significance level to test the claim that the proportion of students smoking is the
same at all four colleges.
in four different colleges. She randomly selects 100 students from each college and records
the number that smoke. The results are shown below.
Use a 0.01 significance level to test the claim that the proportion of students smoking is thesame at all four colleges.
فتح الحزمة
افتح القفل للوصول البطاقات البالغ عددها 60 في هذه المجموعة.
فتح الحزمة
k this deck
22
A survey of students at a college was asked if they lived at home with their parents, rented an
apartment, or owned their own home. The results are shown in the table below sorted by
gender. At = 0.05, test the claim that living accommodations are independent of the
gender of the student.
apartment, or owned their own home. The results are shown in the table below sorted by
gender. At
= 0.05, test the claim that living accommodations are independent of thegender of the student.
فتح الحزمة
افتح القفل للوصول البطاقات البالغ عددها 60 في هذه المجموعة.
فتح الحزمة
k this deck
23
Discuss the three characteristics of a chi-square distribution.
فتح الحزمة
افتح القفل للوصول البطاقات البالغ عددها 60 في هذه المجموعة.
فتح الحزمة
k this deck
24
Define categorical data and give an example.
فتح الحزمة
افتح القفل للوصول البطاقات البالغ عددها 60 في هذه المجموعة.
فتح الحزمة
k this deck
25
Describe the null hypothesis for the test of independence. List the assumptions for the test_
of independence.
test_of independence.
فتح الحزمة
افتح القفل للوصول البطاقات البالغ عددها 60 في هذه المجموعة.
فتح الحزمة
k this deck
26
Use a test to test the claim that in the given contingency table, the row variable and the
column variable are independent. The table below shows the age and favorite type of music of
668 randomly selected people. Use a 5 percent level of significance to test the null hypothesis that age and preferred
music type are independent.
test to test the claim that in the given contingency table, the row variable and thecolumn variable are independent. The table below shows the age and favorite type of music of
668 randomly selected people.
Use a 5 percent level of significance to test the null hypothesis that age and preferredmusic type are independent.
فتح الحزمة
افتح القفل للوصول البطاقات البالغ عددها 60 في هذه المجموعة.
فتح الحزمة
k this deck
27
The table in number 18 is called a two-way table. Why is the terminology of two-way table
used?
used?
فتح الحزمة
افتح القفل للوصول البطاقات البالغ عددها 60 في هذه المجموعة.
فتح الحزمة
k this deck
28
Perform the indicated goodness-of-fit test. You roll a die 48 times with the following results._ Use a significance level of 0.05 to test the claim that the die is fair.
Use a significance level of 0.05 to test the claim that the die is fair. فتح الحزمة
افتح القفل للوصول البطاقات البالغ عددها 60 في هذه المجموعة.
فتح الحزمة
k this deck
29
Perform the indicated goodness-of-fit test. Among the four northwestern states, Washington has_
51% of the total population, Oregon has 30%, Idaho has 11%, and Montana has 8%. A market
researcher selects a sample of 1000 subjects, with 450 in Washington, 340 in Oregon, 150 in
Idaho, and 60 in Montana. At the 0.05 significance level, test the claim that the sample of 1000
subjects has a distribution that agrees with the distribution of state populations.
فتح الحزمة
افتح القفل للوصول البطاقات البالغ عددها 60 في هذه المجموعة.
فتح الحزمة
k this deck
30
In studying the responses to a multiple-choice test question, the following sample data were_
obtained. At the 0.05 significance level, test the claim that the responses occur with the same
frequency.
obtained. At the 0.05 significance level, test the claim that the responses occur with the same
frequency.
فتح الحزمة
افتح القفل للوصول البطاقات البالغ عددها 60 في هذه المجموعة.
فتح الحزمة
k this deck
31
Describe a goodness-of-fit test. What assumptions are made when using a goodness-of-fit test?_
فتح الحزمة
افتح القفل للوصول البطاقات البالغ عددها 60 في هذه المجموعة.
فتح الحزمة
k this deck
32
A researcher wishes to test the effectiveness of a flu vaccination. 150 people are vaccinated, 180 people are vaccinated with a placebo, and 100 people are not vaccinated. The number in each group who later caught the flu was recorded. The results are shown below.
فتح الحزمة
افتح القفل للوصول البطاقات البالغ عددها 60 في هذه المجموعة.
فتح الحزمة
k this deck
33
Using the data below and a 0.05 significance level, test the claim that the responses occur with_
percentages of 15%, 20%, 25%, 25%, and 15% respectively.
percentages of 15%, 20%, 25%, 25%, and 15% respectively.
فتح الحزمة
افتح القفل للوصول البطاقات البالغ عددها 60 في هذه المجموعة.
فتح الحزمة
k this deck
34
Describe the test of homogeneity. What characteristic distinguishes a test of homogeneity from_
a test of independence?
a test of independence?
فتح الحزمة
افتح القفل للوصول البطاقات البالغ عددها 60 في هذه المجموعة.
فتح الحزمة
k this deck
35
According to Benford's Law, a variety of different data sets include numbers with leading (first)7)____________
digits that follow the distribution shown in the table below. Test for goodness-of-fit with
Benford's Law. When working for the Brooklyn District Attorney, investigator Robert Burton analyzed the
leading digits of the amounts from 784 checks issued by seven suspect companies. The
frequencies were found to be 0, 18, 0, 79, 476, 180, 8, 23, and 0, and those digits correspond to
the leading digits of 1, 2, 3, 4, 5, 6, 7, 8, and 9, respectively. If the observed frequencies
are substantially different from the frequencies expected with Benford's Law, the check
amounts appear to result from fraud. Use a 0.05 significance level to test for
goodness-of-fit with Benford's Law. Does it appear that the checks are the result of fraud?
digits that follow the distribution shown in the table below. Test for goodness-of-fit with
Benford's Law.
When working for the Brooklyn District Attorney, investigator Robert Burton analyzed theleading digits of the amounts from 784 checks issued by seven suspect companies. The
frequencies were found to be 0, 18, 0, 79, 476, 180, 8, 23, and 0, and those digits correspond to
the leading digits of 1, 2, 3, 4, 5, 6, 7, 8, and 9, respectively. If the observed frequencies
are substantially different from the frequencies expected with Benford's Law, the check
amounts appear to result from fraud. Use a 0.05 significance level to test for
goodness-of-fit with Benford's Law. Does it appear that the checks are the result of fraud?
فتح الحزمة
افتح القفل للوصول البطاقات البالغ عددها 60 في هذه المجموعة.
فتح الحزمة
k this deck
36
Use a 0.01 significance level to test the claim that the proportion of men who plan to vote in
the next election is the same as the proportion of women who plan to vote. 300 men and 300
women were randomly selected and asked whether they planned to vote in the next election.
The results are shown below.
the next election is the same as the proportion of women who plan to vote. 300 men and 300
women were randomly selected and asked whether they planned to vote in the next election.
The results are shown below.
فتح الحزمة
افتح القفل للوصول البطاقات البالغ عددها 60 في هذه المجموعة.
فتح الحزمة
k this deck
37
A table summarizes the success and failures when subjects used different methods (yoga,
acupuncture, and chiropractor)to relieve back pain. If we test the claim at a 5% level of
significance that success is independent of the method used, technology provides a P-value
of 0.0655. What does the P-value tell us about the claim?
acupuncture, and chiropractor)to relieve back pain. If we test the claim at a 5% level of
significance that success is independent of the method used, technology provides a P-value
of 0.0655. What does the P-value tell us about the claim?
فتح الحزمة
افتح القفل للوصول البطاقات البالغ عددها 60 في هذه المجموعة.
فتح الحزمة
k this deck
38
Use a test to test the claim that in the given contingency table, the row variable and the
column variable are independent. 160 students who were majoring in either math or English
were asked a test question, and the researcher recorded whether they answered the question
correctly. The sample results are given below. At the 0.10 significance level, test the claim
that response and major are independent.
test to test the claim that in the given contingency table, the row variable and thecolumn variable are independent. 160 students who were majoring in either math or English
were asked a test question, and the researcher recorded whether they answered the question
correctly. The sample results are given below. At the 0.10 significance level, test the claim
that response and major are independent.
فتح الحزمة
افتح القفل للوصول البطاقات البالغ عددها 60 في هذه المجموعة.
فتح الحزمة
k this deck
39
Explain the computation of expected values for contingency tables in terms of probabilities._
Refer to the assumptions of the null hypothesis as part of your explanation. You might give a
brief example to illustrate.
Refer to the assumptions of the null hypothesis as part of your explanation. You might give a
brief example to illustrate.
فتح الحزمة
افتح القفل للوصول البطاقات البالغ عددها 60 في هذه المجموعة.
فتح الحزمة
k this deck
40
Use a test to test the claim that in the given contingency table, the row variable and the
column variable are independent. Responses to a survey question are broken down according
to employment status and the sample results are given below. At the 0.10 significance level,
test the claim that response and employment status are independent.
test to test the claim that in the given contingency table, the row variable and thecolumn variable are independent. Responses to a survey question are broken down according
to employment status and the sample results are given below. At the 0.10 significance level,
test the claim that response and employment status are independent.
فتح الحزمة
افتح القفل للوصول البطاقات البالغ عددها 60 في هذه المجموعة.
فتح الحزمة
k this deck
41
Which statement is not true for goodness-of -fit tests?
A)Observed frequencies must be whole numbers.
B)Expected frequencies must be whole numbers.
C)The expected frequency is found assuming that the distribution is as claimed.
D)The observed frequency is found from sample data values.
A)Observed frequencies must be whole numbers.
B)Expected frequencies must be whole numbers.
C)The expected frequency is found assuming that the distribution is as claimed.
D)The observed frequency is found from sample data values.
فتح الحزمة
افتح القفل للوصول البطاقات البالغ عددها 60 في هذه المجموعة.
فتح الحزمة
k this deck
42
In studying the occurrence of genetic characteristics, the following sample data were_ obtained. You would like to test the claim that the characteristics occur with the same
Frequency at the 0.05 significance level. What is value of the test statistic?
Frequency at the 0.05 significance level. What is value of the test statistic?
فتح الحزمة
افتح القفل للوصول البطاقات البالغ عددها 60 في هذه المجموعة.
فتح الحزمة
k this deck
43
Goodness-of-fit hypothesis tests are always___________________._
A)Right-tailed
B)Left-tailed
C)Two-tailed
A)Right-tailed
B)Left-tailed
C)Two-tailed
فتح الحزمة
افتح القفل للوصول البطاقات البالغ عددها 60 في هذه المجموعة.
فتح الحزمة
k this deck
44
The following table represents the number of absences on various days of the week at an_ elementary school. Identify the critical value for a goodness-of-fit test, assuming a 0.05 significance level.
A)χ2 = 5.991
B)χ2 = 7.815
C)χ2 = 9.488
D)χ2 = 11.071
Identify the critical value for a goodness-of-fit test, assuming a 0.05 significance level.A)χ2 = 5.991
B)χ2 = 7.815
C)χ2 = 9.488
D)χ2 = 11.071
فتح الحزمة
افتح القفل للوصول البطاقات البالغ عددها 60 في هذه المجموعة.
فتح الحزمة
k this deck
45
True or False: For a test of independence, the population that the data has come from must be
normally distributed.
normally distributed.
فتح الحزمة
افتح القفل للوصول البطاقات البالغ عددها 60 في هذه المجموعة.
فتح الحزمة
k this deck
46
Select the null hypothesis for a test of independence.
A)The row and column variables are independent.
B)The row and column variables are dependent.
C)The row and column variables are normally distributed.
D)The row and column variables have equal means.
A)The row and column variables are independent.
B)The row and column variables are dependent.
C)The row and column variables are normally distributed.
D)The row and column variables have equal means.
فتح الحزمة
افتح القفل للوصول البطاقات البالغ عددها 60 في هذه المجموعة.
فتح الحزمة
k this deck
47
At a high school debate tournament, half of the teams were asked to wear suits and ties_ and the rest were asked to wear jeans and t-shirts. The results are given in the table below. In
Order to test the claim at the 0.05 level that the proportion of wins is the same for teams
Wearing suits as for teams wearing jeans, what would the null hypothesis be?
A)The proportions of wins is the same for teams wearing suits as for teams wearing jeans.
B)The proportions of wins is different for teams wearing suits as for teams wearing jeans.
C)The mean number of wins is the same for teams wearing suits as for teams wearing jeans.
D)The mean number of wins is the same for teams wearing suits as for teams wearing jeans.
Order to test the claim at the 0.05 level that the proportion of wins is the same for teams
Wearing suits as for teams wearing jeans, what would the null hypothesis be?
A)The proportions of wins is the same for teams wearing suits as for teams wearing jeans.
B)The proportions of wins is different for teams wearing suits as for teams wearing jeans.
C)The mean number of wins is the same for teams wearing suits as for teams wearing jeans.
D)The mean number of wins is the same for teams wearing suits as for teams wearing jeans.
فتح الحزمة
افتح القفل للوصول البطاقات البالغ عددها 60 في هذه المجموعة.
فتح الحزمة
k this deck
48
Responses to a survey question about color preference for a candy are broken down according to gender in the table given below. At the 0.05 significance level, test the claim that candy
Color preference and gender are independent. What is your conclusion about the null hypothesis and about the claim?
A)Fail to reject the null hypothesis. There is not sufficient evidence to warrant rejection of the claim that candy color preference and gender are independent.
B)Reject the null hypothesis. There is not sufficient evidence to warrant rejection of the claim that candy color preference and gender are independent.
C)Fail to reject the null hypothesis. There is sufficient evidence to warrant rejection of the claim that candy color preference and gender are independent.
D)Reject the null hypothesis. There is sufficient evidence to warrant rejection of the claim that candy color preference and gender are independent.
Color preference and gender are independent.
What is your conclusion about the null hypothesis and about the claim?A)Fail to reject the null hypothesis. There is not sufficient evidence to warrant rejection of the claim that candy color preference and gender are independent.
B)Reject the null hypothesis. There is not sufficient evidence to warrant rejection of the claim that candy color preference and gender are independent.
C)Fail to reject the null hypothesis. There is sufficient evidence to warrant rejection of the claim that candy color preference and gender are independent.
D)Reject the null hypothesis. There is sufficient evidence to warrant rejection of the claim that candy color preference and gender are independent.
فتح الحزمة
افتح القفل للوصول البطاقات البالغ عددها 60 في هذه المجموعة.
فتح الحزمة
k this deck
49
While conducting a goodness-of-fit test if the observed and expected values are close, you would expect which of the following:
A)Small χ2 value, large P-value
B)Small χ2 value, small P-value
C)Large χ2 value, large P-value
D)Large χ2 value, small P-value
A)Small χ2 value, large P-value
B)Small χ2 value, small P-value
C)Large χ2 value, large P-value
D)Large χ2 value, small P-value
فتح الحزمة
افتح القفل للوصول البطاقات البالغ عددها 60 في هذه المجموعة.
فتح الحزمة
k this deck
50
For a recent year, the following are the numbers of homicides that occurred each month in New_ York City: 38, 30, 46, 40, 46, 49, 47, 50, 50, 42, 37, 37. Use a 0.05 significance level to test the claim that homicides in New York City are equally likely for each of the 12 months. State your
Conclusion about the claim.
A)There is sufficient evidence to warrant rejection of the claim that homicides in New York
City are equally likely for each of the 12 months.
B)There is not sufficient evidence to warrant rejection of the claim that homicides in New
York City are equally likely for each of the 12 months.
C)There is sufficient evidence to support the claim that homicides in New York City are
Equally likely for each of the 12 months.
D)There is not sufficient evidence to support the claim that that homicides in New York
City are equally likely for each of the 12 months.
فتح الحزمة
افتح القفل للوصول البطاقات البالغ عددها 60 في هذه المجموعة.
فتح الحزمة
k this deck
51
According to Benford's Law, a variety of different data sets include numbers with leading (first)1)____________ digits that follow the distribution shown in the table below. Test for goodness-of-fit with
Benford's Law. When working for the Brooklyn District Attorney, investigator Robert Burton analyzed the
Leading digits of the amounts from 784 checks issued by seven suspect companies. The
Frequencies were found to be 0, 12, 0, 73, 482, 186, 8, 23, and 0, and those digits correspond to the
Leading digits of 1, 2, 3, 4, 5, 6, 7, 8, and 9, respectively. If the observed frequenciesare
Substantially different from the frequencies expected with Benford's Law, the check
Amounts appear to result from fraud. Use a 0.05 significance level to test for
Goodness-of-fit with Benford's Law. What is the value of the test statistic? Does it appear that the
Checks are the result of fraud?
A)χ2 = 3711.409 It does appear that the checks are the result of fraud.
B)χ2 = 3711.409 It does not appear that the checks are the result of fraud.
C)χ2 = 15.507 It does appear that the checks are the result of fraud.
D)χ2 = 15.507 It does not appear that the checks are the result of fraud.
Benford's Law.
When working for the Brooklyn District Attorney, investigator Robert Burton analyzed theLeading digits of the amounts from 784 checks issued by seven suspect companies. The
Frequencies were found to be 0, 12, 0, 73, 482, 186, 8, 23, and 0, and those digits correspond to the
Leading digits of 1, 2, 3, 4, 5, 6, 7, 8, and 9, respectively. If the observed frequenciesare
Substantially different from the frequencies expected with Benford's Law, the check
Amounts appear to result from fraud. Use a 0.05 significance level to test for
Goodness-of-fit with Benford's Law. What is the value of the test statistic? Does it appear that the
Checks are the result of fraud?
A)χ2 = 3711.409 It does appear that the checks are the result of fraud.
B)χ2 = 3711.409 It does not appear that the checks are the result of fraud.
C)χ2 = 15.507 It does appear that the checks are the result of fraud.
D)χ2 = 15.507 It does not appear that the checks are the result of fraud.
فتح الحزمة
افتح القفل للوصول البطاقات البالغ عددها 60 في هذه المجموعة.
فتح الحزمة
k this deck
52
In conducting a goodness-of-fit test, a requirement is that __________________________._
A)The observed frequency must be at least five for each category.
B)The expected frequency must be at least five for each category.
C)The observed frequency must be at least ten for each category.
D)The expected frequency must be at least ten for each category.
A)The observed frequency must be at least five for each category.
B)The expected frequency must be at least five for each category.
C)The observed frequency must be at least ten for each category.
D)The expected frequency must be at least ten for each category.
فتح الحزمة
افتح القفل للوصول البطاقات البالغ عددها 60 في هذه المجموعة.
فتح الحزمة
k this deck
53
The following are the hypotheses for a test of the claim that college graduation statue and cola preference are independent.
H₀: College graduation status and cola preference are independent.
H₁: College graduation status and cola preference are dependent.
If the test statistic: χ2 = 0.579 and the critical value is χ2 = 5.991, what is your conclusion
About the null hypothesis and about the claim?
A)Reject the null hypothesis. There is not sufficient evidence to warrant rejection of the claim that college graduation status and cola preference are independent.
B)Fail to reject the null hypothesis. There is not sufficient evidence to warrant rejection of the claim that college graduation status and cola preference are independent.
C)Reject the null hypothesis. There is sufficient evidence to warrant rejection of the claim that college graduation status and cola preference are independent.
D)Fail to reject the null hypothesis. There is sufficient evidence to warrant rejection of the claim that college graduation status and cola preference are independent.
فتح الحزمة
افتح القفل للوصول البطاقات البالغ عددها 60 في هذه المجموعة.
فتح الحزمة
k this deck
54
Which of the following is not a characteristic of a chi-square distribution?
A)The chi-square distribution is different for each number of degrees of freedom.
B)The values of a chi-square distribution cannot be negative.
C)As the number of degrees of freedom increases, the chi-square distribution approaches a normal distribution.
D)All of the other statements are characteristics of a chi-square distribution.
فتح الحزمة
افتح القفل للوصول البطاقات البالغ عددها 60 في هذه المجموعة.
فتح الحزمة
k this deck
55
The following table represents the number of absences on various days of the week at an_ elementary school. Identify the number of degrees of freedom for a goodness-of-fit test (for a uniform
Distribution), assuming a 0.05 significance level.
A)2
B)3
C)4
D)5
Identify the number of degrees of freedom for a goodness-of-fit test (for a uniformDistribution), assuming a 0.05 significance level.
A)2
B)3
C)4
D)5
فتح الحزمة
افتح القفل للوصول البطاقات البالغ عددها 60 في هذه المجموعة.
فتح الحزمة
k this deck
56
A survey conducted in a small business yielded the results shown in the table.
فتح الحزمة
افتح القفل للوصول البطاقات البالغ عددها 60 في هذه المجموعة.
فتح الحزمة
k this deck
57
A survey of students at a college was asked if they lived at home with their parents, rented an apartment, or owned their own home. The results are shown in the table below sorted by
Gender. At = 0.05, test the claim that living accommodations are independent of the gender
Of the student.
A)Reject the null hypothesis. There is sufficient evident to warrant rejection of the claim that living accommodation and gender are independent.
B)Reject the null hypothesis. There is not sufficient evident to warrant rejection of the claim that living accommodation and gender are independent.
C)Fail to reject the null hypothesis. There is sufficient evident to warrant rejection of the claim that living accommodation and gender are independent.
D)Fail to reject the null hypothesis. There is not sufficient evident to warrant rejection of the claim that living accommodation and gender are independent.
Gender. At
= 0.05, test the claim that living accommodations are independent of the genderOf the student.
A)Reject the null hypothesis. There is sufficient evident to warrant rejection of the claim that living accommodation and gender are independent.
B)Reject the null hypothesis. There is not sufficient evident to warrant rejection of the claim that living accommodation and gender are independent.
C)Fail to reject the null hypothesis. There is sufficient evident to warrant rejection of the claim that living accommodation and gender are independent.
D)Fail to reject the null hypothesis. There is not sufficient evident to warrant rejection of the claim that living accommodation and gender are independent.
فتح الحزمة
افتح القفل للوصول البطاقات البالغ عددها 60 في هذه المجموعة.
فتح الحزمة
k this deck
58
In studying the occurrence of genetic characteristics, the following sample data were_ obtained. You would like to test the claim that the characteristics occur with the same
Frequency at the 0.05 significance level. What is the expected value for D?
A)28
B)38
C)42
D)48
Frequency at the 0.05 significance level.
What is the expected value for D?A)28
B)38
C)42
D)48
فتح الحزمة
افتح القفل للوصول البطاقات البالغ عددها 60 في هذه المجموعة.
فتح الحزمة
k this deck
59
At a high school debate tournament, half of the teams were asked to wear suits and ties and the rest were asked to wear jeans and t-shirts. The results are given in the table below.
Test the claim at the 0.05 level that the proportion of wins is the same for teams wearing suits
As for teams wearing jeans. What is your conclusion about the null hypothesis?
A)Fail to reject the null hypothesis.
B)Reject the null hypothesis.
C)Fail to support the null hypothesis.
D)Support the null hypothesis.
Test the claim at the 0.05 level that the proportion of wins is the same for teams wearing suits
As for teams wearing jeans.
What is your conclusion about the null hypothesis?A)Fail to reject the null hypothesis.
B)Reject the null hypothesis.
C)Fail to support the null hypothesis.
D)Support the null hypothesis.
فتح الحزمة
افتح القفل للوصول البطاقات البالغ عددها 60 في هذه المجموعة.
فتح الحزمة
k this deck
60
A table summarizes the success and failures when subjects used different methods (yoga, acupuncture, and chiropractor)to relieve back pain. If we test the claim at a 5% level of
Significance that success is independent of the method used, technology provides a P-value
Of 0.0355. What does the P-value tell us about the claim?
A)Since the P-value of 0.0355 is greater than 0.05, we reject the null hypothesis of independence between the treatment and whether the subject stops experiencing back
Pain. This suggests that the choice of treatment does appear to make a difference.
B)Since the P-value of 0.0355 is lower than 0.05, we fail to the null hypothesis of independence between the treatment and whether the subject stops experiencing back
Pain. This suggests that the choice of treatment does not appear to make a difference.
C)Since the P-value of 0.0355 is lower than 0.05, we reject the null hypothesis of independence between the treatment and whether the subject stops experiencing back
Pain. This suggests that the choice of treatment does not appear to make a difference.
D)Since the P-value of 0.0355 is lower than 0.05, we reject the null hypothesis of independence between the treatment and whether the subject stops experiencing back
Pain. This suggests that the choice of treatment does appear to make a difference.
فتح الحزمة
افتح القفل للوصول البطاقات البالغ عددها 60 في هذه المجموعة.
فتح الحزمة
k this deck
فتح الحزمة
افتح القفل للوصول البطاقات البالغ عددها 60 في هذه المجموعة.


