Deck 10: Correlation and Regression
ملء الشاشة (f)
سؤال
Determine which plot shows the strongest linear correlation._ 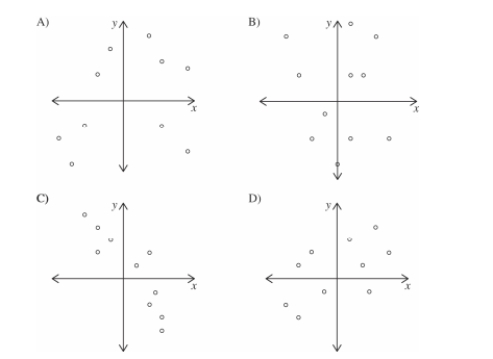
سؤال
Based on the scatterplot, select the most likely value of the linear correlation coefficient r. 
A)0
B)1
C)−1
D)−0.5
A)0
B)1
C)−1
D)−0.5
سؤال
Suppose you will perform a test to determine whether there is sufficient evidence to support a claim of a linear correlation between two variables. Find the critical values of r given the number of pairs of data n and the significance level https://d2lvgg3v3hfg70.cloudfront.net/TB34225555/ .
.
n=12 ,
A) r=0.708
B)
C)
D) r=0.735
.n=12 ,
A) r=0.708
B)
C)
D) r=0.735
سؤال
سؤال
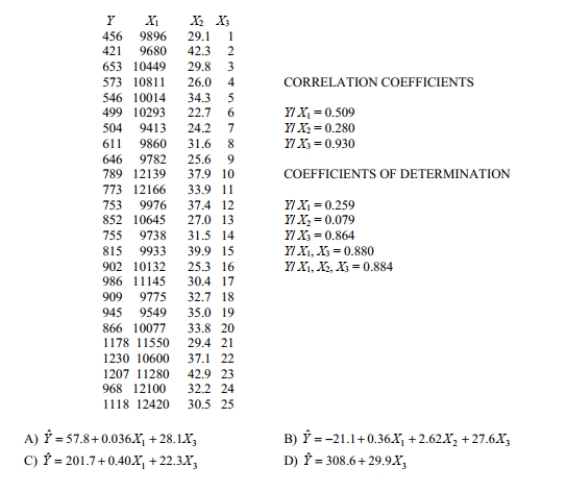
Use computer software to find the best multiple regression equation to explain the variation in the dependent variable, Y, in terms of the independent variables, 
سؤال
Use the given data to find the equation of the regression line. Round the final values to three significant digits, if necessary. Two different tests are designed to measure employee
Productivity and dexterity. Several employees are randomly selected and tested with these
Results.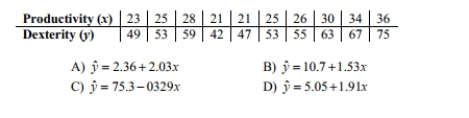
Productivity and dexterity. Several employees are randomly selected and tested with these
Results.
سؤال
Use computer software to find the multiple regression equation. Can the equation be used for_ prediction? A wildlife analyst gathered the data in the table to develop an equation to predict
The weights of bears. He used WEIGHT as the dependent variable and CHEST, LENGTH,
And SEX as the independent variables. For SEX, he used male=1 and female=2.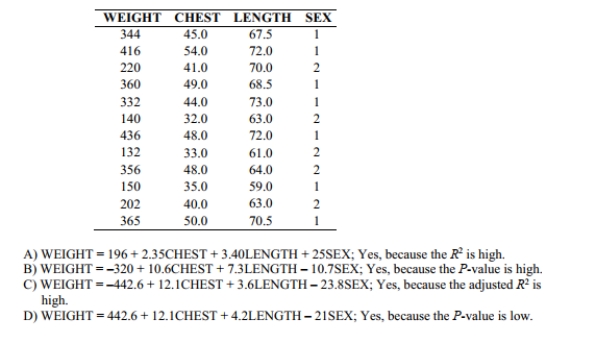
The weights of bears. He used WEIGHT as the dependent variable and CHEST, LENGTH,
And SEX as the independent variables. For SEX, he used male=1 and female=2.
سؤال
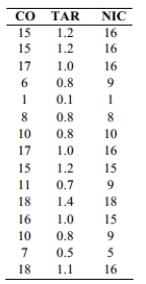
Use computer software to find the multiple regression equation. Can the equation be used for prediction? An anti-smoking group used data in the table to relate the carbon monoxide( CO)
Of various brands of cigarettes to their tar and nicotine (NIC)content.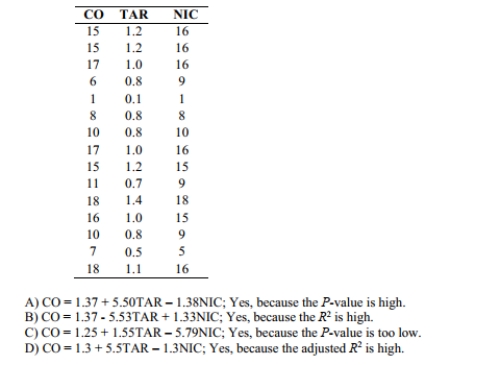
Of various brands of cigarettes to their tar and nicotine (NIC)content.
سؤال
Use the given data to find the equation of the regression line. Round the final values to three significant digits, if necessary. 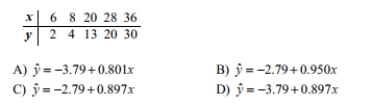
سؤال
Given the linear correlation coefficient r and the sample size n, determine the critical values of r_ and use your finding to state whether or not the given r represents a significant linear
Correlation. Use a significance level of 0.05.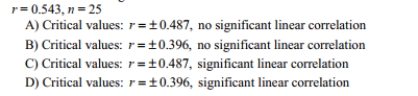
Correlation. Use a significance level of 0.05.
سؤال
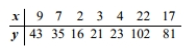
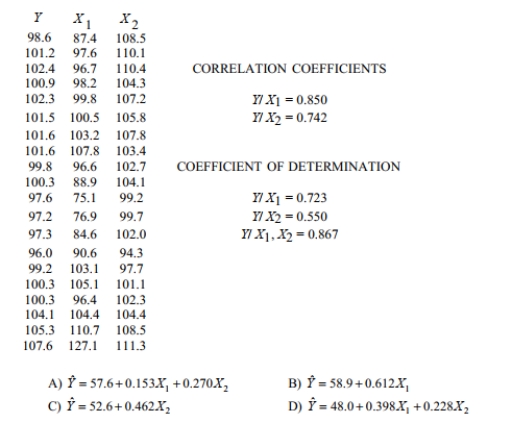
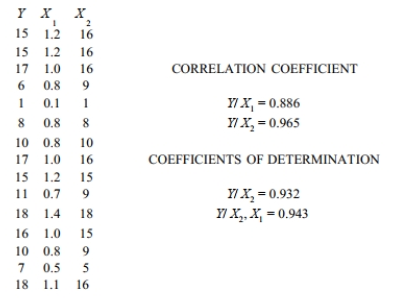
For the data below, determine the value of the linear correlation coefficient r between y and X₂. 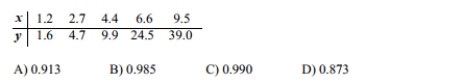
سؤال
Find the unexplained variation for the paired data. The equation of the regression line for the paired data below is 
A) 88.75
B) 78.75
C) 14.25
D) 10.00
A) 88.75
B) 78.75
C) 14.25
D) 10.00
سؤال
سؤال
Suppose you will perform a test to determine whether there is sufficient evidence to support a claim of a linear correlation between two variables. Find the critical value(s)of r given that 
سؤال
سؤال
A 0.05 significance level is being used to test a correlation between two variables. If the linear correlation coefficient r is found to be 0.591 and the critical values are  what can you conclude?
A)There is not sufficient evidence to support the claim of a linear correlation between the two variables.
B)There is sufficient evidence to support the claim of a linear correlation between the two variables.
what can you conclude?A)There is not sufficient evidence to support the claim of a linear correlation between the two variables.
B)There is sufficient evidence to support the claim of a linear correlation between the two variables.
سؤال
Find the value of the linear correlation coefficient r. The paired data below consist of the_ temperatures on randomly chosen days and the amount a certain kind of plant grew (in
Millimeters).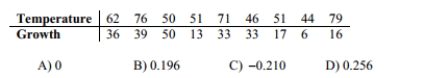
Millimeters).
سؤال
Find the explained variation for the paired data. The equation of the regression line for the paired data below is 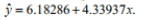
A) 13.479
B) 6,531.37
C) 6,544.86
D) 6,421.83
A) 13.479
B) 6,531.37
C) 6,544.86
D) 6,421.83
سؤال
Use computer software to find the best multiple regression equation to explain the variation in_ the dependent variable, Y, in terms of the independent variables, 
سؤال
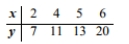
Find the value of the linear correlation coefficient r. The paired data below consist of the_ costs of advertising (in thousands of dollars)and the number of products sold (in thousands). 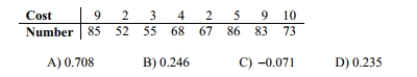
سؤال
Use the given data to find the best predicted value of the response variable. Ten pairs of data yield r=0.003 and the regression equation 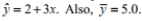
What is the best predicted value of y for x=2 ?
A) 7.0
B) 5.0
C) 8.0
D) 17.0
What is the best predicted value of y for x=2 ?
A) 7.0
B) 5.0
C) 8.0
D) 17.0
سؤال
Use computer software to obtain the multiple regression equation and identify  adjusted
  and the P -value. An anti-smoking group used data in the table to relate the carbon monoxide (CO) of various brands of cigarettes to their tar and nicotine (NIC) content.
A) 0.931,0.902,0.000
B) 0.943,0.934,0.000
C) 0.861,0.900,0.015
D) 0.976,0.921,0.002
adjusted and the P -value. An anti-smoking group used data in the table to relate the carbon monoxide (CO) of various brands of cigarettes to their tar and nicotine (NIC) content.A) 0.931,0.902,0.000
B) 0.943,0.934,0.000
C) 0.861,0.900,0.015
D) 0.976,0.921,0.002
سؤال
Use the given data to find the equation of the regression line. Round the final values to three_ significant digits, if necessary. 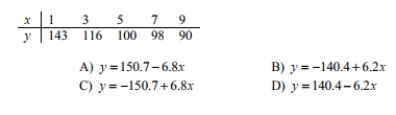
سؤال
A 0.01 significance level is being used to test a correlation between two variables. If the linear correlation coefficient r is found to be 0.591 and the critical values are  what can you conclude?
A)There is not sufficient evidence to support the claim of a linear correlation between the two variables.
B)There is sufficient evidence to support the claim of a linear correlation between the two variables.
what can you conclude?A)There is not sufficient evidence to support the claim of a linear correlation between the two variables.
B)There is sufficient evidence to support the claim of a linear correlation between the two variables.
سؤال
سؤال
Find the indicated multiple regression equation. Below are performance and attitude ratings of_ employees.  Managers also rate the same employees according to adaptability, and below are the results that
Correspond to those given above.
Adaptability : Find the multiple regression equation that expresses performance in terms of attitude and
Adaptability.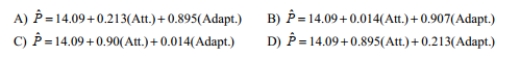
Managers also rate the same employees according to adaptability, and below are the results thatCorrespond to those given above.
Adaptability :
Find the multiple regression equation that expresses performance in terms of attitude andAdaptability.
سؤال
Below are the productivity, dexterity, and job satisfaction ratings of ten randomly selected_ employees. 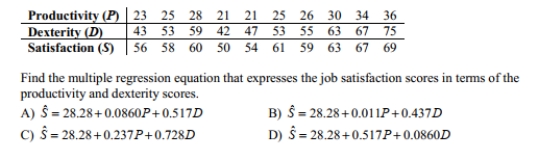
سؤال
Provide an appropriate response. For the data below, determine the logarithmic equation, ya=+b lnx that best fits the data. Hint: Begin by replacing each x-value with ln x then use
The usual methods to find the equation of the least squares regression line.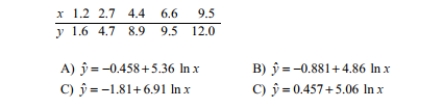
The usual methods to find the equation of the least squares regression line.
سؤال
سؤال
Suppose you will perform a test to determine whether there is sufficient evidence to support a claim of a linear correlation between two variables. Find the critical values of r given the
Number of pairs of data n and the significance level

Number of pairs of data n and the significance level
سؤال
Based on the scatterplot, select the most likely value of the linear correlation coefficient r. 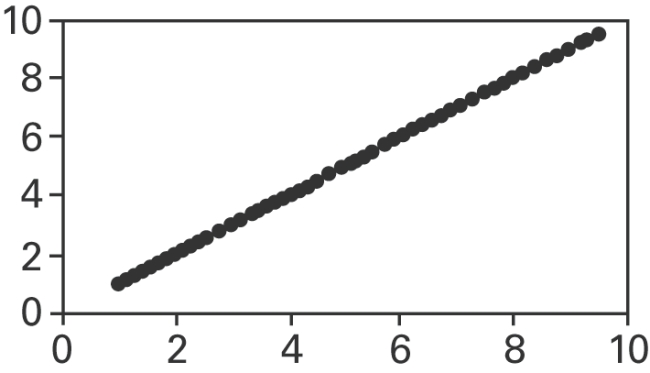
A)0
B)1
C)−1
D)−0.5
A)0
B)1
C)−1
D)−0.5
سؤال
Given the linear correlation coefficient r and the sample size n, determine the critical values of r_ and use your finding to state whether or not the given r represents a significant linear
Correlation. Use a significance level of 0.05.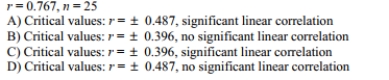
Correlation. Use a significance level of 0.05.
سؤال
Use computer software to find the best multiple regression equation to explain the variation in the dependent variable, Y , in terms of the independent variables, 
A)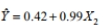
B)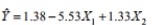
C)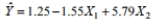
D)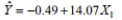
A)
B)
C)
D)
سؤال
Given the linear correlation coefficient r and the sample size n, determine the critical values of_ r and use your finding to state whether or not the given r represents a significant linear
Correlation. Use a significance level of 0.05.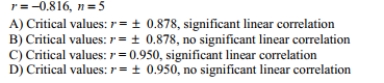
Correlation. Use a significance level of 0.05.
سؤال
A quadratic regression model is fit to a set of sample data consisting of 6 pairs of data. Given that the sum of squares of residuals is 29.73 and that the y-values are 11, 14, 19, 22, 26, 27,
Find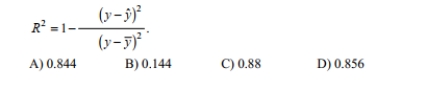
Find
سؤال
Suppose you will perform a test to determine whether there is sufficient evidence to support a claim of a linear correlation between two variables. Find the critical value(s) of r given that n=15 and 
A)
B)
C)
D) r=0.514
A)
B)
C)
D) r=0.514
سؤال
Construct a scatterplot for the given data._ 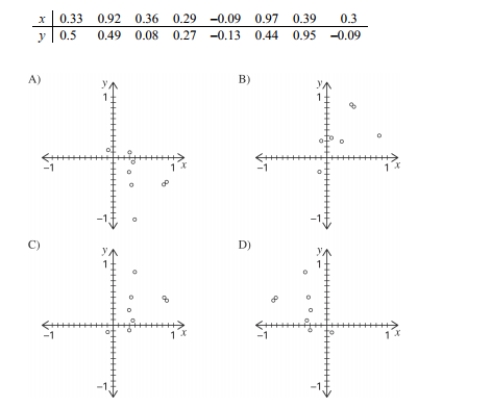
سؤال
Find the value of the linear correlation coefficient r. The paired data below consist of the costs of advertising (in thousands of dollars)and the number of products sold (in thousands): 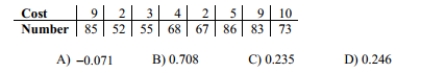
سؤال
سؤال
سؤال
سؤال
The table lists the value y (in dollars)of $100 deposited in a certificate of deposit (CD)at a
bank after y years.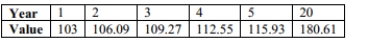 Construct a scatterplot and identify the mathematical model that best fits the given data.
Assume that the model is to be used only for the scope of the given data, and consider only
linear, quadratic, logarithmic, exponential, and power models. Include the type of model and
the equation for the model you find.
bank after y years.
Construct a scatterplot and identify the mathematical model that best fits the given data.Assume that the model is to be used only for the scope of the given data, and consider only
linear, quadratic, logarithmic, exponential, and power models. Include the type of model and
the equation for the model you find.
سؤال
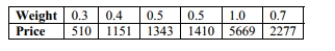
The table below lists weights (carats)and prices (dollars)for randomly selected diamonds.
Find the regression equation, letting the weight be the predictor variable. Find the best
predicted price for a diamond with a weight of 1.50 carats. What is wrong with predicting the
price of a 1.50-carat diamond?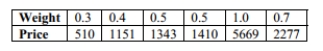
Find the regression equation, letting the weight be the predictor variable. Find the best
predicted price for a diamond with a weight of 1.50 carats. What is wrong with predicting the
price of a 1.50-carat diamond?
سؤال
The table below shows the population of a city (in millions)in each year during the period
2010-2015. Using the number of years since 2010 as the independent variable, find the
regression equation of the best model. Assume that the model is to be used only for the
scope of the given data, and consider only linear, quadratic, logarithmic, exponential, and
power models. Include the type of model and the equation for the model you find.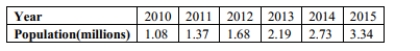
سؤال
A set of data consists of the number of years that applicants for foreign service jobs have_
studied German and the grades that they received on a proficiency test. The following
regression equation is obtained: , where x represents the number of years of
study and y represents the grade on the test. Identify the predictor and response variables.
studied German and the grades that they received on a proficiency test. The following
regression equation is obtained:
, where x represents the number of years ofstudy and y represents the grade on the test. Identify the predictor and response variables.
سؤال
سؤال
Applicants for a particular job, which involves extensive travel in Spanish speaking_
countries must take a proficiency test in Spanish. The sample data below were obtained in a
study of the relationship between the numbers of years applicants have studied Spanish (x)
and their score on the test (y).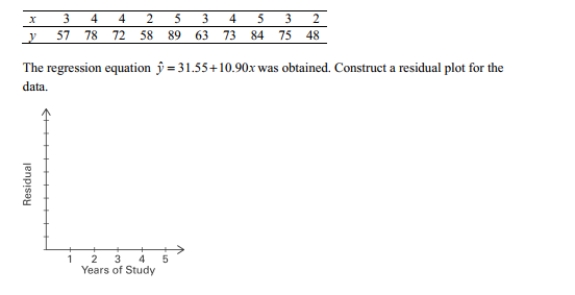
countries must take a proficiency test in Spanish. The sample data below were obtained in a
study of the relationship between the numbers of years applicants have studied Spanish (x)
and their score on the test (y).
سؤال
سؤال
سؤال
The following table gives the US domestic oil production rates (excluding Alaska)from 1987
to 2002. A regression equation was fit to the data and the residual plot is shown below.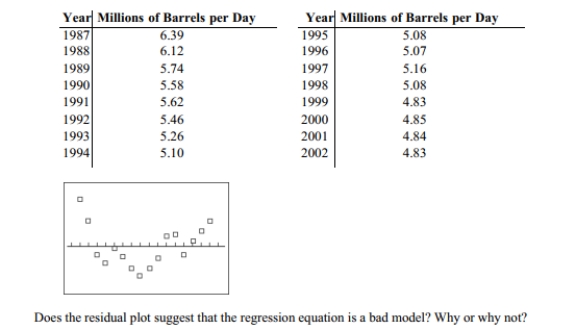
to 2002. A regression equation was fit to the data and the residual plot is shown below.
سؤال
The following residual plot is obtained after a regression equation is determined for a set
of data. Does the residual plot suggest that the regression equation is a bad model? Why or
why not?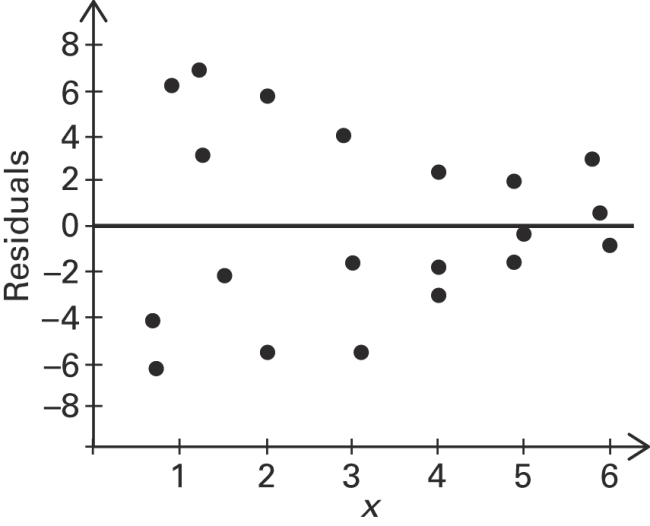
of data. Does the residual plot suggest that the regression equation is a bad model? Why or
why not?
سؤال
سؤال
The table below lists weights (carats)and prices (dollars)for randomly selected diamonds. Is
there sufficient evidence to suggest that there is a linear correlation between weights and
prices? Construct a scatterplot, and find the value of the linear correlation coefficient r.
Also find the P-value or the critical values of r using
there sufficient evidence to suggest that there is a linear correlation between weights and
prices? Construct a scatterplot, and find the value of the linear correlation coefficient r.
Also find the P-value or the critical values of r using
سؤال
When testing to determine if correlation is significant, we use the hypotheses 
 What does the symbol
  represent? Explain the meaning of the null and altemative hypotheses.
What does the symbol represent? Explain the meaning of the null and altemative hypotheses. سؤال
The results for several randomly selected students for test 1 and test 2 grades are given
below.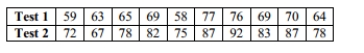 Is there sufficient evidence to suggest that there is a linear correlation between test 1 and test
2 grades? Construct a scatterplot, and find the value of the linear correlation coefficient r.
Also, find the P-value or the critical value(s)of r using = 0.05.
below.
Is there sufficient evidence to suggest that there is a linear correlation between test 1 and test2 grades? Construct a scatterplot, and find the value of the linear correlation coefficient r.
Also, find the P-value or the critical value(s)of r using
= 0.05. سؤال

فتح الحزمة
قم بالتسجيل لفتح البطاقات في هذه المجموعة!
Unlock Deck
Unlock Deck
1/56
العب
ملء الشاشة (f)
Deck 10: Correlation and Regression
1
Determine which plot shows the strongest linear correlation._
C
2
Based on the scatterplot, select the most likely value of the linear correlation coefficient r.
A)0
B)1
C)−1
D)−0.5
A)0
B)1
C)−1
D)−0.5
C
3
Suppose you will perform a test to determine whether there is sufficient evidence to support a claim of a linear correlation between two variables. Find the critical values of r given the number of pairs of data n and the significance level https://d2lvgg3v3hfg70.cloudfront.net/TB34225555/.
n=12 ,
A) r=0.708
B)
C)
D) r=0.735
.n=12 ,
A) r=0.708
B)
C)
D) r=0.735
4
Use the given information to find the coefficient of determination. A regression equation is_ obtained for a collection of paired data. It is found that the total variation is 20.711, the
Explained variation is 18.592, and the unexplained variation is 2.119.
A)1.114
B)0.102
C)0.898
D)0.114
Explained variation is 18.592, and the unexplained variation is 2.119.
A)1.114
B)0.102
C)0.898
D)0.114
فتح الحزمة
افتح القفل للوصول البطاقات البالغ عددها 56 في هذه المجموعة.
فتح الحزمة
k this deck
5
Use computer software to find the best multiple regression equation to explain the variation in the dependent variable, Y, in terms of the independent variables,
فتح الحزمة
افتح القفل للوصول البطاقات البالغ عددها 56 في هذه المجموعة.
فتح الحزمة
k this deck
6
Use the given data to find the equation of the regression line. Round the final values to three significant digits, if necessary. Two different tests are designed to measure employee
Productivity and dexterity. Several employees are randomly selected and tested with these
Results.
Productivity and dexterity. Several employees are randomly selected and tested with these
Results.
فتح الحزمة
افتح القفل للوصول البطاقات البالغ عددها 56 في هذه المجموعة.
فتح الحزمة
k this deck
7
Use computer software to find the multiple regression equation. Can the equation be used for_ prediction? A wildlife analyst gathered the data in the table to develop an equation to predict
The weights of bears. He used WEIGHT as the dependent variable and CHEST, LENGTH,
And SEX as the independent variables. For SEX, he used male=1 and female=2.
The weights of bears. He used WEIGHT as the dependent variable and CHEST, LENGTH,
And SEX as the independent variables. For SEX, he used male=1 and female=2.
فتح الحزمة
افتح القفل للوصول البطاقات البالغ عددها 56 في هذه المجموعة.
فتح الحزمة
k this deck
8
Use computer software to find the multiple regression equation. Can the equation be used for prediction? An anti-smoking group used data in the table to relate the carbon monoxide( CO)
Of various brands of cigarettes to their tar and nicotine (NIC)content.
Of various brands of cigarettes to their tar and nicotine (NIC)content.
فتح الحزمة
افتح القفل للوصول البطاقات البالغ عددها 56 في هذه المجموعة.
فتح الحزمة
k this deck
9
Use the given data to find the equation of the regression line. Round the final values to three significant digits, if necessary.
فتح الحزمة
افتح القفل للوصول البطاقات البالغ عددها 56 في هذه المجموعة.
فتح الحزمة
k this deck
10
Given the linear correlation coefficient r and the sample size n, determine the critical values of r_ and use your finding to state whether or not the given r represents a significant linear
Correlation. Use a significance level of 0.05.
Correlation. Use a significance level of 0.05.
فتح الحزمة
افتح القفل للوصول البطاقات البالغ عددها 56 في هذه المجموعة.
فتح الحزمة
k this deck
11
For the data below, determine the value of the linear correlation coefficient r between y and X₂.
فتح الحزمة
افتح القفل للوصول البطاقات البالغ عددها 56 في هذه المجموعة.
فتح الحزمة
k this deck
12
Find the unexplained variation for the paired data. The equation of the regression line for the paired data below is
A) 88.75
B) 78.75
C) 14.25
D) 10.00
A) 88.75
B) 78.75
C) 14.25
D) 10.00
فتح الحزمة
افتح القفل للوصول البطاقات البالغ عددها 56 في هذه المجموعة.
فتح الحزمة
k this deck
13
The residual is the difference between the ____________________ and the ___________________.
A)predicted value of y; observed value of y
B)observed value of y; predicted value of y
C)predicted value of x; observed value of x
D)observed value of x; predicted value of y
A)predicted value of y; observed value of y
B)observed value of y; predicted value of y
C)predicted value of x; observed value of x
D)observed value of x; predicted value of y
فتح الحزمة
افتح القفل للوصول البطاقات البالغ عددها 56 في هذه المجموعة.
فتح الحزمة
k this deck
14
Suppose you will perform a test to determine whether there is sufficient evidence to support a claim of a linear correlation between two variables. Find the critical value(s)of r given that
فتح الحزمة
افتح القفل للوصول البطاقات البالغ عددها 56 في هذه المجموعة.
فتح الحزمة
k this deck
15
A(n)___________________________ is a point lying far away from other data points on a scatterplot.
A)outlier
B)marginal point
C)residual point
D)least-squares point
A)outlier
B)marginal point
C)residual point
D)least-squares point
فتح الحزمة
افتح القفل للوصول البطاقات البالغ عددها 56 في هذه المجموعة.
فتح الحزمة
k this deck
16
A 0.05 significance level is being used to test a correlation between two variables. If the linear correlation coefficient r is found to be 0.591 and the critical values are what can you conclude?
A)There is not sufficient evidence to support the claim of a linear correlation between the two variables.
B)There is sufficient evidence to support the claim of a linear correlation between the two variables.
what can you conclude?A)There is not sufficient evidence to support the claim of a linear correlation between the two variables.
B)There is sufficient evidence to support the claim of a linear correlation between the two variables.
فتح الحزمة
افتح القفل للوصول البطاقات البالغ عددها 56 في هذه المجموعة.
فتح الحزمة
k this deck
17
Find the value of the linear correlation coefficient r. The paired data below consist of the_ temperatures on randomly chosen days and the amount a certain kind of plant grew (in
Millimeters).
Millimeters).
فتح الحزمة
افتح القفل للوصول البطاقات البالغ عددها 56 في هذه المجموعة.
فتح الحزمة
k this deck
18
Find the explained variation for the paired data. The equation of the regression line for the paired data below is
A) 13.479
B) 6,531.37
C) 6,544.86
D) 6,421.83
A) 13.479
B) 6,531.37
C) 6,544.86
D) 6,421.83
فتح الحزمة
افتح القفل للوصول البطاقات البالغ عددها 56 في هذه المجموعة.
فتح الحزمة
k this deck
19
Use computer software to find the best multiple regression equation to explain the variation in_ the dependent variable, Y, in terms of the independent variables,
فتح الحزمة
افتح القفل للوصول البطاقات البالغ عددها 56 في هذه المجموعة.
فتح الحزمة
k this deck
20
Find the value of the linear correlation coefficient r. The paired data below consist of the_ costs of advertising (in thousands of dollars)and the number of products sold (in thousands).
فتح الحزمة
افتح القفل للوصول البطاقات البالغ عددها 56 في هذه المجموعة.
فتح الحزمة
k this deck
21
Use the given data to find the best predicted value of the response variable. Ten pairs of data yield r=0.003 and the regression equation
What is the best predicted value of y for x=2 ?
A) 7.0
B) 5.0
C) 8.0
D) 17.0
What is the best predicted value of y for x=2 ?
A) 7.0
B) 5.0
C) 8.0
D) 17.0
فتح الحزمة
افتح القفل للوصول البطاقات البالغ عددها 56 في هذه المجموعة.
فتح الحزمة
k this deck
22
Use computer software to obtain the multiple regression equation and identify adjusted and the P -value. An anti-smoking group used data in the table to relate the carbon monoxide (CO) of various brands of cigarettes to their tar and nicotine (NIC) content.
A) 0.931,0.902,0.000
B) 0.943,0.934,0.000
C) 0.861,0.900,0.015
D) 0.976,0.921,0.002
adjusted and the P -value. An anti-smoking group used data in the table to relate the carbon monoxide (CO) of various brands of cigarettes to their tar and nicotine (NIC) content.A) 0.931,0.902,0.000
B) 0.943,0.934,0.000
C) 0.861,0.900,0.015
D) 0.976,0.921,0.002
فتح الحزمة
افتح القفل للوصول البطاقات البالغ عددها 56 في هذه المجموعة.
فتح الحزمة
k this deck
23
Use the given data to find the equation of the regression line. Round the final values to three_ significant digits, if necessary.
فتح الحزمة
افتح القفل للوصول البطاقات البالغ عددها 56 في هذه المجموعة.
فتح الحزمة
k this deck
24
A 0.01 significance level is being used to test a correlation between two variables. If the linear correlation coefficient r is found to be 0.591 and the critical values are what can you conclude?
A)There is not sufficient evidence to support the claim of a linear correlation between the two variables.
B)There is sufficient evidence to support the claim of a linear correlation between the two variables.
what can you conclude?A)There is not sufficient evidence to support the claim of a linear correlation between the two variables.
B)There is sufficient evidence to support the claim of a linear correlation between the two variables.
فتح الحزمة
افتح القفل للوصول البطاقات البالغ عددها 56 في هذه المجموعة.
فتح الحزمة
k this deck
25
The residual is the ________________ the observed value of y and the predicted value of y.
A)sum of
B)difference between
C)product of
D)quotient of
A)sum of
B)difference between
C)product of
D)quotient of
فتح الحزمة
افتح القفل للوصول البطاقات البالغ عددها 56 في هذه المجموعة.
فتح الحزمة
k this deck
26
Find the indicated multiple regression equation. Below are performance and attitude ratings of_ employees. Managers also rate the same employees according to adaptability, and below are the results that
Correspond to those given above.
Adaptability : Find the multiple regression equation that expresses performance in terms of attitude and
Adaptability.
Managers also rate the same employees according to adaptability, and below are the results thatCorrespond to those given above.
Adaptability :
Find the multiple regression equation that expresses performance in terms of attitude andAdaptability.
فتح الحزمة
افتح القفل للوصول البطاقات البالغ عددها 56 في هذه المجموعة.
فتح الحزمة
k this deck
27
Below are the productivity, dexterity, and job satisfaction ratings of ten randomly selected_ employees.
فتح الحزمة
افتح القفل للوصول البطاقات البالغ عددها 56 في هذه المجموعة.
فتح الحزمة
k this deck
28
Provide an appropriate response. For the data below, determine the logarithmic equation, ya=+b lnx that best fits the data. Hint: Begin by replacing each x-value with ln x then use
The usual methods to find the equation of the least squares regression line.
The usual methods to find the equation of the least squares regression line.
فتح الحزمة
افتح القفل للوصول البطاقات البالغ عددها 56 في هذه المجموعة.
فتح الحزمة
k this deck
29
Find the coefficient of determination, given that the value of the linear correlation coefficient,_ r, is 0.738.
A)0.455
B)0.545
C)0.738
D)0.262
A)0.455
B)0.545
C)0.738
D)0.262
فتح الحزمة
افتح القفل للوصول البطاقات البالغ عددها 56 في هذه المجموعة.
فتح الحزمة
k this deck
30
Suppose you will perform a test to determine whether there is sufficient evidence to support a claim of a linear correlation between two variables. Find the critical values of r given the
Number of pairs of data n and the significance level
Number of pairs of data n and the significance level
فتح الحزمة
افتح القفل للوصول البطاقات البالغ عددها 56 في هذه المجموعة.
فتح الحزمة
k this deck
31
Based on the scatterplot, select the most likely value of the linear correlation coefficient r.
A)0
B)1
C)−1
D)−0.5
A)0
B)1
C)−1
D)−0.5
فتح الحزمة
افتح القفل للوصول البطاقات البالغ عددها 56 في هذه المجموعة.
فتح الحزمة
k this deck
32
Given the linear correlation coefficient r and the sample size n, determine the critical values of r_ and use your finding to state whether or not the given r represents a significant linear
Correlation. Use a significance level of 0.05.
Correlation. Use a significance level of 0.05.
فتح الحزمة
افتح القفل للوصول البطاقات البالغ عددها 56 في هذه المجموعة.
فتح الحزمة
k this deck
33
Use computer software to find the best multiple regression equation to explain the variation in the dependent variable, Y , in terms of the independent variables,
A)
B)
C)
D)
A)
B)
C)
D)
فتح الحزمة
افتح القفل للوصول البطاقات البالغ عددها 56 في هذه المجموعة.
فتح الحزمة
k this deck
34
Given the linear correlation coefficient r and the sample size n, determine the critical values of_ r and use your finding to state whether or not the given r represents a significant linear
Correlation. Use a significance level of 0.05.
Correlation. Use a significance level of 0.05.
فتح الحزمة
افتح القفل للوصول البطاقات البالغ عددها 56 في هذه المجموعة.
فتح الحزمة
k this deck
35
A quadratic regression model is fit to a set of sample data consisting of 6 pairs of data. Given that the sum of squares of residuals is 29.73 and that the y-values are 11, 14, 19, 22, 26, 27,
Find
Find
فتح الحزمة
افتح القفل للوصول البطاقات البالغ عددها 56 في هذه المجموعة.
فتح الحزمة
k this deck
36
Suppose you will perform a test to determine whether there is sufficient evidence to support a claim of a linear correlation between two variables. Find the critical value(s) of r given that n=15 and
A)
B)
C)
D) r=0.514
A)
B)
C)
D) r=0.514
فتح الحزمة
افتح القفل للوصول البطاقات البالغ عددها 56 في هذه المجموعة.
فتح الحزمة
k this deck
37
Construct a scatterplot for the given data._
فتح الحزمة
افتح القفل للوصول البطاقات البالغ عددها 56 في هذه المجموعة.
فتح الحزمة
k this deck
38
Find the value of the linear correlation coefficient r. The paired data below consist of the costs of advertising (in thousands of dollars)and the number of products sold (in thousands):
فتح الحزمة
افتح القفل للوصول البطاقات البالغ عددها 56 في هذه المجموعة.
فتح الحزمة
k this deck
39
A(n)___________________________ is a point that strongly affects the graph of the regression line.
A)least squares point
B)marginal point
C)residual point
D)influential point
A)least squares point
B)marginal point
C)residual point
D)influential point
فتح الحزمة
افتح القفل للوصول البطاقات البالغ عددها 56 في هذه المجموعة.
فتح الحزمة
k this deck
40
Which of the following statements concerning the linear correlation coefficient are true?_ I: If the linear correlation coefficient for two variables is zero, then there is no relationship
Between the variables.
II: If the slope of the regression line is negative, then the linear correlation coefficient is
Negative.
III: The value of the linear correlation coefficient always lies between −1 and 1.
IV: A linear correlation coefficient of 0.62 suggests a stronger linear relationship than a linear
Correlation coefficient of -0.82.
A)I and IV
B)III and IV
C)II and III
D)I and II
فتح الحزمة
افتح القفل للوصول البطاقات البالغ عددها 56 في هذه المجموعة.
فتح الحزمة
k this deck
41
A regression equation is obtained for a set of data. After examining a scatter diagram, the_
researcher notices a data point that is potentially an influential point. How could she
confirm that this data point is indeed an influential point?
researcher notices a data point that is potentially an influential point. How could she
confirm that this data point is indeed an influential point?
فتح الحزمة
افتح القفل للوصول البطاقات البالغ عددها 56 في هذه المجموعة.
فتح الحزمة
k this deck
42
The table lists the value y (in dollars)of $100 deposited in a certificate of deposit (CD)at a
bank after y years. Construct a scatterplot and identify the mathematical model that best fits the given data.
Assume that the model is to be used only for the scope of the given data, and consider only
linear, quadratic, logarithmic, exponential, and power models. Include the type of model and
the equation for the model you find.
bank after y years.
Construct a scatterplot and identify the mathematical model that best fits the given data.Assume that the model is to be used only for the scope of the given data, and consider only
linear, quadratic, logarithmic, exponential, and power models. Include the type of model and
the equation for the model you find.
فتح الحزمة
افتح القفل للوصول البطاقات البالغ عددها 56 في هذه المجموعة.
فتح الحزمة
k this deck
43
The table below lists weights (carats)and prices (dollars)for randomly selected diamonds.
Find the regression equation, letting the weight be the predictor variable. Find the best
predicted price for a diamond with a weight of 1.50 carats. What is wrong with predicting the
price of a 1.50-carat diamond?
Find the regression equation, letting the weight be the predictor variable. Find the best
predicted price for a diamond with a weight of 1.50 carats. What is wrong with predicting the
price of a 1.50-carat diamond?
فتح الحزمة
افتح القفل للوصول البطاقات البالغ عددها 56 في هذه المجموعة.
فتح الحزمة
k this deck
44
The table below shows the population of a city (in millions)in each year during the period
2010-2015. Using the number of years since 2010 as the independent variable, find the
regression equation of the best model. Assume that the model is to be used only for the
scope of the given data, and consider only linear, quadratic, logarithmic, exponential, and
power models. Include the type of model and the equation for the model you find.
2010-2015. Using the number of years since 2010 as the independent variable, find the
regression equation of the best model. Assume that the model is to be used only for the
scope of the given data, and consider only linear, quadratic, logarithmic, exponential, and
power models. Include the type of model and the equation for the model you find.
فتح الحزمة
افتح القفل للوصول البطاقات البالغ عددها 56 في هذه المجموعة.
فتح الحزمة
k this deck
45
A set of data consists of the number of years that applicants for foreign service jobs have_
studied German and the grades that they received on a proficiency test. The following
regression equation is obtained: , where x represents the number of years of
study and y represents the grade on the test. Identify the predictor and response variables.
studied German and the grades that they received on a proficiency test. The following
regression equation is obtained:
, where x represents the number of years ofstudy and y represents the grade on the test. Identify the predictor and response variables.
فتح الحزمة
افتح القفل للوصول البطاقات البالغ عددها 56 في هذه المجموعة.
فتح الحزمة
k this deck
46
Describe the standard error of estimate, se. How do smaller values of se relate to the_
dispersion of data points about the line determined by the linear regression equation? What
does it mean when se is 0?
dispersion of data points about the line determined by the linear regression equation? What
does it mean when se is 0?
فتح الحزمة
افتح القفل للوصول البطاقات البالغ عددها 56 في هذه المجموعة.
فتح الحزمة
k this deck
47
Applicants for a particular job, which involves extensive travel in Spanish speaking_
countries must take a proficiency test in Spanish. The sample data below were obtained in a
study of the relationship between the numbers of years applicants have studied Spanish (x)
and their score on the test (y).
countries must take a proficiency test in Spanish. The sample data below were obtained in a
study of the relationship between the numbers of years applicants have studied Spanish (x)
and their score on the test (y).
فتح الحزمة
افتح القفل للوصول البطاقات البالغ عددها 56 في هذه المجموعة.
فتح الحزمة
k this deck
48
For each of 200 randomly selected cities, Pete recorded the number of churches in the city_
(x)and the number of homicides in the past decade (y). He calculated the linear
correlation coefficient and was surprised to find a strong positive linear correlation for the
two variables. Does this suggest that building new churches causes an increase in the number
of homicides? Why do you think that a strong positive linear correlation coefficient was
obtained? Explain your answer with reference to the term lurking variable.
فتح الحزمة
افتح القفل للوصول البطاقات البالغ عددها 56 في هذه المجموعة.
فتح الحزمة
k this deck
49
Define the terms predictor variable and response variable. Give examples for each._
فتح الحزمة
افتح القفل للوصول البطاقات البالغ عددها 56 في هذه المجموعة.
فتح الحزمة
k this deck
50
The following table gives the US domestic oil production rates (excluding Alaska)from 1987
to 2002. A regression equation was fit to the data and the residual plot is shown below.
to 2002. A regression equation was fit to the data and the residual plot is shown below.
فتح الحزمة
افتح القفل للوصول البطاقات البالغ عددها 56 في هذه المجموعة.
فتح الحزمة
k this deck
51
The following residual plot is obtained after a regression equation is determined for a set
of data. Does the residual plot suggest that the regression equation is a bad model? Why or
why not?
of data. Does the residual plot suggest that the regression equation is a bad model? Why or
why not?
فتح الحزمة
افتح القفل للوصول البطاقات البالغ عددها 56 في هذه المجموعة.
فتح الحزمة
k this deck
52
Suppose there is significant correlation between two variables. Describe two cases under_
which it might be inappropriate to use the linear regression equation for prediction. Give
examples to support these cases.
which it might be inappropriate to use the linear regression equation for prediction. Give
examples to support these cases.
فتح الحزمة
افتح القفل للوصول البطاقات البالغ عددها 56 في هذه المجموعة.
فتح الحزمة
k this deck
53
The table below lists weights (carats)and prices (dollars)for randomly selected diamonds. Is
there sufficient evidence to suggest that there is a linear correlation between weights and
prices? Construct a scatterplot, and find the value of the linear correlation coefficient r.
Also find the P-value or the critical values of r using
there sufficient evidence to suggest that there is a linear correlation between weights and
prices? Construct a scatterplot, and find the value of the linear correlation coefficient r.
Also find the P-value or the critical values of r using
فتح الحزمة
افتح القفل للوصول البطاقات البالغ عددها 56 في هذه المجموعة.
فتح الحزمة
k this deck
54
When testing to determine if correlation is significant, we use the hypotheses What does the symbol represent? Explain the meaning of the null and altemative hypotheses.
What does the symbol represent? Explain the meaning of the null and altemative hypotheses. فتح الحزمة
افتح القفل للوصول البطاقات البالغ عددها 56 في هذه المجموعة.
فتح الحزمة
k this deck
55
The results for several randomly selected students for test 1 and test 2 grades are given
below. Is there sufficient evidence to suggest that there is a linear correlation between test 1 and test
2 grades? Construct a scatterplot, and find the value of the linear correlation coefficient r.
Also, find the P-value or the critical value(s)of r using = 0.05.
below.
Is there sufficient evidence to suggest that there is a linear correlation between test 1 and test2 grades? Construct a scatterplot, and find the value of the linear correlation coefficient r.
Also, find the P-value or the critical value(s)of r using
= 0.05. فتح الحزمة
افتح القفل للوصول البطاقات البالغ عددها 56 في هذه المجموعة.
فتح الحزمة
k this deck
56
Describe what scatterplots are and discuss the importance of creating scatterplots._
فتح الحزمة
افتح القفل للوصول البطاقات البالغ عددها 56 في هذه المجموعة.
فتح الحزمة
k this deck
فتح الحزمة
افتح القفل للوصول البطاقات البالغ عددها 56 في هذه المجموعة.


