Deck 7: The Normal Probability Distribution
ملء الشاشة (f)
سؤال
سؤال
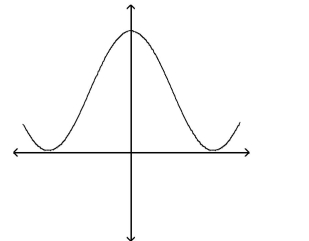
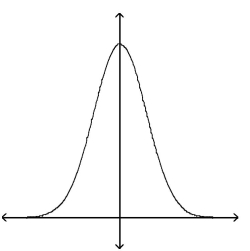
A) The graph cannot represent a normal density function because it increases as x becomes very large or very small.
B) The graph cannot represent a normal density function because it takes negative values for some values of x.
C) The graph cannot represent a normal density function because the area under the graph is greater than 1.
D) The graph can represent a normal density function.
سؤال
سؤال
The highest point on the graph of the normal density curve is located at
A) its mean
B) an inflection point
A) its mean
B) an inflection point
سؤال
سؤال
سؤال
سؤال
سؤال
سؤال
You are performing a study about the weight of preschoolers. A previous study found the weights to benormally distributed with a mean of 30 and a standard deviation of 4. You randomly sample 30 preschoolchildren and find their weights to be as follows. 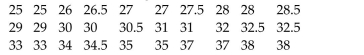 a) Draw a histogram to display the data. Is it reasonable to assume that the weights are normallydistributed? Why?b) Find the mean and standard deviation of your sample.c) Is there a high probability that the mean and standard deviation of your sample are consistentwith those found in previous studies? Explain your reasoning.
a) Draw a histogram to display the data. Is it reasonable to assume that the weights are normallydistributed? Why?b) Find the mean and standard deviation of your sample.c) Is there a high probability that the mean and standard deviation of your sample are consistentwith those found in previous studies? Explain your reasoning. سؤال
سؤال
سؤال
سؤال
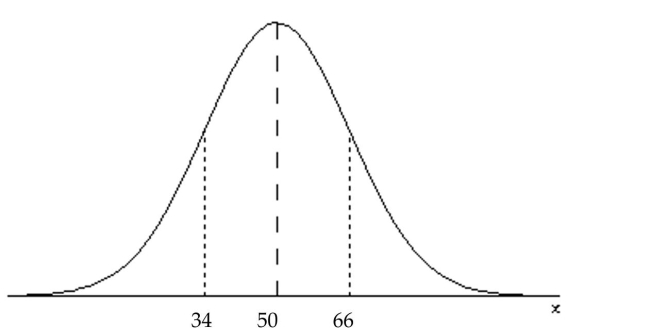
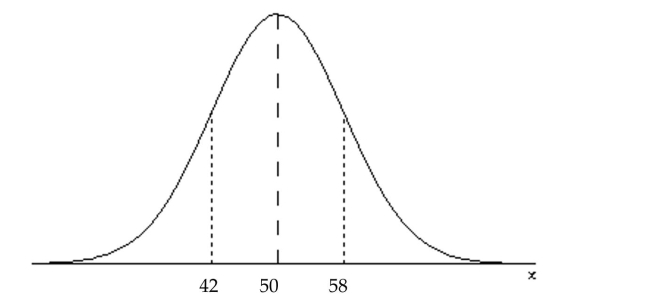
The graph of a normal curve is given. Use the graph to identify the value of μand σ. 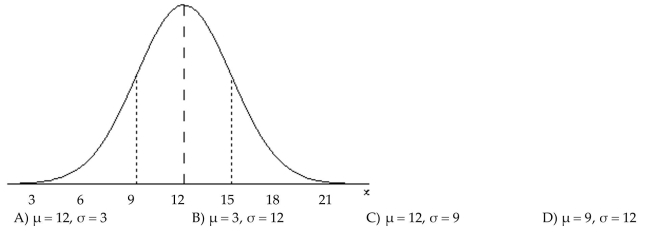
سؤال
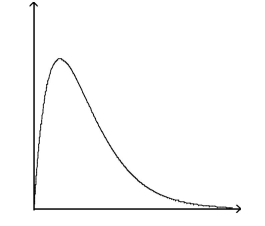
A) The graph cannot represent a normal density function because the graph takes negative values for some values of x.
B) The graph cannot represent a normal density function because the area under the graph is less than 1.
C) The graph cannot represent a normal density function because it is not symmetric.
D) The graph can represent a normal density function.
سؤال
سؤال
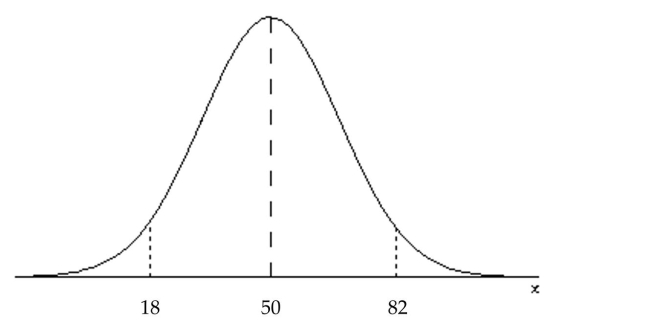
Draw a normal curve with μ = 50 and σ = 16. Label the mean and the inflection points.
A)
B)
C)
D)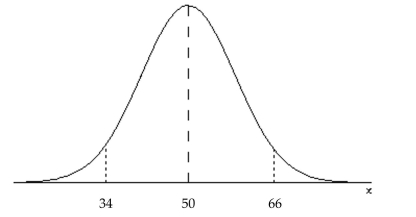
A)
B)
C)
D)
سؤال
A) The graph can represent a normal density function.
B) The graph cannot represent a normal density function because it has no inflection points.
C) The graph cannot represent a normal density function because as x increases without bound, the graph takes negative values.
D) The graph cannot represent a normal density function because the area under the graph is greater than 1.
سؤال
سؤال
سؤال
 (a) Draw a normal curve with the parameters labeled.(b) Shade the region that represents the proportion of mpgs between 29.3 and 23.7.(c) Suppose the area under the normal curve to between X = 29.3 and X = 23.7 is 0.6419. Provide twointerpretations of this result.
 سؤال
سؤال
سؤال
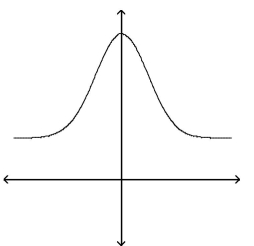
A) The graph cannot represent a normal density function because it is not symmetric.
B) The graph cannot represent a normal density function because as x increases without bound, the graph takes negative values.
C) The graph cannot represent a normal density function because it is bimodal.
D) The graph can represent a normal density function.
سؤال
سؤال
سؤال
سؤال
سؤال
سؤال
سؤال
سؤال
سؤال
سؤال
سؤال
سؤال
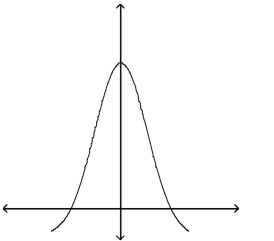
A) The graph cannot represent a normal density function because it does not approach the horizontal axis as x increases or decreases without bound.
B) The graph cannot represent a normal density function because it is not bell shaped.
C) The graph can represent a normal density function.
D) The graph cannot represent a normal density function because it has no inflection points.
سؤال
سؤال
سؤال
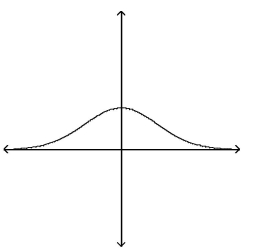
A) The graph can represent a normal density function.
B) The graph cannot represent a normal density function because it has no inflection points.
C) The graph cannot represent a normal density function because its maximum value is too small.
D) The graph cannot represent a normal density function because the area under the graph is less than 1.
سؤال
سؤال
سؤال
سؤال
سؤال
سؤال
سؤال
سؤال
سؤال
سؤال
سؤال
سؤال
سؤال
سؤال
سؤال
سؤال
سؤال
سؤال
سؤال
سؤال
سؤال
سؤال
سؤال
سؤال
سؤال
سؤال
سؤال
سؤال
سؤال
سؤال
سؤال
Assume that the random variable X is normally distributed with mean  and standard deviation
  Find the 24th percentile for X.
A) 41.48
B) 58.52
C) 42.92
D) 38.6
and standard deviation Find the 24th percentile for X.A) 41.48
B) 58.52
C) 42.92
D) 38.6
سؤال
سؤال
سؤال
سؤال
سؤال
سؤال
سؤال
سؤال
سؤال
سؤال

فتح الحزمة
قم بالتسجيل لفتح البطاقات في هذه المجموعة!
Unlock Deck
Unlock Deck
1/120
العب
ملء الشاشة (f)
Deck 7: The Normal Probability Distribution
1
Suppose a uniform random variable can be used to describe the outcome of an experiment with the outcomesranging from 30 to 70. What is the probability that this experiment results in an outcome less than 40?
A) 0.25
B) 0.1
C) 0.31
D) 1
A) 0.25
B) 0.1
C) 0.31
D) 1
A
2
A) The graph cannot represent a normal density function because it increases as x becomes very large or very small.
B) The graph cannot represent a normal density function because it takes negative values for some values of x.
C) The graph cannot represent a normal density function because the area under the graph is greater than 1.
D) The graph can represent a normal density function.
A
3
The normal density curve is symmetric about
A) Its mean
B) The horizontal axis
C) An inflection point
D) A point located one standard deviation from the mean
A) Its mean
B) The horizontal axis
C) An inflection point
D) A point located one standard deviation from the mean
A
4
The highest point on the graph of the normal density curve is located at
A) its mean
B) an inflection point
A) its mean
B) an inflection point
فتح الحزمة
افتح القفل للوصول البطاقات البالغ عددها 120 في هذه المجموعة.
فتح الحزمة
k this deck
5
Suppose x is a uniform random variable with c = 30 and d = 80. Find the probability that a randomly selectedobservation is between 33 and 75.
A) 0.84
B) 0.16
C) 0.5
D) 0.8
A) 0.84
B) 0.16
C) 0.5
D) 0.8
فتح الحزمة
افتح القفل للوصول البطاقات البالغ عددها 120 في هذه المجموعة.
فتح الحزمة
k this deck
6
High temperatures in a certain city for the month of August follow a uniform distribution over the interval 73°Fto 103°F. Find the high temperature which 90% of the August days exceed.
A) 76°F
B) 100°F
C) 83°F
D) 103°F
A) 76°F
B) 100°F
C) 83°F
D) 103°F
فتح الحزمة
افتح القفل للوصول البطاقات البالغ عددها 120 في هذه المجموعة.
فتح الحزمة
k this deck
7
Suppose x is a uniform random variable with c = 10 and d = 60. Find the probability that a randomly selectedobservation exceeds 30.
A) 0.6
B) 0.4
C) 0.1
D) 0.9
A) 0.6
B) 0.4
C) 0.1
D) 0.9
فتح الحزمة
افتح القفل للوصول البطاقات البالغ عددها 120 في هذه المجموعة.
فتح الحزمة
k this deck
8
The diameter of ball bearings produced in a manufacturing process can be explained using a uniformdistribution over the interval 7.5 to 9.5 millimeters. What is the probability that a randomly selected ballbearing has a diameter greater than 8.6 millimeters?
A) 0.45
B) 0.9053
C) 4
D) 0.5059
A) 0.45
B) 0.9053
C) 4
D) 0.5059
فتح الحزمة
افتح القفل للوصول البطاقات البالغ عددها 120 في هذه المجموعة.
فتح الحزمة
k this deck
9
True or False: In a uniform probability distribution, any random variable is just as likely as any other randomvariable to occur, provided the random variables belong to the distribution.
فتح الحزمة
افتح القفل للوصول البطاقات البالغ عددها 120 في هذه المجموعة.
فتح الحزمة
k this deck
10
You are performing a study about the weight of preschoolers. A previous study found the weights to benormally distributed with a mean of 30 and a standard deviation of 4. You randomly sample 30 preschoolchildren and find their weights to be as follows. a) Draw a histogram to display the data. Is it reasonable to assume that the weights are normallydistributed? Why?b) Find the mean and standard deviation of your sample.c) Is there a high probability that the mean and standard deviation of your sample are consistentwith those found in previous studies? Explain your reasoning.
a) Draw a histogram to display the data. Is it reasonable to assume that the weights are normallydistributed? Why?b) Find the mean and standard deviation of your sample.c) Is there a high probability that the mean and standard deviation of your sample are consistentwith those found in previous studies? Explain your reasoning. فتح الحزمة
افتح القفل للوصول البطاقات البالغ عددها 120 في هذه المجموعة.
فتح الحزمة
k this deck
11
Compare a graph of the normal density function with mean of 0 and standard deviation of 1 with a graph of anormal density function with mean equal to 4 and standard deviation of 1. The graphs would
A) Have the same height but one would be shifted 4 units to the right.
B) Have the same height but one would be shifter 4 units to the left.
C) Have no horizontal displacement but one would be steeper that the other.
D) Have no horizontal displacement but one would be flatter than the other.
A) Have the same height but one would be shifted 4 units to the right.
B) Have the same height but one would be shifter 4 units to the left.
C) Have no horizontal displacement but one would be steeper that the other.
D) Have no horizontal displacement but one would be flatter than the other.
فتح الحزمة
افتح القفل للوصول البطاقات البالغ عددها 120 في هذه المجموعة.
فتح الحزمة
k this deck
12
A machine is set to pump cleanser into a process at the rate of 5 gallons per minute. Upon inspection, it islearned that the machine actually pumps cleanser at a rate described by the uniform distribution over theinterval 4.5 to 7.5 gallons per minute. Find the probability that between 5.0 gallons and 6.0 gallons are pumpedduring a randomly selected minute.
A) 0.33
B) 0.67
C) 0
D) 1
A) 0.33
B) 0.67
C) 0
D) 1
فتح الحزمة
افتح القفل للوصول البطاقات البالغ عددها 120 في هذه المجموعة.
فتح الحزمة
k this deck
13
A random number generator is set top generate integer random numbers between 1 and 10 inclusive followinga uniform distribution. What is the probability of the random number generator generating a 7?
A) 0.7
B) 0
C) 0.07
D) 0.5
A) 0.7
B) 0
C) 0.07
D) 0.5
فتح الحزمة
افتح القفل للوصول البطاقات البالغ عددها 120 في هذه المجموعة.
فتح الحزمة
k this deck
14
The graph of a normal curve is given. Use the graph to identify the value of μand σ.
فتح الحزمة
افتح القفل للوصول البطاقات البالغ عددها 120 في هذه المجموعة.
فتح الحزمة
k this deck
15
A) The graph cannot represent a normal density function because the graph takes negative values for some values of x.
B) The graph cannot represent a normal density function because the area under the graph is less than 1.
C) The graph cannot represent a normal density function because it is not symmetric.
D) The graph can represent a normal density function.
فتح الحزمة
افتح القفل للوصول البطاقات البالغ عددها 120 في هذه المجموعة.
فتح الحزمة
k this deck
16
High temperatures in a certain city for the month of August follow a uniform distribution over the interval 64°Fto 92°F. What is the probability that a randomly selected August day has a high temperature that exceeded69°F?
A) 0.8214
B) 0.1786
C) 0.4423
D) 0.0357
A) 0.8214
B) 0.1786
C) 0.4423
D) 0.0357
فتح الحزمة
افتح القفل للوصول البطاقات البالغ عددها 120 في هذه المجموعة.
فتح الحزمة
k this deck
17
Draw a normal curve with μ = 50 and σ = 16. Label the mean and the inflection points.
A)
B)
C)
D)
A)
B)
C)
D)
فتح الحزمة
افتح القفل للوصول البطاقات البالغ عددها 120 في هذه المجموعة.
فتح الحزمة
k this deck
18
A) The graph can represent a normal density function.
B) The graph cannot represent a normal density function because it has no inflection points.
C) The graph cannot represent a normal density function because as x increases without bound, the graph takes negative values.
D) The graph cannot represent a normal density function because the area under the graph is greater than 1.
فتح الحزمة
افتح القفل للوصول البطاقات البالغ عددها 120 في هذه المجموعة.
فتح الحزمة
k this deck
19
Approximately ____% of the area under the normal curve is between μ - 3σ and μ + 3σ.
A) 99.7
B) 68
C) 95
D) 50
A) 99.7
B) 68
C) 95
D) 50
فتح الحزمة
افتح القفل للوصول البطاقات البالغ عددها 120 في هذه المجموعة.
فتح الحزمة
k this deck
20
Compare a graph of the normal density function with mean of 0 and standard deviation of 1 with a graph of anormal density function with mean equal to 0 and standard deviation of 0.5. The graphs would
A) Have no horizontal displacement but one would be steeper that the other.
B) Have no horizontal displacement but one would be flatter than the other.
C) Have the same height but one would be shifted 4 units to the right.
D) Have the same height but one would be shifter 4 units to the left.
A) Have no horizontal displacement but one would be steeper that the other.
B) Have no horizontal displacement but one would be flatter than the other.
C) Have the same height but one would be shifted 4 units to the right.
D) Have the same height but one would be shifter 4 units to the left.
فتح الحزمة
افتح القفل للوصول البطاقات البالغ عددها 120 في هذه المجموعة.
فتح الحزمة
k this deck
21
(a) Draw a normal curve with the parameters labeled.(b) Shade the region that represents the proportion of mpgs between 29.3 and 23.7.(c) Suppose the area under the normal curve to between X = 29.3 and X = 23.7 is 0.6419. Provide twointerpretations of this result. فتح الحزمة
افتح القفل للوصول البطاقات البالغ عددها 120 في هذه المجموعة.
فتح الحزمة
k this deck
22
Find the area under the standard normal curve between z = 1 and z = 2.
A) 0.1359
B) 0.8413
C) 0.5398
D) 0.2139
A) 0.1359
B) 0.8413
C) 0.5398
D) 0.2139
فتح الحزمة
افتح القفل للوصول البطاقات البالغ عددها 120 في هذه المجموعة.
فتح الحزمة
k this deck
23
Find the area under the standard normal curve to the right of z = 1.
A) 0.1587
B) 0.8413
C) 0.1397
D) 0.5398
A) 0.1587
B) 0.8413
C) 0.1397
D) 0.5398
فتح الحزمة
افتح القفل للوصول البطاقات البالغ عددها 120 في هذه المجموعة.
فتح الحزمة
k this deck
24
A) The graph cannot represent a normal density function because it is not symmetric.
B) The graph cannot represent a normal density function because as x increases without bound, the graph takes negative values.
C) The graph cannot represent a normal density function because it is bimodal.
D) The graph can represent a normal density function.
فتح الحزمة
افتح القفل للوصول البطاقات البالغ عددها 120 في هذه المجموعة.
فتح الحزمة
k this deck
25
Find the area under the standard normal curve between z = -1.25 and z = 1.25.
A) 0.7888
B) 0.8817
C) 0.6412
D) 0.2112
A) 0.7888
B) 0.8817
C) 0.6412
D) 0.2112
فتح الحزمة
افتح القفل للوصول البطاقات البالغ عددها 120 في هذه المجموعة.
فتح الحزمة
k this deck
26
Find the area under the standard normal curve between z = 1.5 and z = 2.5.
A) 0.0606
B) 0.9938
C) 0.9332
D) 0.9816
A) 0.0606
B) 0.9938
C) 0.9332
D) 0.9816
فتح الحزمة
افتح القفل للوصول البطاقات البالغ عددها 120 في هذه المجموعة.
فتح الحزمة
k this deck
27
z = 1 and z = 2
A) 0.1359
B) 0.8641
C) 0.0006
D) 0.0008
A) 0.1359
B) 0.8641
C) 0.0006
D) 0.0008
فتح الحزمة
افتح القفل للوصول البطاقات البالغ عددها 120 في هذه المجموعة.
فتح الحزمة
k this deck
28
Find the area under the standard normal curve to the left of z = 1.5.
A) 0.9332
B) 0.0668
C) 0.5199
D) 0.7612
A) 0.9332
B) 0.0668
C) 0.5199
D) 0.7612
فتح الحزمة
افتح القفل للوصول البطاقات البالغ عددها 120 في هذه المجموعة.
فتح الحزمة
k this deck
29
True or False: The area under the normal curve drawn with regard to the population parameters is the same asthe proportion of the population that has these characteristics.
فتح الحزمة
افتح القفل للوصول البطاقات البالغ عددها 120 في هذه المجموعة.
فتح الحزمة
k this deck
30
Find the area under the standard normal curve between z = -1.5 and z = 2.5.
A) 0.9270
B) 0.7182
C) 0.6312
D) 0.9831
A) 0.9270
B) 0.7182
C) 0.6312
D) 0.9831
فتح الحزمة
افتح القفل للوصول البطاقات البالغ عددها 120 في هذه المجموعة.
فتح الحزمة
k this deck
31
The weight of 2-year old hyraxes is known to be normally distributed with meanμ = 2200 grams and standard deviation σ = 365 grams(a) Draw a normal curve with the parameters labeled.(b) Shade the region that represents the proportion of hyraxes who weighed more than 2930 grams.(c) Suppose the area under the normal curve to the left of X = 2930 is 0.0228. Provide two interpretations of thisresult.
فتح الحزمة
افتح القفل للوصول البطاقات البالغ عددها 120 في هذه المجموعة.
فتح الحزمة
k this deck
32
Find the area under the standard normal curve to the left of z = 1.25.
A) 0.8944
B) 0.1056
C) 0.2318
D) 0.7682
A) 0.8944
B) 0.1056
C) 0.2318
D) 0.7682
فتح الحزمة
افتح القفل للوصول البطاقات البالغ عددها 120 في هذه المجموعة.
فتح الحزمة
k this deck
33
Find the area under the standard normal curve between z = 0 and z = 3.
A) 0.4987
B) 0.9987
C) 0.0010
D) 0.4641
A) 0.4987
B) 0.9987
C) 0.0010
D) 0.4641
فتح الحزمة
افتح القفل للوصول البطاقات البالغ عددها 120 في هذه المجموعة.
فتح الحزمة
k this deck
34
Find the area under the standard normal curve to the right of z = -1.25.
A) 0.8944
B) 0.5843
C) 0.6978
D) 0.7193
A) 0.8944
B) 0.5843
C) 0.6978
D) 0.7193
فتح الحزمة
افتح القفل للوصول البطاقات البالغ عددها 120 في هذه المجموعة.
فتح الحزمة
k this deck
35
True or False: The area under the normal curve drawn with regard to the population parameters is the same asthe probability that a randomly selected individual of a population has these characteristics.
فتح الحزمة
افتح القفل للوصول البطاقات البالغ عددها 120 في هذه المجموعة.
فتح الحزمة
k this deck
36
A) The graph cannot represent a normal density function because it does not approach the horizontal axis as x increases or decreases without bound.
B) The graph cannot represent a normal density function because it is not bell shaped.
C) The graph can represent a normal density function.
D) The graph cannot represent a normal density function because it has no inflection points.
فتح الحزمة
افتح القفل للوصول البطاقات البالغ عددها 120 في هذه المجموعة.
فتح الحزمة
k this deck
37
Find the sum of the areas under the standard normal curve to the left of z = -1.25 and to the right of z = 1.25.
A) 0.2112
B) 0.7888
C) 0.1056
D) 0.3944
A) 0.2112
B) 0.7888
C) 0.1056
D) 0.3944
فتح الحزمة
افتح القفل للوصول البطاقات البالغ عددها 120 في هذه المجموعة.
فتح الحزمة
k this deck
38
True or False: The proportion of the population that has certain characteristics is the same as the probabilitythat a randomly selected individual of the population has these same characteristics.
فتح الحزمة
افتح القفل للوصول البطاقات البالغ عددها 120 في هذه المجموعة.
فتح الحزمة
k this deck
39
A) The graph can represent a normal density function.
B) The graph cannot represent a normal density function because it has no inflection points.
C) The graph cannot represent a normal density function because its maximum value is too small.
D) The graph cannot represent a normal density function because the area under the graph is less than 1.
فتح الحزمة
افتح القفل للوصول البطاقات البالغ عددها 120 في هذه المجموعة.
فتح الحزمة
k this deck
40
The analytic scores on a standardized aptitude test are known to be normally distributed with mean μ= 610and standard deviation σ = 115.(a) Draw a normal curve with the parameters labeled.(b) Shade the region that represents the proportion of test takers who scored less than 725.(c) Suppose the area under the normal curve to the left of X = 725 is 0.8413. Provide two interpretations of thisresult.
فتح الحزمة
افتح القفل للوصول البطاقات البالغ عددها 120 في هذه المجموعة.
فتح الحزمة
k this deck
41
A physical fitness association is including the mile run in its secondary-school fitness test. The time for thisevent for boys in secondary school is known to possess a normal distribution with a mean of 440 seconds and astandard deviation of 60 seconds. Find the probability that a randomly selected boy in secondary school willtake longer than 302 seconds to run the mile.
A) 0.9893
B) 0.4893
C) 0.0107
D) 0.5107
A) 0.9893
B) 0.4893
C) 0.0107
D) 0.5107
فتح الحزمة
افتح القفل للوصول البطاقات البالغ عددها 120 في هذه المجموعة.
فتح الحزمة
k this deck
42
The tread life of a particular brand of tire is a random variable best described by a normal distribution with amean of 60,000 miles and a standard deviation of 2900 miles. What is the probability a certain tire of this brandwill last between 53,910 miles and 54,780 miles?
A) 0.0180
B) 0.9813
C) 0.4920
D) 0.4649
A) 0.0180
B) 0.9813
C) 0.4920
D) 0.4649
فتح الحزمة
افتح القفل للوصول البطاقات البالغ عددها 120 في هذه المجموعة.
فتح الحزمة
k this deck
43
z = -2 and z = -0.1
A) 0.4374
B) 0.4602
C) 0.5398
D) 0.0228
A) 0.4374
B) 0.4602
C) 0.5398
D) 0.0228
فتح الحزمة
افتح القفل للوصول البطاقات البالغ عددها 120 في هذه المجموعة.
فتح الحزمة
k this deck
44
Assume that the random variable X is normally distributed, with mean μ = 50 and standard deviation σ = 16.Compute the probability P(6 < X < 70).
A) 0.8914
B) 0.8819
C) 0.8944
D) 0.7888
A) 0.8914
B) 0.8819
C) 0.8944
D) 0.7888
فتح الحزمة
افتح القفل للوصول البطاقات البالغ عددها 120 في هذه المجموعة.
فتح الحزمة
k this deck
45
The tread life of a particular brand of tire is a random variable best described by a normal distribution with amean of 60,000 miles and a standard deviation of 2900 miles. What is the probability a particular tire of thisbrand will last longer than 57,100 miles?
A) 0.8413
B) 0.1587
C) 0.2266
D) 0.7266
A) 0.8413
B) 0.1587
C) 0.2266
D) 0.7266
فتح الحزمة
افتح القفل للوصول البطاقات البالغ عددها 120 في هذه المجموعة.
فتح الحزمة
k this deck
46
The length of time it takes college students to find a parking spot in the library parking lot follows a normaldistribution with a mean of 3.0 minutes and a standard deviation of 1 minute. Find the probability that arandomly selected college student will find a parking spot in the library parking lot in less than 2.5 minutes.
A) 0.3085
B) 0.1915
C) 0.3551
D) 0.2674
A) 0.3085
B) 0.1915
C) 0.3551
D) 0.2674
فتح الحزمة
افتح القفل للوصول البطاقات البالغ عددها 120 في هذه المجموعة.
فتح الحزمة
k this deck
47
The length of time it takes college students to find a parking spot in the library parking lot follows a normaldistribution with a mean of 6.5 minutes and a standard deviation of 1 minute. Find the probability that arandomly selected college student will take between 5.0 and 7.5 minutes to find a parking spot in the librarylot.
A) 0.7745
B) 0.4938
C) 0.0919
D) 0.2255
A) 0.7745
B) 0.4938
C) 0.0919
D) 0.2255
فتح الحزمة
افتح القفل للوصول البطاقات البالغ عددها 120 في هذه المجموعة.
فتح الحزمة
k this deck
48
z = 0.3 and z = 1.4
A) 0.3013
B) 0.6179
C) 0.9192
D) 0.3821
A) 0.3013
B) 0.6179
C) 0.9192
D) 0.3821
فتح الحزمة
افتح القفل للوصول البطاقات البالغ عددها 120 في هذه المجموعة.
فتح الحزمة
k this deck
49
Assume that the random variable X is normally distributed, with mean μ = 100 and standard deviation σ = 15.Compute the probability P(X > 112).
A) 0.2119
B) 0.1977
C) 0.7881
D) 0.2420
A) 0.2119
B) 0.1977
C) 0.7881
D) 0.2420
فتح الحزمة
افتح القفل للوصول البطاقات البالغ عددها 120 في هذه المجموعة.
فتح الحزمة
k this deck
50
A firm believes the internal rate of return for its proposed investment can best be described by a normaldistribution with mean 36% and standard deviation 3%. What is the probability that the internal rate of returnfor the investment exceeds 42%?
فتح الحزمة
افتح القفل للوصول البطاقات البالغ عددها 120 في هذه المجموعة.
فتح الحزمة
k this deck
51
z = -0.7 and z = 0.7
A) 0.516
B) 0.242
C) 0.758
D) 0.5
A) 0.516
B) 0.242
C) 0.758
D) 0.5
فتح الحزمة
افتح القفل للوصول البطاقات البالغ عددها 120 في هذه المجموعة.
فتح الحزمة
k this deck
52
A new phone system was installed last year to help reduce the expense of personal calls that were being madeby employees. Before the new system was installed, the amount being spent on personal calls follows a normaldistribution with an average of $900 per month and a standard deviation of $50 per month. Refer to suchexpenses as PCEʹs (personal call expenses). Find the probability that a randomly selected month had a PCE thatfalls below $750.
A) 0.0013
B) 0.8333
C) 0.1667
D) 0.9987
A) 0.0013
B) 0.8333
C) 0.1667
D) 0.9987
فتح الحزمة
افتح القفل للوصول البطاقات البالغ عددها 120 في هذه المجموعة.
فتح الحزمة
k this deck
53
A firm believes the internal rate of return for its proposed investment can best be described by a normaldistribution with mean 26% and standard deviation 3%. What is the probability that the internal rate of returnfor the investment will be at least 21.5%?
فتح الحزمة
افتح القفل للوصول البطاقات البالغ عددها 120 في هذه المجموعة.
فتح الحزمة
k this deck
54
A physical fitness association is including the mile run in its secondary-school fitness test. The time for thisevent for boys in secondary school is known to possess a normal distribution with a mean of 450 seconds and astandard deviation of 50 seconds. Find the probability that a randomly selected boy in secondary school canrun the mile in less than 335 seconds.
A) 0.0107
B) 0.4893
C) 0.9893
D) 0.5107
A) 0.0107
B) 0.4893
C) 0.9893
D) 0.5107
فتح الحزمة
افتح القفل للوصول البطاقات البالغ عددها 120 في هذه المجموعة.
فتح الحزمة
k this deck
55
Suppose a brewery has a filling machine that fills 12 ounce bottles of beer. It is known that the amount of beerpoured by this filling machine follows a normal distribution with a mean of 13.14 onces and a standarddeviation of 0.04 ounce. Find the probability that the bottle contains more than 13.14 ounces of beer.
A) 0.5
B) 1
C) 0
D) 0.4
A) 0.5
B) 1
C) 0
D) 0.4
فتح الحزمة
افتح القفل للوصول البطاقات البالغ عددها 120 في هذه المجموعة.
فتح الحزمة
k this deck
56
Suppose a brewery has a filling machine that fills 12 ounce bottles of beer. It is known that the amount of beerpoured by this filling machine follows a normal distribution with a mean of 12.13 ounces and a standarddeviation of 0.04 ounce. Find the probability that the bottle contains fewer than 12.03 ounces of beer.
A) 0.0062
B) 0.4938
C) 0.9938
D) 0.5062
A) 0.0062
B) 0.4938
C) 0.9938
D) 0.5062
فتح الحزمة
افتح القفل للوصول البطاقات البالغ عددها 120 في هذه المجموعة.
فتح الحزمة
k this deck
57
A new phone system was installed last year to help reduce the expense of personal calls that were being madeby employees. Before the new system was installed, the amount being spent on personal calls followed anormal distribution with an average of $500 per month and a standard deviation of $50 per month. Refer tosuch expenses as PCEʹs (personal call expenses). Using the distribution above, what is the probability that arandomly selected month had a PCE of between $375.00 and $590.00?
A) 0.9579
B) 0.0421
C) 0.9999
D) 0.0001
A) 0.9579
B) 0.0421
C) 0.9999
D) 0.0001
فتح الحزمة
افتح القفل للوصول البطاقات البالغ عددها 120 في هذه المجموعة.
فتح الحزمة
k this deck
58
Suppose a brewery has a filling machine that fills 12 ounce bottles of beer. It is known that the amount of beerpoured by this filling machine follows a normal distribution with a mean of 12.29 ounces and a standarddeviation of 0.04 ounce. Find the probability that the bottle contains between 12.19 and 12.25 ounces.
A) 0.1525
B) 0.8351
C) 0.1649
D) 0.8475
A) 0.1525
B) 0.8351
C) 0.1649
D) 0.8475
فتح الحزمة
افتح القفل للوصول البطاقات البالغ عددها 120 في هذه المجموعة.
فتح الحزمة
k this deck
59
The amount of soda a dispensing machine pours into a 12 ounce can of soda follows a normal distribution witha mean of 12.48 ounces and a standard deviation of 0.32 ounce. The cans only hold 12.80 ounces of soda. Everycan that has more than 12.80 ounces of soda poured into it causes a spill and the can needs to go through aspecial cleaning process before it can be sold. What is the probability a randomly selected can will need to gothrough this process?
A) 0.1587
B) 0.3413
C) 0.8413
D) 0.6587
A) 0.1587
B) 0.3413
C) 0.8413
D) 0.6587
فتح الحزمة
افتح القفل للوصول البطاقات البالغ عددها 120 في هذه المجموعة.
فتح الحزمة
k this deck
60
Assume that the random variable X is normally distributed, with mean μ = 60 and standard deviation σ = 16.Compute the probability P(X < 80).
A) 0.8944
B) 0.8849
C) 0.1056
D) 0.9015
A) 0.8944
B) 0.8849
C) 0.1056
D) 0.9015
فتح الحزمة
افتح القفل للوصول البطاقات البالغ عددها 120 في هذه المجموعة.
فتح الحزمة
k this deck
61
Find the z-score for which the area under the standard normal curve to its right is 0.70.
A) -0.53
B) -0.98
C) -0.81
D) -0.47
A) -0.53
B) -0.98
C) -0.81
D) -0.47
فتح الحزمة
افتح القفل للوصول البطاقات البالغ عددها 120 في هذه المجموعة.
فتح الحزمة
k this deck
62
Given a distribution that follows a standard normal curve, what does the graph of the curve do as z increasesin the positive direction?
A) The graph of the curve approaches zero.
B) The graph of the curve approaches 1.
C) The graph of the curve approaches an inflection point.
D) The graph of the curve eventually intersects the horizontal axis.
A) The graph of the curve approaches zero.
B) The graph of the curve approaches 1.
C) The graph of the curve approaches an inflection point.
D) The graph of the curve eventually intersects the horizontal axis.
فتح الحزمة
افتح القفل للوصول البطاقات البالغ عددها 120 في هذه المجموعة.
فتح الحزمة
k this deck
63
Find the z-score for which the area under the standard normal curve to its left is 0.96
A) 1.75
B) 1.82
C) 1.03
D) -1.38
A) 1.75
B) 1.82
C) 1.03
D) -1.38
فتح الحزمة
افتح القفل للوصول البطاقات البالغ عددها 120 في هذه المجموعة.
فتح الحزمة
k this deck
64
Find the z-scores for which 98% of the distributionʹs area lies between -z and z.
A) (-2.33, 2.33)
B) (-1.645, 1.645)
C) (-1.96, 1.96)
D) (-0.99, 0.99)
A) (-2.33, 2.33)
B) (-1.645, 1.645)
C) (-1.96, 1.96)
D) (-0.99, 0.99)
فتح الحزمة
افتح القفل للوصول البطاقات البالغ عددها 120 في هذه المجموعة.
فتح الحزمة
k this deck
65
Determine the two z-scores that separate the middle 87.4% of the distribution from the area in the tails of thestandard normal distribution.
A) -1.53, 1.53
B) -1.39, 1.39
C) -1.46, 1.46
D) -1.45, 1.45
A) -1.53, 1.53
B) -1.39, 1.39
C) -1.46, 1.46
D) -1.45, 1.45
فتح الحزمة
افتح القفل للوصول البطاقات البالغ عددها 120 في هذه المجموعة.
فتح الحزمة
k this deck
66
Farmers often sell fruits and vegetables at roadside stands during the summer. One such roadside stand has adaily demand for tomatoes that is approximately normally distributed with a mean equal to 413 tomatoes perday and a standard deviation equal to 30 tomatoes per day. If there are 371 tomatoes available to be sold at theroadside stand at the beginning of a day, what is the probability that they will all be sold?
فتح الحزمة
افتح القفل للوصول البطاقات البالغ عددها 120 في هذه المجموعة.
فتح الحزمة
k this deck
67
For a standard normal curve, find the z-score that separates the bottom 30% from the top 70%.
A) -0.53
B) -0.98
C) -0.47
D) -0.12
A) -0.53
B) -0.98
C) -0.47
D) -0.12
فتح الحزمة
افتح القفل للوصول البطاقات البالغ عددها 120 في هذه المجموعة.
فتح الحزمة
k this deck
68
Find the z-score for which the area under the standard normal curve to its left is 0.40
A) -0.25
B) 0.25
C) 0.57
D) -0.57
A) -0.25
B) 0.25
C) 0.57
D) -0.57
فتح الحزمة
افتح القفل للوصول البطاقات البالغ عددها 120 في هذه المجموعة.
فتح الحزمة
k this deck
69
Find the z-score for which the area under the standard normal curve to its right is 0.07.
A) 1.48
B) 1.39
C) 1.26
D) 1.45
A) 1.48
B) 1.39
C) 1.26
D) 1.45
فتح الحزمة
افتح القفل للوصول البطاقات البالغ عددها 120 في هذه المجموعة.
فتح الحزمة
k this deck
70
Assume that the random variable X is normally distributed with mean and standard deviation Find the 24th percentile for X.
A) 41.48
B) 58.52
C) 42.92
D) 38.6
and standard deviation Find the 24th percentile for X.A) 41.48
B) 58.52
C) 42.92
D) 38.6
فتح الحزمة
افتح القفل للوصول البطاقات البالغ عددها 120 في هذه المجموعة.
فتح الحزمة
k this deck
71
Determine the two z-scores that separate the middle 96% of the distribution from the area in the tails of thestandard normal distribution.
A) -2.05 and 2.05
B) -1.75 and 1.75
C) 0 and 2.05
D) -2.33 and 2.33
A) -2.05 and 2.05
B) -1.75 and 1.75
C) 0 and 2.05
D) -2.33 and 2.33
فتح الحزمة
افتح القفل للوصول البطاقات البالغ عددها 120 في هذه المجموعة.
فتح الحزمة
k this deck
72
z0.05
A) 1.645
B) -1.645
C) 0.52
D) 1.75
A) 1.645
B) -1.645
C) 0.52
D) 1.75
فتح الحزمة
افتح القفل للوصول البطاقات البالغ عددها 120 في هذه المجموعة.
فتح الحزمة
k this deck
73
Find the z-score for which the area under the standard normal curve to its right is 0.09.
A) 1.34
B) 1.39
C) 1.26
D) 1.45
A) 1.34
B) 1.39
C) 1.26
D) 1.45
فتح الحزمة
افتح القفل للوصول البطاقات البالغ عددها 120 في هذه المجموعة.
فتح الحزمة
k this deck
74
Find the z-score having area 0.86 to its right under the standard normal curve; that is, find z 0.86 .
A) -1.08
B) 1.08
C) 0.8051
D) 0.5557
A) -1.08
B) 1.08
C) 0.8051
D) 0.5557
فتح الحزمة
افتح القفل للوصول البطاقات البالغ عددها 120 في هذه المجموعة.
فتح الحزمة
k this deck
75
For a standard normal curve, find the z-score that separates the bottom 90% from the top 10%.
A) 1.28
B) 0.28
C) 1.52
D) 2.81
A) 1.28
B) 0.28
C) 1.52
D) 2.81
فتح الحزمة
افتح القفل للوصول البطاقات البالغ عددها 120 في هذه المجموعة.
فتح الحزمة
k this deck
76
Find the z-score for which the area under the standard normal curve to its left is 0.04.
A) -1.75
B) -1.89
C) -1.48
D) -1.63
A) -1.75
B) -1.89
C) -1.48
D) -1.63
فتح الحزمة
افتح القفل للوصول البطاقات البالغ عددها 120 في هذه المجموعة.
فتح الحزمة
k this deck
77
Find the z-score for which the area under the standard normal curve to its left is 0.09.
A) -1.34
B) -1.39
C) -1.26
D) -1.45
A) -1.34
B) -1.39
C) -1.26
D) -1.45
فتح الحزمة
افتح القفل للوصول البطاقات البالغ عددها 120 في هذه المجموعة.
فتح الحزمة
k this deck
78
For a standard normal curve, find the z-score that separates the bottom 70% from the top 30%.
A) 0.53
B) 0.98
C) 0.47
D) 0.12
A) 0.53
B) 0.98
C) 0.47
D) 0.12
فتح الحزمة
افتح القفل للوصول البطاقات البالغ عددها 120 في هذه المجموعة.
فتح الحزمة
k this deck
79
Find the z-score for which the area under the standard normal curve to its left is 0.70.
A) 0.53
B) 0.98
C) 0.81
D) 0.47
A) 0.53
B) 0.98
C) 0.81
D) 0.47
فتح الحزمة
افتح القفل للوصول البطاقات البالغ عددها 120 في هذه المجموعة.
فتح الحزمة
k this deck
80
Find the z-scores for which 90% of the distributionʹs area lies between -z and z.
A) (-1.645, 1.645)
B) (-2.33, 2.33)
C) (-1.96, 1.96)
D) (-0.99, 0.99)
A) (-1.645, 1.645)
B) (-2.33, 2.33)
C) (-1.96, 1.96)
D) (-0.99, 0.99)
فتح الحزمة
افتح القفل للوصول البطاقات البالغ عددها 120 في هذه المجموعة.
فتح الحزمة
k this deck
فتح الحزمة
افتح القفل للوصول البطاقات البالغ عددها 120 في هذه المجموعة.


