Deck 13: Categorical Data Analysis
ملء الشاشة (f)
سؤال
سؤال
سؤال
سؤال
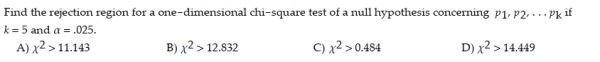
A multinomial experiment with k = 3 cells and n =100 has been conducted and the results are shown in the table. 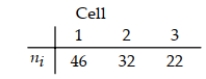 Construct a 99% confidence interval for the multinomial probability associated with cell 2. 3 Perform One-Way Chi Square Test
Construct a 99% confidence interval for the multinomial probability associated with cell 2. 3 Perform One-Way Chi Square Test سؤال
سؤال
Many track runners believe that they have a better chance of winning if they start in the inside lane that is closest to the field. For the data below, the lane closest to the field is Lane 1, the next lane is Lane 2, and so on until the outermost lane, Lane 6. The table displays the starting positions for the winners of 240 competitions. Find the rejection region used to test the claim that the probability of winning is the same regardless of starting position. Use α = 0.05. The results are based on 240 wins. 
سؤال
سؤال
An adverse drug effect (ADE) is an unintended injury caused by prescribed medication. The table summarizes the proximal cause of 95 ADEs that resulted from a dosing error at a Boston hospital. 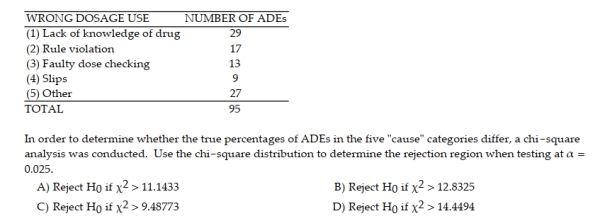 2 Construct Confidence Interval
2 Construct Confidence Interval سؤال
Many track runners believe that they have a better chance of winning if they start in the inside lane that is closest to the field. For the data below, the lane closest to the field is Lane 1, the next lane is Lane 2, and so on until the outermost lane, Lane 6. The table displays the starting positions for the winners of 240 competitions. Test the claim that the probability of winning is the same regardless of starting position. Use α = 0.05. The results are based on 240 wins. 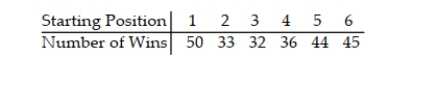
سؤال
A multinomial experiment with k = 4 cells and n = 400 produced the data shown in the following table. 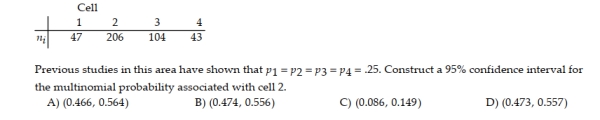
سؤال
سؤال
سؤال
A multinomial experiment with k = 4 cells and n = 300 produced the data shown in the following table. 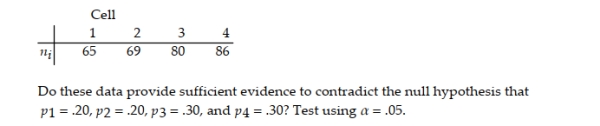
سؤال
سؤال
سؤال
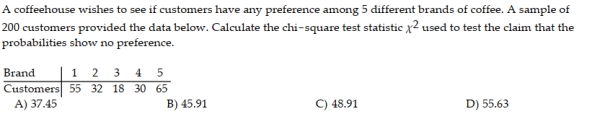
A coffeehouse wishes to see if customers have any preference among 5 different brands of coffee. A sample of 200 customers provided the data below. Find the rejection region used to test the claim that the probabilities show no preference. Use α = 0.01. 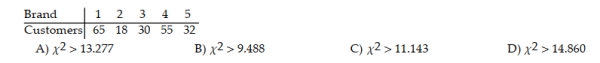
سؤال
Inc. Technology reported the results of consumer survey in which 300 Internet users indicated their level of agreement with the following statement: "The government needs to be able to scan Internet messages and user communications to prevent fraud and other crimes." The possible responses were "agree strongly", "agree somewhat", "disagree somewhat", and "disagree strongly". The number of Internet users in each category is summarized in the table. 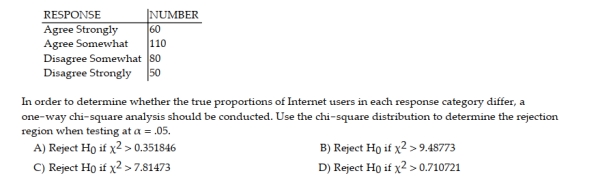
سؤال
سؤال
A survey of entrepreneurs focused on their job characteristics, work habits, social activities, leisure time, etc. One question put to each entrepreneur was, "What make of car (U.S., Europe, or Japan) do you drive?" The responses (number in each category) for a sample of 100 entrepreneurs are summarized below. The goal of the analysis is to determine if the proportions of entrepreneurs who drive American, European, and Japanese cars differ. U.S. Europe Japan 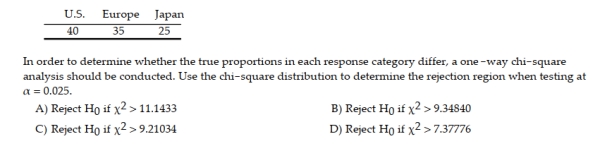
سؤال
سؤال
Economists at USF are researching the problem of absenteeism at U.S. firms. A random sample of 100 U.S. organizations was selected to participate in a 1-year study. As part of the study, the economists had collected data on the following two variables for each company: shiftwork available (Yes or No), and union-management relationship (Good or Poor). As part of their analyses, the economists wanted to determine whether or not a company makes shiftwork available depends on the relationship between union and management. The collected data are shown below: 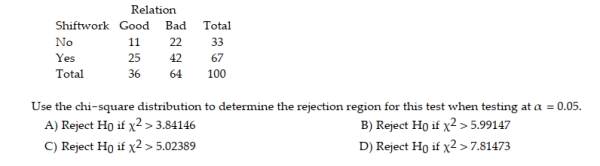
سؤال
Find the rejection region for a test of independence of two classifications where the contingency table contains r = 2 rows and c = 4 columns and α = .10. 
سؤال
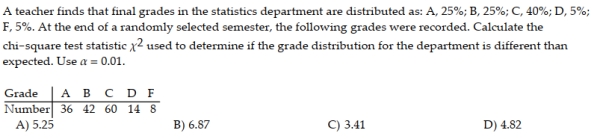
A teacher finds that final grades in the statistics department are distributed as: A, 25%; B, 25%; C, 40%; D, 5%; F, 5%. At the end of a randomly selected semester, the following grades were recorded. Find the rejection region used to determine if the grade distribution for the department is different than expected. Use α = 0.01. 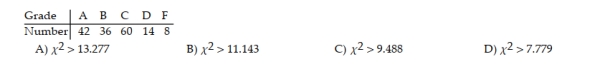
سؤال
سؤال
A survey of entrepreneurs focused on their job characteristics, work habits, social activities, leisure time, etc. One question put to each entrepreneur was, "What make of car (U.S., Europe, or Japan) do you drive?" The responses (number in each category) for a sample of 100 entrepreneurs are summarized below. The goal of the analysis is to determine if the proportions of entrepreneurs who drive American, European, and Japanese cars differ. 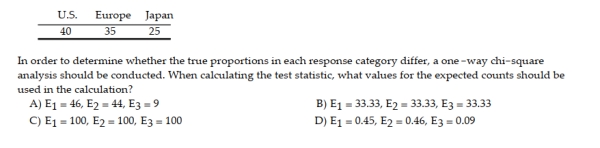
سؤال
سؤال
سؤال
سؤال
سؤال
Inc. Technology reported the results of consumer survey in which 300 Internet users indicated their level of agreement with the following statement: "The government needs to be able to scan Internet messages and user communications to prevent fraud and other crimes." The possible responses were "agree strongly", "agree somewhat", "disagree somewhat", and "disagree strongly". The number of Internet users in each category is summarized in the table. 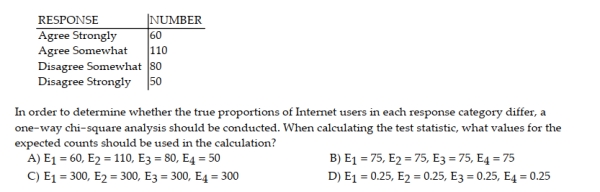
سؤال
A drug company developed a honey-based liquid medicine designed to calm a child's cough at night. To test the drug, 105 children who were ill with an upper respiratory tract infection were randomly selected to participate in a clinical trial. The children were randomly divided into three groups - one group was given a dosage of the honey drug, the second was given a dosage of liquid DM (an over-the-counter cough medicine), and the third (control group) received a liquid placebo (no dosage at all). After administering the medicine to their coughing child, parents rated their children's cough diagnosis as either better or worse. The results are shown in the table below: 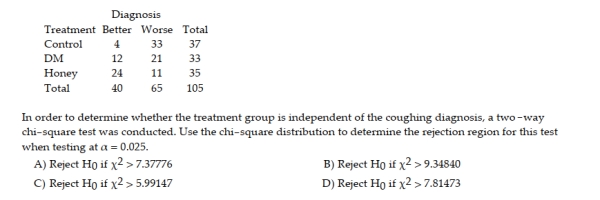
سؤال
Inc. Technology reported the results of consumer survey in which 300 Internet users indicated their level of agreement with the following statement: "The government needs to be able to scan Internet messages and user communications to prevent fraud and other crimes." The possible responses were "agree strongly", "agree somewhat", "disagree somewhat", and "disagree strongly". The number of Internet users in each category is summarized in the table. 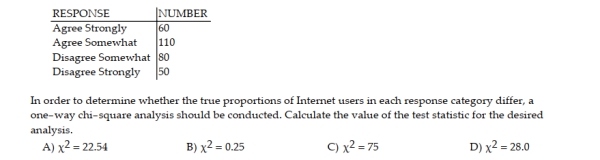
سؤال
A random sample of 160 car accidents are selected and categorized by the age of the driver determined to be at fault. The results are listed below. The age distribution of drivers for the given categories is 18% for the under 26 group, 39% for the 26-45 group, 31% for the 45-65 group, and 12% for the group over 65. Find the rejection region used to test the claim that all ages have crash rates proportional to their number of drivers. Use α = 0.05. 
سؤال
A teacher finds that final grades in the statistics department are distributed as: A, 25%; B, 25%; C, 40%; D, 5%; F, 5%. At the end of a randomly selected semester, the following grades were recorded. Determine if the grade distribution for the department is different than expected. Use α = 0.01. 
سؤال
Test the null hypothesis of independence of the two classifications, A and B, of the 3 × 3 contingency table shown below. Test using α = .10. 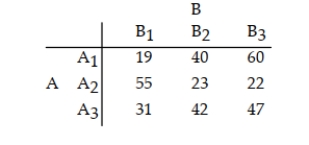
سؤال
Inc. Technology reported the results of consumer survey in which 300 Internet users indicated their level of agreement with the following statement: "The government needs to be able to scan Internet messages and user communications to prevent fraud and other crimes." The possible responses were "agree strongly", "agree somewhat", "disagree somewhat", and "disagree strongly". The number of Internet users in each category is summarized in the table. 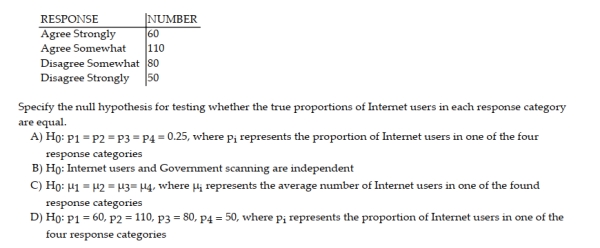
سؤال
A random sample of 160 car accidents are selected and categorized by the age of the driver determined to be at fault. The results are listed below. The age distribution of drivers for the given categories is 18% for the under 26 group, 39% for the 26-45 group, 31% for the 46-65 group, and 12% for the group over 65. Test the claim that all ages have crash rates proportional to their number of drivers. Use α = 0.05. 
سؤال
سؤال
A multinomial experiment with k = 3 cells and n =30 has been conducted and the results are shown in the table. 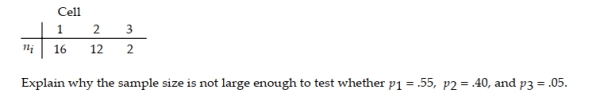
سؤال
The null hypothesis for a test of data resulting from a multinomial experiment is given as 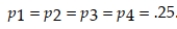 . What is the alternative hypothesis for the test? 13.3 Testing Categorical Probabilities: Two-Way (Contingency) Table 1 Use Chi-Square Distribution
. What is the alternative hypothesis for the test? 13.3 Testing Categorical Probabilities: Two-Way (Contingency) Table 1 Use Chi-Square Distribution سؤال
Economists at USF are researching the problem of absenteeism at U.S. firms. A random sample of 100 U.S. organizations was selected to participate in a 1-year study. As part of the study, the economists had collected data on the following two variables for each company: shiftwork available (Yes or No), and union-management relationship (Good or Poor). As part of their analyses, the economists wanted to determine whether or not a company makes shiftwork available depends on the relationship between union and management. The collected data are shown below: 
سؤال
A sports researcher is interested in determining if there is a relationship between the number of home team and visiting team wins and different sports. A random sample of 526 games is selected and the results are given below. Find the rejection region used to test the claim that the number of home team and visiting team wins is independent of the sport. Use α = 0.01. 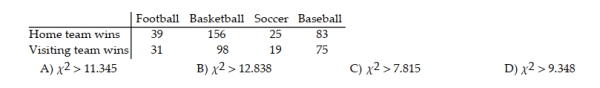
سؤال
سؤال
سؤال
سؤال
A sports researcher is interested in determining if there is a relationship between the number of home team and visiting team wins and different sports. A random sample of 526 games is selected and the results are given below. Test the claim that the number of home team and visiting team wins is independent of the sport. Use α = 0.01. 
سؤال
سؤال
سؤال
The contingency table below shows the results of a random sample of 200 state representatives that was conducted to see whether their opinions on a bill are related to their party affiliations. Party Approve Disapprove No Opinion 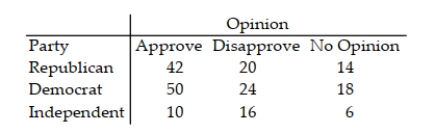 Test the claim of independence. Use α = .05.
Test the claim of independence. Use α = .05. سؤال
A business professor conducted a campus survey to estimate demand among all students for a protein supplement for smoothies and other nutritional drinks. Each of 113 students, randomly selected from all students on campus, provided the following information: (1) How health conscious are you? (Very, Moderately, Slightly, Not very) (2) Do you prefer protein supplements in your smoothies? (Yes, No) As part of his analysis, the professor claims that whether or not the student prefers a protein supplement in smoothies is independent of health consciousness level (Very, Moderate, Slightly, or Not very). Use the chi-square distribution to determine the rejection region for this test when testing at α = 0.05. 
سؤال
سؤال
سؤال
The contingency table below shows the results of a random sample of 200 state representatives that was conducted to see whether their opinions on a bill are related to their party affiliations. Use α = 0.05. Party Approve Disapprove No Opinion 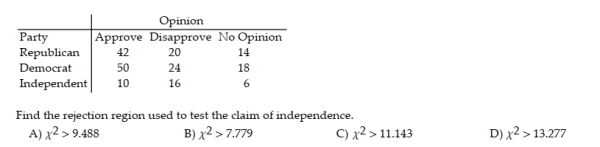
سؤال
Economists at USF are researching the problem of absenteeism at U.S. firms. A random sample of 100 U.S. organizations was selected to participate in a 1-year study. As part of the study, the economists had collected data on the following two variables for each company: shiftwork available (Yes or No), and union-management relationship (Good or Poor). As part of their analyses, the economists wanted to determine whether or not a company makes shiftwork available depends on the relationship between union and management. The collected data are shown below: 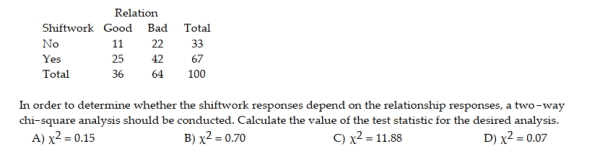
سؤال
A professor chose a random sample of 50 recent graduates of an MBA program and recorded the gender of each graduate (M or F) and whether the graduate chose to complete his or her degree requirements by completing a research project (RP) or by taking comprehensive exams (CE). The results are shown below. 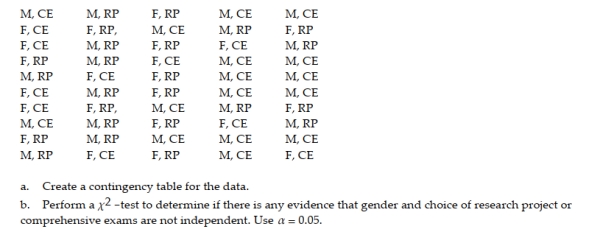
سؤال
Consider the accompanying contingency table. 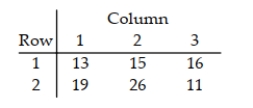 a. Convert the values in row 1 to percentages by calculating the percentage of each column total falling in row 1. b. Create a bar graph with row 1 percentage on the vertical axis and column number on the horizontal axis. c. What pattern do you expect to see if the rows and columns are not independent? Is this pattern present in your graph? 13.4 A Word of Caution about Chi-Square Tests 1 Understand Assumptions of Chi-Square Tests
a. Convert the values in row 1 to percentages by calculating the percentage of each column total falling in row 1. b. Create a bar graph with row 1 percentage on the vertical axis and column number on the horizontal axis. c. What pattern do you expect to see if the rows and columns are not independent? Is this pattern present in your graph? 13.4 A Word of Caution about Chi-Square Tests 1 Understand Assumptions of Chi-Square Tests سؤال
سؤال
A drug company developed a honey-based liquid medicine designed to calm a child's cough at night. To test the drug, 105 children who were ill with an upper respiratory tract infection were randomly selected to participate in a clinical trial. The children were randomly divided into three groups - one group was given a dosage of the honey drug, the second was given a dosage of liquid DM (an over-the-counter cough medicine), and the third (control group) received a liquid placebo (no dosage at all). After administering the medicine to their coughing child, parents rated their children's cough diagnosis as either better or worse. The results are shown in the table below: 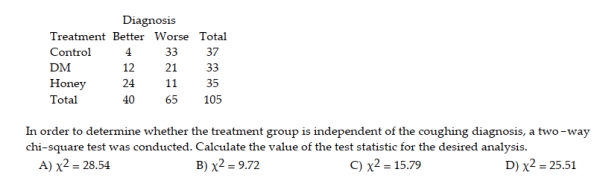
سؤال
سؤال
The data below show the age and favorite type of music of 779 randomly selected people. Test the claim that age and preferred music type are independent. Use α = 0.05. 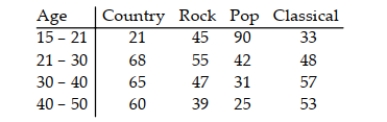

فتح الحزمة
قم بالتسجيل لفتح البطاقات في هذه المجموعة!
Unlock Deck
Unlock Deck
1/60
العب
ملء الشاشة (f)
Deck 13: Categorical Data Analysis
1
A
2
Many track runners believe that they have a better chance of winning if they start in the inside lane that is closest to the field. For the data below, the lane closest to the field is Lane 1, the next lane is Lane 2, and so on until the outermost lane, Lane 6. The table displays the starting positions for the winnners of 240 competitions. Calculate the chi-square test statistic used to test the claim that the probability of winning is the same regardless of starting position..
A) 6.750
B) 9.326
C) 12.592
D) 15.541
A) 6.750
B) 9.326
C) 12.592
D) 15.541
6.750
3
Use the appropriate table to find the following probability:
A) 0.990
B) 0.010
C) 0.995
D) 0.005
A) 0.990
B) 0.010
C) 0.995
D) 0.005
0.990
4
A multinomial experiment with k = 3 cells and n =100 has been conducted and the results are shown in the table. Construct a 99% confidence interval for the multinomial probability associated with cell 2. 3 Perform One-Way Chi Square Test
Construct a 99% confidence interval for the multinomial probability associated with cell 2. 3 Perform One-Way Chi Square Test فتح الحزمة
افتح القفل للوصول البطاقات البالغ عددها 60 في هذه المجموعة.
فتح الحزمة
k this deck
5
Inc. Technology reported the results of consumer survey in which 300 Internet users indicated their level of agreement with the following statement: "The government needs to be able to scan Internet messages and user communications to prevent fraud and other crimes." The possible responses were "agree strongly", "agree somewhat", "disagree somewhat", and "disagree strongly". The number of Internet users in each category is summarized in the table. In order to determine whether the true proportions of Internet users in each response category differ, a one-way chi-square analysis should be conducted. As part of that analysis, a 95% confidence interval for the multinomial probability associated with the "Agree Strongly" response was desired. Which of the following confidence intervals should be used?
A) (0.155, 0.245)
B) (0.162, 0.238)
C) (0.141, 0.259)
D) (0.145, 0.255)
A) (0.155, 0.245)
B) (0.162, 0.238)
C) (0.141, 0.259)
D) (0.145, 0.255)
فتح الحزمة
افتح القفل للوصول البطاقات البالغ عددها 60 في هذه المجموعة.
فتح الحزمة
k this deck
6
Many track runners believe that they have a better chance of winning if they start in the inside lane that is closest to the field. For the data below, the lane closest to the field is Lane 1, the next lane is Lane 2, and so on until the outermost lane, Lane 6. The table displays the starting positions for the winners of 240 competitions. Find the rejection region used to test the claim that the probability of winning is the same regardless of starting position. Use α = 0.05. The results are based on 240 wins.
فتح الحزمة
افتح القفل للوصول البطاقات البالغ عددها 60 في هذه المجموعة.
فتح الحزمة
k this deck
7
فتح الحزمة
افتح القفل للوصول البطاقات البالغ عددها 60 في هذه المجموعة.
فتح الحزمة
k this deck
8
An adverse drug effect (ADE) is an unintended injury caused by prescribed medication. The table summarizes the proximal cause of 95 ADEs that resulted from a dosing error at a Boston hospital. 2 Construct Confidence Interval
2 Construct Confidence Interval فتح الحزمة
افتح القفل للوصول البطاقات البالغ عددها 60 في هذه المجموعة.
فتح الحزمة
k this deck
9
Many track runners believe that they have a better chance of winning if they start in the inside lane that is closest to the field. For the data below, the lane closest to the field is Lane 1, the next lane is Lane 2, and so on until the outermost lane, Lane 6. The table displays the starting positions for the winners of 240 competitions. Test the claim that the probability of winning is the same regardless of starting position. Use α = 0.05. The results are based on 240 wins.
فتح الحزمة
افتح القفل للوصول البطاقات البالغ عددها 60 في هذه المجموعة.
فتح الحزمة
k this deck
10
A multinomial experiment with k = 4 cells and n = 400 produced the data shown in the following table.
فتح الحزمة
افتح القفل للوصول البطاقات البالغ عددها 60 في هذه المجموعة.
فتح الحزمة
k this deck
11
What is categorical data? 13.2 Testing Categorical Probabilities: One-Way Table 1 Use Chi-Square Distribution
فتح الحزمة
افتح القفل للوصول البطاقات البالغ عددها 60 في هذه المجموعة.
فتح الحزمة
k this deck
12
A new coffeehouse wishes to see whether customers have any preference among 5 different brands of coffee. A sample of 200 customers provided the data below. Test the claim that the probabilities show no preference. Use α = 0.01. Brand 1 2 3 4 5 Customers 32 65 55 30 18
فتح الحزمة
افتح القفل للوصول البطاقات البالغ عددها 60 في هذه المجموعة.
فتح الحزمة
k this deck
13
A multinomial experiment with k = 4 cells and n = 300 produced the data shown in the following table.
فتح الحزمة
افتح القفل للوصول البطاقات البالغ عددها 60 في هذه المجموعة.
فتح الحزمة
k this deck
14
Inc. Technology reported the results of consumer survey in which 300 Internet users indicated their level of agreement with the following statement: "The government needs to be able to scan Internet messages and user communications to prevent fraud and other crimes." The possible responses were "agree strongly", "agree somewhat", "disagree somewhat", and "disagree strongly". The number of Internet users in each category is summarized in the table. In order to determine whether the true proportions of Internet users in each response category differ, a one-way chi-square analysis should be conducted. As part of that analysis, a 90% confidence interval for the multinomial probability associated with the "Disagree Somewhat" response was desired. Which of the following confidence intervals should be used?
A) (0.206, 0.327)
B) (0.216, 0.317)
C) (0.225, 0.309)
D) (0.201, 0.332)
A) (0.206, 0.327)
B) (0.216, 0.317)
C) (0.225, 0.309)
D) (0.201, 0.332)
فتح الحزمة
افتح القفل للوصول البطاقات البالغ عددها 60 في هذه المجموعة.
فتح الحزمة
k this deck
15
Use the appropriate table to find the following chi-square value: for df = 6.
A) 10.645
B) 2.204
C) 9.236
D) 12.017
A) 10.645
B) 2.204
C) 9.236
D) 12.017
فتح الحزمة
افتح القفل للوصول البطاقات البالغ عددها 60 في هذه المجموعة.
فتح الحزمة
k this deck
16
A coffeehouse wishes to see if customers have any preference among 5 different brands of coffee. A sample of 200 customers provided the data below. Find the rejection region used to test the claim that the probabilities show no preference. Use α = 0.01.
فتح الحزمة
افتح القفل للوصول البطاقات البالغ عددها 60 في هذه المجموعة.
فتح الحزمة
k this deck
17
Inc. Technology reported the results of consumer survey in which 300 Internet users indicated their level of agreement with the following statement: "The government needs to be able to scan Internet messages and user communications to prevent fraud and other crimes." The possible responses were "agree strongly", "agree somewhat", "disagree somewhat", and "disagree strongly". The number of Internet users in each category is summarized in the table.
فتح الحزمة
افتح القفل للوصول البطاقات البالغ عددها 60 في هذه المجموعة.
فتح الحزمة
k this deck
18
What are characteristics of the trials in a multinomial experiment?
فتح الحزمة
افتح القفل للوصول البطاقات البالغ عددها 60 في هذه المجموعة.
فتح الحزمة
k this deck
19
A survey of entrepreneurs focused on their job characteristics, work habits, social activities, leisure time, etc. One question put to each entrepreneur was, "What make of car (U.S., Europe, or Japan) do you drive?" The responses (number in each category) for a sample of 100 entrepreneurs are summarized below. The goal of the analysis is to determine if the proportions of entrepreneurs who drive American, European, and Japanese cars differ. U.S. Europe Japan
فتح الحزمة
افتح القفل للوصول البطاقات البالغ عددها 60 في هذه المجموعة.
فتح الحزمة
k this deck
20
Describe probabilities of the k outcomes of the multinomial experiment trials.
فتح الحزمة
افتح القفل للوصول البطاقات البالغ عددها 60 في هذه المجموعة.
فتح الحزمة
k this deck
21
Economists at USF are researching the problem of absenteeism at U.S. firms. A random sample of 100 U.S. organizations was selected to participate in a 1-year study. As part of the study, the economists had collected data on the following two variables for each company: shiftwork available (Yes or No), and union-management relationship (Good or Poor). As part of their analyses, the economists wanted to determine whether or not a company makes shiftwork available depends on the relationship between union and management. The collected data are shown below:
فتح الحزمة
افتح القفل للوصول البطاقات البالغ عددها 60 في هذه المجموعة.
فتح الحزمة
k this deck
22
Find the rejection region for a test of independence of two classifications where the contingency table contains r = 2 rows and c = 4 columns and α = .10.
فتح الحزمة
افتح القفل للوصول البطاقات البالغ عددها 60 في هذه المجموعة.
فتح الحزمة
k this deck
23
A teacher finds that final grades in the statistics department are distributed as: A, 25%; B, 25%; C, 40%; D, 5%; F, 5%. At the end of a randomly selected semester, the following grades were recorded. Find the rejection region used to determine if the grade distribution for the department is different than expected. Use α = 0.01.
فتح الحزمة
افتح القفل للوصول البطاقات البالغ عددها 60 في هذه المجموعة.
فتح الحزمة
k this deck
24
A survey of entrepreneurs focused on their job characteristics, work habits, social activities, leisure time, etc. One question put to each entrepreneur was, "What make of car (U.S., Europe, or Japan) do you drive?" The responses (number in each category) for a sample of 100 entrepreneurs are summarized below. The goal of the analysis is to determine if the proportions of entrepreneurs who drive American, European, and Japanese cars differ. In order to determine whether the true proportions in each response category differ, a one-way chi-square analysis should be conducted. Suppose the p-value for the test was calculated to be p = 0.1738. What is the appropriate conclusion to make when testing at α = 0.10?
A) There is sufficient evidence to indicate the proportion of entrepreneurs driving the three makes of car differ.
B) There is insufficient evidence to indicate the proportion of entrepreneurs driving the three makes of car differ.
C) There is sufficient evidence to indicate the proportion of entrepreneurs driving Japanese cars is less than the proportion driving U.S. cars.
D) There is sufficient evidence to indicate the proportion of entrepreneurs driving the three makes of car are equal.
فتح الحزمة
افتح القفل للوصول البطاقات البالغ عددها 60 في هذه المجموعة.
فتح الحزمة
k this deck
25
A survey of entrepreneurs focused on their job characteristics, work habits, social activities, leisure time, etc. One question put to each entrepreneur was, "What make of car (U.S., Europe, or Japan) do you drive?" The responses (number in each category) for a sample of 100 entrepreneurs are summarized below. The goal of the analysis is to determine if the proportions of entrepreneurs who drive American, European, and Japanese cars differ.
فتح الحزمة
افتح القفل للوصول البطاقات البالغ عددها 60 في هذه المجموعة.
فتح الحزمة
k this deck
26
A sports researcher is interested in determining if there is a relationship between the number of home team and visiting team wins and different sports. A random sample of 526 games is selected and the results are given below. Assuming the row and column classifications are independent, find an estimate for the expected cell count of cell .
A) 106.4
B) 18.7
C) 144.6
D) 25.3
A) 106.4
B) 18.7
C) 144.6
D) 25.3
فتح الحزمة
افتح القفل للوصول البطاقات البالغ عددها 60 في هذه المجموعة.
فتح الحزمة
k this deck
27
فتح الحزمة
افتح القفل للوصول البطاقات البالغ عددها 60 في هذه المجموعة.
فتح الحزمة
k this deck
28
A survey of entrepreneurs focused on their job characteristics, work habits, social activities, leisure time, etc. One question put to each entrepreneur was, "What make of car (U.S., Europe, or Japan) do you drive?" The responses (number in each category) for a sample of 100 entrepreneurs are summarized below. The goal of the analysis is to determine if the proportions of entrepreneurs who drive American, European, and Japanese cars differ. In order to determine whether the true proportions in each response category differ, a one-way chi-square analysis should be conducted. As part of that analysis, a 95% confidence interval for the multinomial probability associated with the "Europe" response was desired. Which of the following confidence intervals should be used?
A) (0.271, 0.428)
B) (0.265, 0.440)
C) (0.257, 0.443)
D) (0.227, 0.473)
A) (0.271, 0.428)
B) (0.265, 0.440)
C) (0.257, 0.443)
D) (0.227, 0.473)
فتح الحزمة
افتح القفل للوصول البطاقات البالغ عددها 60 في هذه المجموعة.
فتح الحزمة
k this deck
29
The contingency table below shows the results of a random sample of 200 state representatives that was conducted to see whether their opinions on a bill are related to their party affiliations. Assuming the row and column classifications are independent, find an estimate for the expected cell count .
A) 27.6
B) 22.8
C) 46.92
D) 17.48
A) 27.6
B) 22.8
C) 46.92
D) 17.48
فتح الحزمة
افتح القفل للوصول البطاقات البالغ عددها 60 في هذه المجموعة.
فتح الحزمة
k this deck
30
Inc. Technology reported the results of consumer survey in which 300 Internet users indicated their level of agreement with the following statement: "The government needs to be able to scan Internet messages and user communications to prevent fraud and other crimes." The possible responses were "agree strongly", "agree somewhat", "disagree somewhat", and "disagree strongly". The number of Internet users in each category is summarized in the table.
فتح الحزمة
افتح القفل للوصول البطاقات البالغ عددها 60 في هذه المجموعة.
فتح الحزمة
k this deck
31
A drug company developed a honey-based liquid medicine designed to calm a child's cough at night. To test the drug, 105 children who were ill with an upper respiratory tract infection were randomly selected to participate in a clinical trial. The children were randomly divided into three groups - one group was given a dosage of the honey drug, the second was given a dosage of liquid DM (an over-the-counter cough medicine), and the third (control group) received a liquid placebo (no dosage at all). After administering the medicine to their coughing child, parents rated their children's cough diagnosis as either better or worse. The results are shown in the table below:
فتح الحزمة
افتح القفل للوصول البطاقات البالغ عددها 60 في هذه المجموعة.
فتح الحزمة
k this deck
32
Inc. Technology reported the results of consumer survey in which 300 Internet users indicated their level of agreement with the following statement: "The government needs to be able to scan Internet messages and user communications to prevent fraud and other crimes." The possible responses were "agree strongly", "agree somewhat", "disagree somewhat", and "disagree strongly". The number of Internet users in each category is summarized in the table.
فتح الحزمة
افتح القفل للوصول البطاقات البالغ عددها 60 في هذه المجموعة.
فتح الحزمة
k this deck
33
A random sample of 160 car accidents are selected and categorized by the age of the driver determined to be at fault. The results are listed below. The age distribution of drivers for the given categories is 18% for the under 26 group, 39% for the 26-45 group, 31% for the 45-65 group, and 12% for the group over 65. Find the rejection region used to test the claim that all ages have crash rates proportional to their number of drivers. Use α = 0.05.
فتح الحزمة
افتح القفل للوصول البطاقات البالغ عددها 60 في هذه المجموعة.
فتح الحزمة
k this deck
34
A teacher finds that final grades in the statistics department are distributed as: A, 25%; B, 25%; C, 40%; D, 5%; F, 5%. At the end of a randomly selected semester, the following grades were recorded. Determine if the grade distribution for the department is different than expected. Use α = 0.01.
فتح الحزمة
افتح القفل للوصول البطاقات البالغ عددها 60 في هذه المجموعة.
فتح الحزمة
k this deck
35
Test the null hypothesis of independence of the two classifications, A and B, of the 3 × 3 contingency table shown below. Test using α = .10.
فتح الحزمة
افتح القفل للوصول البطاقات البالغ عددها 60 في هذه المجموعة.
فتح الحزمة
k this deck
36
Inc. Technology reported the results of consumer survey in which 300 Internet users indicated their level of agreement with the following statement: "The government needs to be able to scan Internet messages and user communications to prevent fraud and other crimes." The possible responses were "agree strongly", "agree somewhat", "disagree somewhat", and "disagree strongly". The number of Internet users in each category is summarized in the table.
فتح الحزمة
افتح القفل للوصول البطاقات البالغ عددها 60 في هذه المجموعة.
فتح الحزمة
k this deck
37
A random sample of 160 car accidents are selected and categorized by the age of the driver determined to be at fault. The results are listed below. The age distribution of drivers for the given categories is 18% for the under 26 group, 39% for the 26-45 group, 31% for the 46-65 group, and 12% for the group over 65. Test the claim that all ages have crash rates proportional to their number of drivers. Use α = 0.05.
فتح الحزمة
افتح القفل للوصول البطاقات البالغ عددها 60 في هذه المجموعة.
فتح الحزمة
k this deck
38
A random sample of 160 car accidents are selected and categorized by the age of the driver determined to be at fault. The results are listed below. The age distribution of drivers for the given categories is for the under 26 group, for the 26-45 group, 31\% for the 45-65 group, and 12\% for the group over 65 . Calculate the chi-square test statistic used to test the claim that all ages have crash rates proportional to their driving rates.
A) 75.101
B) 85.123
C) 101.324
D) 95.431
A) 75.101
B) 85.123
C) 101.324
D) 95.431
فتح الحزمة
افتح القفل للوصول البطاقات البالغ عددها 60 في هذه المجموعة.
فتح الحزمة
k this deck
39
A multinomial experiment with k = 3 cells and n =30 has been conducted and the results are shown in the table.
فتح الحزمة
افتح القفل للوصول البطاقات البالغ عددها 60 في هذه المجموعة.
فتح الحزمة
k this deck
40
The null hypothesis for a test of data resulting from a multinomial experiment is given as . What is the alternative hypothesis for the test? 13.3 Testing Categorical Probabilities: Two-Way (Contingency) Table 1 Use Chi-Square Distribution
. What is the alternative hypothesis for the test? 13.3 Testing Categorical Probabilities: Two-Way (Contingency) Table 1 Use Chi-Square Distribution فتح الحزمة
افتح القفل للوصول البطاقات البالغ عددها 60 في هذه المجموعة.
فتح الحزمة
k this deck
41
Economists at USF are researching the problem of absenteeism at U.S. firms. A random sample of 100 U.S. organizations was selected to participate in a 1-year study. As part of the study, the economists had collected data on the following two variables for each company: shiftwork available (Yes or No), and union-management relationship (Good or Poor). As part of their analyses, the economists wanted to determine whether or not a company makes shiftwork available depends on the relationship between union and management. The collected data are shown below:
فتح الحزمة
افتح القفل للوصول البطاقات البالغ عددها 60 في هذه المجموعة.
فتح الحزمة
k this deck
42
A sports researcher is interested in determining if there is a relationship between the number of home team and visiting team wins and different sports. A random sample of 526 games is selected and the results are given below. Find the rejection region used to test the claim that the number of home team and visiting team wins is independent of the sport. Use α = 0.01.
فتح الحزمة
افتح القفل للوصول البطاقات البالغ عددها 60 في هذه المجموعة.
فتح الحزمة
k this deck
43
Inc. Technology reported the results of consumer survey in which 300 Internet users indicated their level of agreement with the following statement: "The government needs to be able to scan Internet messages and user communications to prevent fraud and other crimes." The possible responses were "agree strongly", "agree somewhat", "disagree somewhat", and "disagree strongly". The number of Internet users in each category is summarized in the table. In order to determine whether the true proportions of Internet users in each response category differ, a one-way chi-square analysis should be conducted. Which of the following statements is not necessary for the analysis to be valid?
A) The 300 internet users sampled are independent from one another.
B) The probabilities for the four response outcomes remain the same from one internet user to the next.
C) The expected cell counts all must be 30 or more.
A) The 300 internet users sampled are independent from one another.
B) The probabilities for the four response outcomes remain the same from one internet user to the next.
C) The expected cell counts all must be 30 or more.
فتح الحزمة
افتح القفل للوصول البطاقات البالغ عددها 60 في هذه المجموعة.
فتح الحزمة
k this deck
44
The contingency table below shows the results of a random sample of 200 state representatives that was conducted to see whether their opinions on a bill are related to their party affiliation. Party Approve Disapprove No Opinion Find the chi-square test statistic χ2 used to test the claim of independence.
A) 8.030
B) 11.765
C) 7.662
D) 9.483
A) 8.030
B) 11.765
C) 7.662
D) 9.483
فتح الحزمة
افتح القفل للوصول البطاقات البالغ عددها 60 في هذه المجموعة.
فتح الحزمة
k this deck
45
The χ2-test for independence is a useful tool for establishing a causal relationship between two factors.
فتح الحزمة
افتح القفل للوصول البطاقات البالغ عددها 60 في هذه المجموعة.
فتح الحزمة
k this deck
46
A sports researcher is interested in determining if there is a relationship between the number of home team and visiting team wins and different sports. A random sample of 526 games is selected and the results are given below. Test the claim that the number of home team and visiting team wins is independent of the sport. Use α = 0.01.
فتح الحزمة
افتح القفل للوصول البطاقات البالغ عددها 60 في هذه المجموعة.
فتح الحزمة
k this deck
47
In a test of independence, it is safe to conclude that the events are independent when the value of χ2 is very small.
فتح الحزمة
افتح القفل للوصول البطاقات البالغ عددها 60 في هذه المجموعة.
فتح الحزمة
k this deck
48
The sampling distribution for χ2 works well when expected counts are very small.
فتح الحزمة
افتح القفل للوصول البطاقات البالغ عددها 60 في هذه المجموعة.
فتح الحزمة
k this deck
49
The contingency table below shows the results of a random sample of 200 state representatives that was conducted to see whether their opinions on a bill are related to their party affiliations. Party Approve Disapprove No Opinion Test the claim of independence. Use α = .05.
Test the claim of independence. Use α = .05. فتح الحزمة
افتح القفل للوصول البطاقات البالغ عددها 60 في هذه المجموعة.
فتح الحزمة
k this deck
50
A business professor conducted a campus survey to estimate demand among all students for a protein supplement for smoothies and other nutritional drinks. Each of 113 students, randomly selected from all students on campus, provided the following information: (1) How health conscious are you? (Very, Moderately, Slightly, Not very) (2) Do you prefer protein supplements in your smoothies? (Yes, No) As part of his analysis, the professor claims that whether or not the student prefers a protein supplement in smoothies is independent of health consciousness level (Very, Moderate, Slightly, or Not very). Use the chi-square distribution to determine the rejection region for this test when testing at α = 0.05.
فتح الحزمة
افتح القفل للوصول البطاقات البالغ عددها 60 في هذه المجموعة.
فتح الحزمة
k this deck
51
A sports researcher is interested in determining if there is a relationship between the number of home team and visiting team wins and different sports. A random sample of 526 games is selected and the results are given below. Calculate the chi-square test statistic used to test the claim that the number of home team and visiting team wins is independent of the sport. Use .
A) 3.290
B) 2.919
C) 5.391
D) 4.192
A) 3.290
B) 2.919
C) 5.391
D) 4.192
فتح الحزمة
افتح القفل للوصول البطاقات البالغ عددها 60 في هذه المجموعة.
فتح الحزمة
k this deck
52
A drug company developed a honey-based liquid medicine designed to calm a child's cough at night. To test the drug, 105 children who were ill with an upper respiratory tract infection were randomly selected to participate in a clinical trial. The children were randomly divided into three groups - one group was given a dosage of the honey drug, the second was given a dosage of liquid DM (an over-the-counter cough medicine), and the third (control group) received a liquid placebo (no dosage at all). After administering the medicine to their coughing child, parents rated their children's cough diagnosis as either better or worse. The results are shown in the table below:
In order to determine whether the treatment group is independent of the coughing diagnosis, a two -way chi-square test was conducted. Suppose the p-value for the test was calculated to be p = 0.0016. What is the appropriate conclusion to make when testing at α = 0.05?
A) There is sufficient evidence to indicate the treatment group is independent of the coughing diagnosis.
B) There is sufficient evidence to indicate the treatment group is dependent on the coughing diagnosis.
C) There is insufficient evidence to indicate the treatment group is dependent on the coughing diagnosis.
D) There is insufficient evidence to indicate the treatment group is independent of the coughing diagnosis.
فتح الحزمة
افتح القفل للوصول البطاقات البالغ عددها 60 في هذه المجموعة.
فتح الحزمة
k this deck
53
The contingency table below shows the results of a random sample of 200 state representatives that was conducted to see whether their opinions on a bill are related to their party affiliations. Use α = 0.05. Party Approve Disapprove No Opinion
فتح الحزمة
افتح القفل للوصول البطاقات البالغ عددها 60 في هذه المجموعة.
فتح الحزمة
k this deck
54
Economists at USF are researching the problem of absenteeism at U.S. firms. A random sample of 100 U.S. organizations was selected to participate in a 1-year study. As part of the study, the economists had collected data on the following two variables for each company: shiftwork available (Yes or No), and union-management relationship (Good or Poor). As part of their analyses, the economists wanted to determine whether or not a company makes shiftwork available depends on the relationship between union and management. The collected data are shown below:
فتح الحزمة
افتح القفل للوصول البطاقات البالغ عددها 60 في هذه المجموعة.
فتح الحزمة
k this deck
55
A professor chose a random sample of 50 recent graduates of an MBA program and recorded the gender of each graduate (M or F) and whether the graduate chose to complete his or her degree requirements by completing a research project (RP) or by taking comprehensive exams (CE). The results are shown below.
فتح الحزمة
افتح القفل للوصول البطاقات البالغ عددها 60 في هذه المجموعة.
فتح الحزمة
k this deck
56
Consider the accompanying contingency table. a. Convert the values in row 1 to percentages by calculating the percentage of each column total falling in row 1. b. Create a bar graph with row 1 percentage on the vertical axis and column number on the horizontal axis. c. What pattern do you expect to see if the rows and columns are not independent? Is this pattern present in your graph? 13.4 A Word of Caution about Chi-Square Tests 1 Understand Assumptions of Chi-Square Tests
a. Convert the values in row 1 to percentages by calculating the percentage of each column total falling in row 1. b. Create a bar graph with row 1 percentage on the vertical axis and column number on the horizontal axis. c. What pattern do you expect to see if the rows and columns are not independent? Is this pattern present in your graph? 13.4 A Word of Caution about Chi-Square Tests 1 Understand Assumptions of Chi-Square Tests فتح الحزمة
افتح القفل للوصول البطاقات البالغ عددها 60 في هذه المجموعة.
فتح الحزمة
k this deck
57
A business professor conducted a campus survey to estimate demand among all students for a protein supplement for smoothies and other nutritional drinks. Each of 113 students, randomly selected from all students on campus, provided the following information: (1) How health conscious are you? (Very, Moderately, Slightly, Not very) (2) Do you prefer protein supplements in your smoothies? (Yes, No) As part of his analysis, the professor claims that whether or not the student prefers a protein supplement in smoothies is independent of health consciousness level (Very, Moderate, Slightly, or Not very). Identify the appropriate alternative hypothesis that the professor should use in the test of hypothesis he desires.
A) HA: Preference and Health Consciousness level are independent variables.
B) HA: Preference and Health Consciousness level are dependent variables.
C) HA: There is interaction between the Preference and Health Consciousness variables.
D) HA: Preference and Health Consciousness level are mutually exclusive variables.
فتح الحزمة
افتح القفل للوصول البطاقات البالغ عددها 60 في هذه المجموعة.
فتح الحزمة
k this deck
58
A drug company developed a honey-based liquid medicine designed to calm a child's cough at night. To test the drug, 105 children who were ill with an upper respiratory tract infection were randomly selected to participate in a clinical trial. The children were randomly divided into three groups - one group was given a dosage of the honey drug, the second was given a dosage of liquid DM (an over-the-counter cough medicine), and the third (control group) received a liquid placebo (no dosage at all). After administering the medicine to their coughing child, parents rated their children's cough diagnosis as either better or worse. The results are shown in the table below:
فتح الحزمة
افتح القفل للوصول البطاقات البالغ عددها 60 في هذه المجموعة.
فتح الحزمة
k this deck
59
When using any procedure to perform a hypothesis test, the user should always be certain that the experiment satisfies the assumptions given with the procedure.
فتح الحزمة
افتح القفل للوصول البطاقات البالغ عددها 60 في هذه المجموعة.
فتح الحزمة
k this deck
60
The data below show the age and favorite type of music of 779 randomly selected people. Test the claim that age and preferred music type are independent. Use α = 0.05.
فتح الحزمة
افتح القفل للوصول البطاقات البالغ عددها 60 في هذه المجموعة.
فتح الحزمة
k this deck
فتح الحزمة
افتح القفل للوصول البطاقات البالغ عددها 60 في هذه المجموعة.


