Deck 19: Comparing Counts
ملء الشاشة (f)
سؤال
سؤال
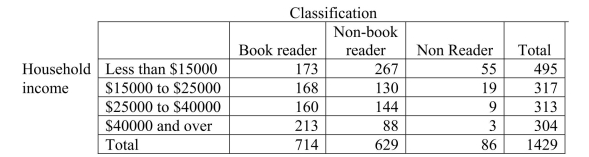
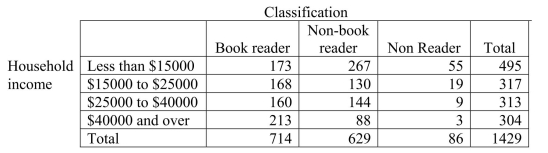
The Book Industry Study Group, InC.performs sample surveys to obtain information on characteristics of book readers.A book reader is defined to be one who read one or more books in the six months prior to the survey; a non-book reader is defined to be one who read newspapers or magazines but no books in the six months prior to the survey; a nonreader is defined to be one who did not read a book, newspaper, or magazine in the six months prior to the survey.The following data were obtained from a random sample of 1429 persons 16 years old and over in an effort to determine whether or not the proportions of book readers,non-book readers, and non-readers are the same for each income bracket.
A) : The classifications have the same distribution for each household income bracket. : The classifications do not have the same distribution for each household income bracket.
B) : The classifications do not have the same distribution for each household income bracket.
: The classifications have the same distribution for each household income bracket.
C) : There is a relationship between household income and book readership.
: Household income and book readership are not related.
D) : Household income and book readership are independent.
: Household income and book readership are not dependent.
E) : There is no relationship between household income and book readership.
: Household income and book readership are not related.
سؤال
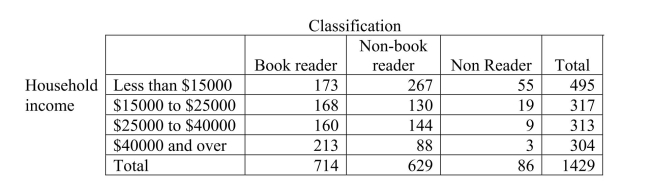
The Book Industry Study Group, InC.performs sample surveys to obtain information on characteristics of book readers.A book reader is defined to be one who read one or more books in the six months prior to the survey; a non-book reader is defined to be one who read newspapers or magazines but no books in the six months prior to the survey; a nonreader is defined to be one who did not read a book, newspaper, or magazine in the six months prior to the survey.The following data were obtained from a random sample of 1429 persons 16 years old and over in an effort to determine whether or not the proportions of book readers, non-book readers, and non-readers are the same for each income bracket.
A)Goodness-of-fit
B)Homogeneity
C)Independence
A)Goodness-of-fit
B)Homogeneity
C)Independence
سؤال
سؤال
سؤال
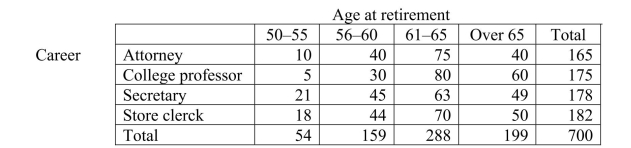
The following data were collected to determine whether or not the retirement age is the same for people in different professions. 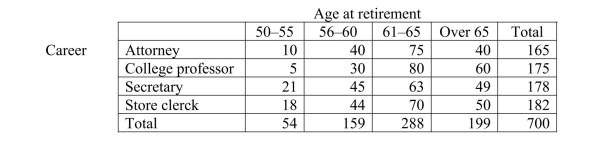
A) : The retirement age has the same distribution for people in the different professions.
: The retirement age has a different distribution for people in the different professions.
B) : Age at retirement and job are dependent.
: Age at retirement and job are not dependent.
C) : Age at retirement and job are related.
: Age at retirement and job are unrelated.
D) : The retirement age has a different distribution for people in the different professions.
: The retirement age has the same distribution for people in the different professions.
E) : Age at retirement and job are not independent.
: Age at retirement and job are dependent.
سؤال
سؤال
سؤال
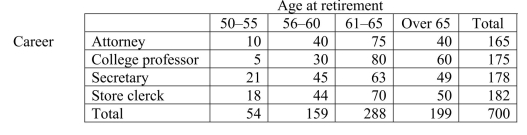
The following data were collected to determine whether or not the retirement age is the same for people in different professions.
-value
A) Reject the null hypothesis and conclude that the age at retirement is uniformly distributed for each career.
B) Reject the null hypothesis and conclude that career and retirement age are related.
C) Do not reject the null hypothesis and conclude that career and retirement age are independent.
D) Reject the null hypothesis and conclude that career and retirement age are independent.
E) Do not reject the null hypothesis and conclude that career and retirement age are related.
سؤال
سؤال
سؤال
سؤال
The following data were collected to determine whether or not the retirement age is the same for people in different professions.
A) Goodness-of-fit
B) Homogeneity
C) Independence
A) Goodness-of-fit
B) Homogeneity
C) Independence
سؤال
سؤال
The following data were collected to determine whether or not the retirement age is the same for people in different professions. 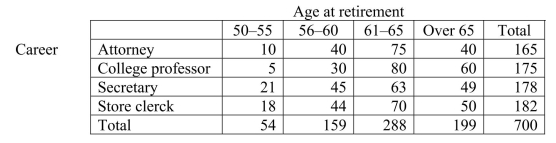
How many degrees of freedom are there for the chi-square test statistic?
A) 12
B) 25
C) 16
D) 9
E) 20
How many degrees of freedom are there for the chi-square test statistic?
A) 12
B) 25
C) 16
D) 9
E) 20
سؤال
سؤال
سؤال
The Book Industry Study Group, Inc.performs sample surveys to obtain information on characteristics of book readers.A book reader is defined to be one who read one or more books in the six months prior to the survey; a non-book reader is defined to be one who read newspapers or magazines but no books in the six months prior to the survey; a nonreader is defined to be one who did not read a book, newspaper, or magazine in the six months prior to the survey.The following data were obtained from a random sample of 1429 persons 16 years old and over in an effort to determine whether or not the proportions of book readers, non-book readers, and non-readers are the same for each income bracket.
-value
A) There is sufficient evidence to reject the null hypothesis and conclude that income and classification are independent.
B) There is sufficient evidence to reject the null hypothesis and conclude that income and classification are dependent.
C) There is sufficient evidence to reject the null hypothesis and conclude that the classifications are not uniformly distributed for each income bracket.
D) There is not sufficient evidence to reject the null hypothesis and conclude that income and classification are dependent.
E) There is not sufficient evidence to reject the null hypothesis and conclude that income and classification are independent.
سؤال
سؤال

فتح الحزمة
قم بالتسجيل لفتح البطاقات في هذه المجموعة!
Unlock Deck
Unlock Deck
1/20
العب
ملء الشاشة (f)
Deck 19: Comparing Counts
1
A candy company claims that its bags of mixed suckers are 20% strawberry, 30% cherry, 15% apple, 10% lemon, and 25% grapE.A bag was purchased, and the number of each typeof flavor was recorded in the chart below.
A) : The distribution of flavors is uniform.
: The distribution of flavors is not uniform.
B) : The flavors and counts are independent.
: The flavors and counts are not independent.
C) : The distribution of flavors is the same as the distribution claimed by the company.
: The distribution of flavors is not the same as the distribution claimed by the company.
D) : The distribution of flavors is not uniform.
: The distribution of flavors is uniform.
E) : The distribution of flavors is not the same as the distribution claimed by the company.
: The distribution of flavors is the same as the distribution claimed by the company.
: The distribution of flavors is the same as the distribution claimed by the company.
: The distribution of flavors is not the same as the distribution claimed by the company.
: The distribution of flavors is not the same as the distribution claimed by the company.
2
The Book Industry Study Group, InC.performs sample surveys to obtain information on characteristics of book readers.A book reader is defined to be one who read one or more books in the six months prior to the survey; a non-book reader is defined to be one who read newspapers or magazines but no books in the six months prior to the survey; a nonreader is defined to be one who did not read a book, newspaper, or magazine in the six months prior to the survey.The following data were obtained from a random sample of 1429 persons 16 years old and over in an effort to determine whether or not the proportions of book readers,non-book readers, and non-readers are the same for each income bracket.
A) : The classifications have the same distribution for each household income bracket. : The classifications do not have the same distribution for each household income bracket.
B) : The classifications do not have the same distribution for each household income bracket.
: The classifications have the same distribution for each household income bracket.
C) : There is a relationship between household income and book readership.
: Household income and book readership are not related.
D) : Household income and book readership are independent.
: Household income and book readership are not dependent.
E) : There is no relationship between household income and book readership.
: Household income and book readership are not related.
A) : The classifications have the same distribution for each household income bracket. : The classifications do not have the same distribution for each household income bracket.
B) : The classifications do not have the same distribution for each household income bracket.
: The classifications have the same distribution for each household income bracket.
C) : There is a relationship between household income and book readership.
: Household income and book readership are not related.
D) : Household income and book readership are independent.
: Household income and book readership are not dependent.
E) : There is no relationship between household income and book readership.
: Household income and book readership are not related.
: The classifications have the same distribution for each household income bracket. : The classifications do not have the same distribution for each household income bracket.
3
The Book Industry Study Group, InC.performs sample surveys to obtain information on characteristics of book readers.A book reader is defined to be one who read one or more books in the six months prior to the survey; a non-book reader is defined to be one who read newspapers or magazines but no books in the six months prior to the survey; a nonreader is defined to be one who did not read a book, newspaper, or magazine in the six months prior to the survey.The following data were obtained from a random sample of 1429 persons 16 years old and over in an effort to determine whether or not the proportions of book readers, non-book readers, and non-readers are the same for each income bracket.
A)Goodness-of-fit
B)Homogeneity
C)Independence
A)Goodness-of-fit
B)Homogeneity
C)Independence
Homogeneity
4
The data will be analyzed to determine if they provide sufficient evidence to conclude that an association exists between car color and the likelihood of being in an accident.
A)Goodness-of-fit
B)Homogeneity
C)Independence
A)Goodness-of-fit
B)Homogeneity
C)Independence
فتح الحزمة
افتح القفل للوصول البطاقات البالغ عددها 20 في هذه المجموعة.
فتح الحزمة
k this deck
5
A die, suspected of being unfair, was rolled 50 times.The number of times each face appeared was recorded in the following table.
A)Goodness-of-fit
B)Homogeneity
C)Independence
A)Goodness-of-fit
B)Homogeneity
C)Independence
فتح الحزمة
افتح القفل للوصول البطاقات البالغ عددها 20 في هذه المجموعة.
فتح الحزمة
k this deck
6
The following data were collected to determine whether or not the retirement age is the same for people in different professions.
A) : The retirement age has the same distribution for people in the different professions.
: The retirement age has a different distribution for people in the different professions.
B) : Age at retirement and job are dependent.
: Age at retirement and job are not dependent.
C) : Age at retirement and job are related.
: Age at retirement and job are unrelated.
D) : The retirement age has a different distribution for people in the different professions.
: The retirement age has the same distribution for people in the different professions.
E) : Age at retirement and job are not independent.
: Age at retirement and job are dependent.
فتح الحزمة
افتح القفل للوصول البطاقات البالغ عددها 20 في هذه المجموعة.
فتح الحزمة
k this deck
7
The data will be analyzed to determine if they provide sufficient evidence to conclude that an association exists between car color and the likelihood of being in an accident.
A) : Accidents and car color are independent.
: Accidents and car color are not related.
B) : Accidents and car color are related.
: Accidents and car color are not related.
C) : Accidents and car color are not related.
: Accidents and car color are not dependent.
D) : Accidents are uniformly distributed over the car colors.
: Accidents are not uniformly distributed over the car colors.
E) : Accidents and car color are independent.
: Accidents and car color are not independent.
فتح الحزمة
افتح القفل للوصول البطاقات البالغ عددها 20 في هذه المجموعة.
فتح الحزمة
k this deck
8
A candy company claims that its bags of mixed suckers are 20% strawberry, 30% cherry, 15% apple, 10% lemon, and 25% grapE.A bag was purchased, and the number of each typeof flavor was recorded in the chart below.
A)Goodness-of-fit
B)Homogeneity
C)Independence
A)Goodness-of-fit
B)Homogeneity
C)Independence
فتح الحزمة
افتح القفل للوصول البطاقات البالغ عددها 20 في هذه المجموعة.
فتح الحزمة
k this deck
9
The following data were collected to determine whether or not the retirement age is the same for people in different professions.
-value
A) Reject the null hypothesis and conclude that the age at retirement is uniformly distributed for each career.
B) Reject the null hypothesis and conclude that career and retirement age are related.
C) Do not reject the null hypothesis and conclude that career and retirement age are independent.
D) Reject the null hypothesis and conclude that career and retirement age are independent.
E) Do not reject the null hypothesis and conclude that career and retirement age are related.
فتح الحزمة
افتح القفل للوصول البطاقات البالغ عددها 20 في هذه المجموعة.
فتح الحزمة
k this deck
10
A die, suspected of being unfair, was rolled 50 times.The number of times each face
Appeared was recorded in the following table.
A) : The counts are not uniformly distributed over the faces.
: The counts are uniformly distributed over the faces.
B) : The counts and faces are independent.
: The counts and faces are not independent.
C) : The counts are normally distributed over the faces.
: The counts are not normally distributed over the faces.
D) : The counts and faces are not independent.
: The counts and faces are independent.
E) : The counts are uniformly distributed over the faces.
: The counts are not uniformly distributed over the faces.
فتح الحزمة
افتح القفل للوصول البطاقات البالغ عددها 20 في هذه المجموعة.
فتح الحزمة
k this deck
11
Vending machines on a college campus offer a variety of snacks.The purchasing agent believes that each type of snack is equally preferred by students and consequently orders equal quantities.The number of snacks sold from vending machines on this campus for the last six months is shown in the following tablE.If the purchasing agent is correct, how many candy bars would we expect to have been sold?
A)170
B)198
C)125
D)180
E)680
A)170
B)198
C)125
D)180
E)680
فتح الحزمة
افتح القفل للوصول البطاقات البالغ عددها 20 في هذه المجموعة.
فتح الحزمة
k this deck
12
Tests for adverse reactions to a new drug yielded the results given in the table.The data will be analyzed to determine if they provide sufficient evidence to conclude that an association exists between the treatment (drug or placebo) and the reaction (whether or not headaches were experienced).
A) : The occurrence of headaches is dependent upon the drug.
: The occurrence of headaches is not dependent upon the drug.
B) : The distribution of headaches is different for the drug and the placebo.
: The distribution of headaches is the same for the drug and the placebo.
C) : The drug is independent from the occurrence of headaches.
: The drug is not independent from the occurrence of headaches.
D) : There is a relationship between the drug and occurrence of headaches.
: There is no relationship between the drug and occurrence of headaches.
E) : The drug is related to the occurrence of headaches.
: The drug is not related to the occurrence of headaches.
فتح الحزمة
افتح القفل للوصول البطاقات البالغ عددها 20 في هذه المجموعة.
فتح الحزمة
k this deck
13
The following data were collected to determine whether or not the retirement age is the same for people in different professions.
A) Goodness-of-fit
B) Homogeneity
C) Independence
A) Goodness-of-fit
B) Homogeneity
C) Independence
فتح الحزمة
افتح القفل للوصول البطاقات البالغ عددها 20 في هذه المجموعة.
فتح الحزمة
k this deck
14
A manufacturing plant for recreational vehicles receives shipments from three different parts vendors.There has been a defect issue with some of the electrical wiring in the recreational vehicles manufactured at the plant.The plant manager believes that the defect issue is dependent on the parts vendor.The plant manager reviews a sample of quality assurance
Inspections from the last six months.
The correct value of the test statistic for determining if the plant manager's belief is supported is
A)
B)
C)
D)
E)
Inspections from the last six months.
The correct value of the test statistic for determining if the plant manager's belief is supported is
A)
B)
C)
D)
E)
فتح الحزمة
افتح القفل للوصول البطاقات البالغ عددها 20 في هذه المجموعة.
فتح الحزمة
k this deck
15
The following data were collected to determine whether or not the retirement age is the same for people in different professions.
How many degrees of freedom are there for the chi-square test statistic?
A) 12
B) 25
C) 16
D) 9
E) 20
How many degrees of freedom are there for the chi-square test statistic?
A) 12
B) 25
C) 16
D) 9
E) 20
فتح الحزمة
افتح القفل للوصول البطاقات البالغ عددها 20 في هذه المجموعة.
فتح الحزمة
k this deck
16
A manufacturing plant for recreational vehicles receives shipments from three different parts vendors.There has been a defect issue with some of the electrical wiring in the recreational
Vehicles manufactured at the plant.The plant manager believes that the defect issue is dependent on the parts vendor.The plant manager reviews a sample of quality assurance inspections from the last six months.The expected number of perfect parts from Made-4-U co.is
A)
B)
C) 71
D)
E) 252
Vehicles manufactured at the plant.The plant manager believes that the defect issue is dependent on the parts vendor.The plant manager reviews a sample of quality assurance inspections from the last six months.The expected number of perfect parts from Made-4-U co.is
A)
B)
C) 71
D)
E) 252
فتح الحزمة
افتح القفل للوصول البطاقات البالغ عددها 20 في هذه المجموعة.
فتح الحزمة
k this deck
17
Tests for adverse reactions to a new drug yielded the results given in the table.The data will be analyzed to determine if they provide sufficient evidence to conclude that an association exists between the treatment (drug or placebo) and the reaction (whether or not headaches were experienced).
A) Reject the null hypothesis. Report that there is insufficient evidence to conclude that drug and headaches are dependent.
B) Do not reject the null hypothesis. Report that there is insufficient evidence to conclude that the distribution of headaches is uniform for the drug and placebo.
C) Do not reject the null hypothesis. Report that there is insufficient evidence to conclude that drug and headaches are dependent.
D) Reject the null hypothesis. Report that there is sufficient evidence to conclude that drug and headaches are dependent.
E) Do not reject the null hypothesis. Report that there is sufficient evidence to conclude that drug and headaches are dependent.
فتح الحزمة
افتح القفل للوصول البطاقات البالغ عددها 20 في هذه المجموعة.
فتح الحزمة
k this deck
18
The Book Industry Study Group, Inc.performs sample surveys to obtain information on characteristics of book readers.A book reader is defined to be one who read one or more books in the six months prior to the survey; a non-book reader is defined to be one who read newspapers or magazines but no books in the six months prior to the survey; a nonreader is defined to be one who did not read a book, newspaper, or magazine in the six months prior to the survey.The following data were obtained from a random sample of 1429 persons 16 years old and over in an effort to determine whether or not the proportions of book readers, non-book readers, and non-readers are the same for each income bracket.
-value
A) There is sufficient evidence to reject the null hypothesis and conclude that income and classification are independent.
B) There is sufficient evidence to reject the null hypothesis and conclude that income and classification are dependent.
C) There is sufficient evidence to reject the null hypothesis and conclude that the classifications are not uniformly distributed for each income bracket.
D) There is not sufficient evidence to reject the null hypothesis and conclude that income and classification are dependent.
E) There is not sufficient evidence to reject the null hypothesis and conclude that income and classification are independent.
-value
A) There is sufficient evidence to reject the null hypothesis and conclude that income and classification are independent.
B) There is sufficient evidence to reject the null hypothesis and conclude that income and classification are dependent.
C) There is sufficient evidence to reject the null hypothesis and conclude that the classifications are not uniformly distributed for each income bracket.
D) There is not sufficient evidence to reject the null hypothesis and conclude that income and classification are dependent.
E) There is not sufficient evidence to reject the null hypothesis and conclude that income and classification are independent.
فتح الحزمة
افتح القفل للوصول البطاقات البالغ عددها 20 في هذه المجموعة.
فتح الحزمة
k this deck
19
Vending machines on a college campus offer a variety of snacks.The purchasing agent believes that each type of snack is equally preferred by students and consequently orders equal quantities.The number of snacks sold from vending machines on this campus for the last six months is shown in the following tablE.The correct value of the test statistic for determining if the purchasing agent's belief if supported is
A)
B)
C)
D)
E) None of the above.
A)
B)
C)
D)
E) None of the above.
فتح الحزمة
افتح القفل للوصول البطاقات البالغ عددها 20 في هذه المجموعة.
فتح الحزمة
k this deck
20
Tests for adverse reactions to a new drug yielded the results given in the table.The data will be analyzed to determine if there is sufficient evidence to conclude that an association exists between the treatment (drug or placebo) and the reaction (whether or not headaches were experienced).
A)Goodness-of-fit
B)Homogeneity
C)Independence
A)Goodness-of-fit
B)Homogeneity
C)Independence
فتح الحزمة
افتح القفل للوصول البطاقات البالغ عددها 20 في هذه المجموعة.
فتح الحزمة
k this deck
فتح الحزمة
افتح القفل للوصول البطاقات البالغ عددها 20 في هذه المجموعة.


