Deck 17: Comparing Groupspaired
ملء الشاشة (f)
سؤال
سؤال
سؤال
سؤال
سؤال
سؤال
سؤال
سؤال
سؤال
سؤال
سؤال
سؤال
سؤال
سؤال
سؤال
سؤال

فتح الحزمة
قم بالتسجيل لفتح البطاقات في هذه المجموعة!
Unlock Deck
Unlock Deck
1/16
العب
ملء الشاشة (f)
Deck 17: Comparing Groupspaired
1
A
2
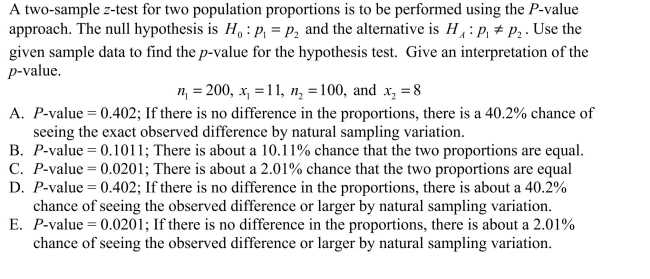
A researcher is interested in the academic performance differences between individuals using an optimistic versus a pessimistic approach to their studies.If the researcher fails to find a significant difference, when in fact one exists in the population:
A)the null hypothesis was correctly accepted.
B)the research hypothesis was correctly accepted.
C)the null hypothesis was correctly rejected.
D)a Type 2 error has been made.
E)a Type 1 error has been made.
A)the null hypothesis was correctly accepted.
B)the research hypothesis was correctly accepted.
C)the null hypothesis was correctly rejected.
D)a Type 2 error has been made.
E)a Type 1 error has been made.
a Type 2 error has been made.
3
A consumer advocate decided to investigate the average wait time for a table for one at two local restaurants.Eighteen customers were sent to each restaurant at the same randomly selected times and the time they waited for a table was recorded in minutes.The followingsample data was obtained.
Find a confidence interval for the difference, , between the mean wait time for restaurant and the mean wait time for restaurant .
A)
B)
C)
D)
E)
Find a confidence interval for the difference, , between the mean wait time for restaurant and the mean wait time for restaurant .
A)
B)
C)
D)
E)
4
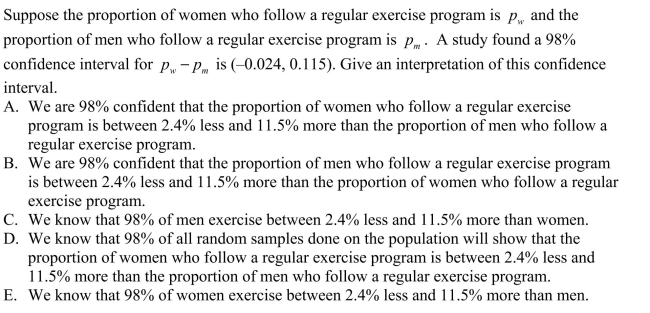
A survey of randomly chosen adults found that 38 of the 61 women and 46 of the 83 men follow regular exercise programs.Construct a 95% confidence interval for the difference in the proportions of women and men who have regular exercise programs.
A)(-0.124, 0.786)
B)(-0.093, 0.231)
C)(-0.124, 0.815)
D)(0.460, 0.786)
E)(0.430, 0.815)
A)(-0.124, 0.786)
B)(-0.093, 0.231)
C)(-0.124, 0.815)
D)(0.460, 0.786)
E)(0.430, 0.815)
فتح الحزمة
افتح القفل للوصول البطاقات البالغ عددها 16 في هذه المجموعة.
فتح الحزمة
k this deck
5
فتح الحزمة
افتح القفل للوصول البطاقات البالغ عددها 16 في هذه المجموعة.
فتح الحزمة
k this deck
6
A researcher was interested in comparing the number of hours of television watched each day by two-year-olds and three-year-olds.A random sample of 18 two-year-olds and
Find a confidence interval for the difference, , between the mean number of hours for two-year-olds and the mean number of hours for three-year-olds ( ).
A)
B)
C)
D)
E)
18 three-year-olds yielded the follow data.
Find a confidence interval for the difference, , between the mean number of hours for two-year-olds and the mean number of hours for three-year-olds ( ).
A)
B)
C)
D)
E)
18 three-year-olds yielded the follow data.
فتح الحزمة
افتح القفل للوصول البطاقات البالغ عددها 16 في هذه المجموعة.
فتح الحزمة
k this deck
7
Two types of flares are tested for their burning times (in minutes) and sample results are given below.
Brand A:
Brand B:
Construct a confidence interval for the difference based on the sample data.
A)
B)
C)
D)
E)
Brand A:
Brand B:
Construct a confidence interval for the difference based on the sample data.
A)
B)
C)
D)
E)
فتح الحزمة
افتح القفل للوصول البطاقات البالغ عددها 16 في هذه المجموعة.
فتح الحزمة
k this deck
8
فتح الحزمة
افتح القفل للوصول البطاقات البالغ عددها 16 في هذه المجموعة.
فتح الحزمة
k this deck
9
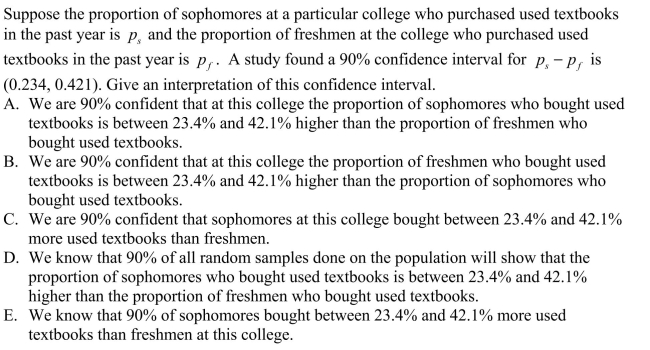
A survey of randomly selected college students found that 45 of the 99 freshmen and 57 of the 100 sophomores surveyed had purchased used textbooks in the past year.Construct a 98% confidence interval for the difference in the proportions of college freshmen and sophomores who purchased used textbooks.
A)(0.317, 0.593)
B)(0.291, 0.593)
C)(-0.279, 0.049)
D)(0.291, 0.619)
E)(-0.253, 0.593)
A)(0.317, 0.593)
B)(0.291, 0.593)
C)(-0.279, 0.049)
D)(0.291, 0.619)
E)(-0.253, 0.593)
فتح الحزمة
افتح القفل للوصول البطاقات البالغ عددها 16 في هذه المجموعة.
فتح الحزمة
k this deck
10
A grocery store is interested in determining whether or not a difference exists between the shelf life of Tasty Choice doughnuts and Sugar Twist doughnuts.A random sample of 100 boxes of each brand was selected and the mean shelf life in days was determined for each brand .A 90% confidence interval for the difference of the means,
determined to be (1.3, 2.5).
A)We know that 90% of Tasty Choice doughnuts last between 1.3 and 2.5 days longer than Sugar Twist doughnuts.
B)Based on this sample, we are 90% confident that Sugar Twist doughnuts will last on average between 1.3 and 2.5 days longer than Tasty Choice doughnuts.
C)We are 90% confident that a randomly selected box of Tasty Choice doughnuts will have a shelf life that is between 1.3 and 2.5 days longer than a randomly selected box of Sugar
Twist doughnuts.
D)We know that 90% of all random samples done on the population will show that the mean shelf life of Tasty Choice doughnuts is between 1.3 and 2.5 days longer than the
Mean shelf life of Sugar Twist doughnuts.
E)Based on this sample, we are 90% confident that Tasty Choice doughnuts will last on average between 1.3 and 2.5 days longer than Sugar Twist doughnuts.
فتح الحزمة
افتح القفل للوصول البطاقات البالغ عددها 16 في هذه المجموعة.
فتح الحزمة
k this deck
11
فتح الحزمة
افتح القفل للوصول البطاقات البالغ عددها 16 في هذه المجموعة.
فتح الحزمة
k this deck
12
A researcher was interested in comparing the salaries of female and male employees of a particular company.Independent random samples of female employees (sample 1) and male employees (sample 2) were taken to calculate the mean salary, in dollars per week, for each group.A 95% confidence interval for the difference, , between the mean weekly
Salary of all female employees and the mean weekly salary of all male employees was determined to be (-$180, $60).
A)We know that 95% of female employees at this company make between $180 less and $60 more than the male employees.
B)We know that 95% of all random samples done on the employees at this company will show that the average female salary is between $180 less and $60 more per week than the
Average male salary.
C)We are 95% confident that a randomly selected female employee at this company makes between $180 less and $60 more per week than a randomly selected male employee.
D)Based on these data, with 95% confidence, female employees at this company average between $180 less and $60 more per week than the male employees.
E)Based on these data, with 95% confidence, male employees at this company average between $180 less and $60 more per week than the female employees.
فتح الحزمة
افتح القفل للوصول البطاقات البالغ عددها 16 في هذه المجموعة.
فتح الحزمة
k this deck
13
فتح الحزمة
افتح القفل للوصول البطاقات البالغ عددها 16 في هذه المجموعة.
فتح الحزمة
k this deck
14
فتح الحزمة
افتح القفل للوصول البطاقات البالغ عددها 16 في هذه المجموعة.
فتح الحزمة
k this deck
15
A researcher is interested in the academic performance differences between individuals using an optimistic versus a pessimistic approach to their studies.If the researcher claims a significant difference between groups, when in fact none exists:
A)the research hypothesis was correctly rejected.
B)the research hypothesis was correctly accepted.
C)a Type 1 error is made.
D)the null hypothesis was correctly accepted.
E)a Type 2 error is made.
A)the research hypothesis was correctly rejected.
B)the research hypothesis was correctly accepted.
C)a Type 1 error is made.
D)the null hypothesis was correctly accepted.
E)a Type 2 error is made.
فتح الحزمة
افتح القفل للوصول البطاقات البالغ عددها 16 في هذه المجموعة.
فتح الحزمة
k this deck
16
فتح الحزمة
افتح القفل للوصول البطاقات البالغ عددها 16 في هذه المجموعة.
فتح الحزمة
k this deck
فتح الحزمة
افتح القفل للوصول البطاقات البالغ عددها 16 في هذه المجموعة.


