Deck 7: Linear Regression
ملء الشاشة (f)
سؤال
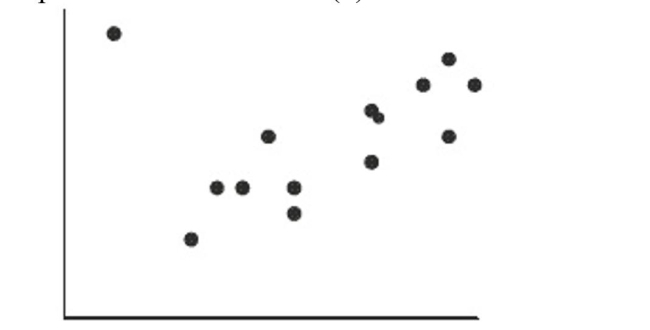
If the point in the upper right corner of this scatterplot is removed from the data set, then What will happen to the slope of the line of best fit (b) and to the correlation (r)?
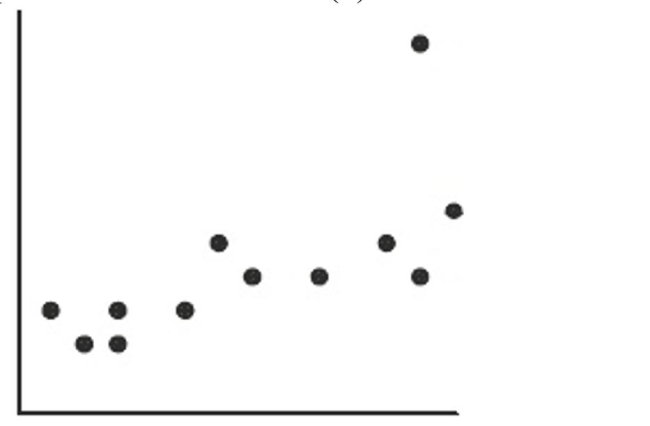
A)b will increase, and r will decrease.
B)b will decrease, and r will increase.
C)both will decrease.
D)both will increase.
E)both will remain the same.
A)b will increase, and r will decrease.
B)b will decrease, and r will increase.
C)both will decrease.
D)both will increase.
E)both will remain the same.
سؤال
سؤال
سؤال
سؤال
سؤال
سؤال
سؤال
An article in the Journal of Statistics Education reported the price of diamonds of different sizes in Singapore dollars (SGD). The following table contains a data set that is consistent with this data, adjusted to US dollars in 2004:
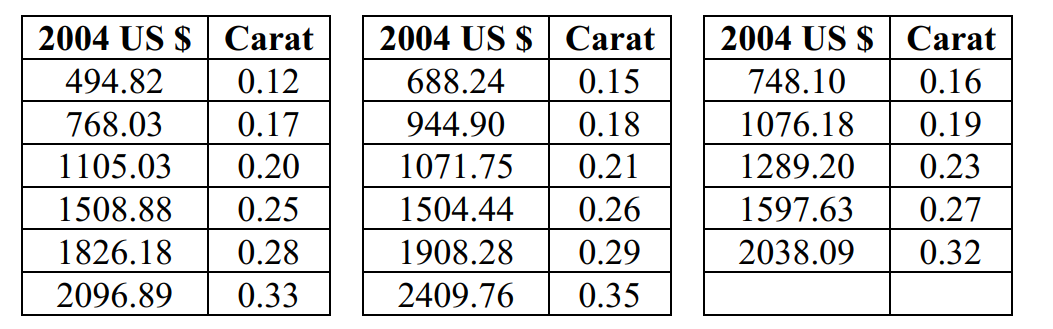
-Make a scatterplot and describe the association between the size of the diamond (carat) and the cost (in US dollars).
-Make a scatterplot and describe the association between the size of the diamond (carat) and the cost (in US dollars).
سؤال
سؤال
سؤال
An article in the Journal of Statistics Education reported the price of diamonds of different sizes in Singapore dollars (SGD). The following table contains a data set that is consistent with this data, adjusted to US dollars in 2004:
-Create a model to predict diamond costs from the size of the diamond.
-Create a model to predict diamond costs from the size of the diamond.
سؤال
سؤال
سؤال
سؤال
سؤال
سؤال
سؤال
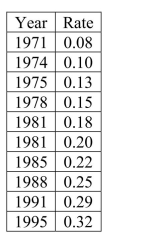
Make a scatterplot and describe the association between the year and the
سؤال
سؤال
سؤال
سؤال
If the point in the upper left corner of the scatterplot is removed, what will happen to the Correlation (r) and the slope of the line of best fit (b)?
A)r will decrease and b will increase.
B)r will increase and b will decrease.
C)Both will decrease.
D)Both will increase.
E)They will not change.
A)r will decrease and b will increase.
B)r will increase and b will decrease.
C)Both will decrease.
D)Both will increase.
E)They will not change.
سؤال
سؤال
سؤال
سؤال
سؤال
سؤال
سؤال
سؤال

فتح الحزمة
قم بالتسجيل لفتح البطاقات في هذه المجموعة!
Unlock Deck
Unlock Deck
1/30
العب
ملء الشاشة (f)
Deck 7: Linear Regression
1
If the point in the upper right corner of this scatterplot is removed from the data set, then What will happen to the slope of the line of best fit (b) and to the correlation (r)?
A)b will increase, and r will decrease.
B)b will decrease, and r will increase.
C)both will decrease.
D)both will increase.
E)both will remain the same.
A)b will increase, and r will decrease.
B)b will decrease, and r will increase.
C)both will decrease.
D)both will increase.
E)both will remain the same.
b will decrease, and r will increase.
2
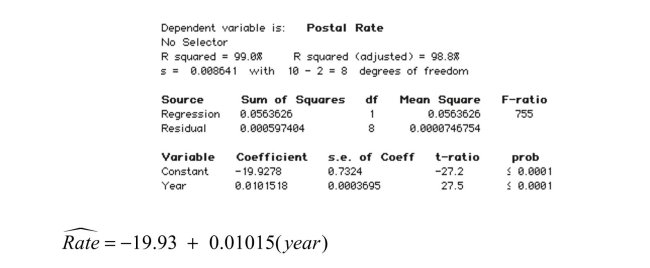
Create a model to predict postal rates from the year.
3
Interpret the slope of your model in context.
Slope of the model is 0.0101518.The model predicts that for every additional year the first class postal rate will increase by $0.01, on average.
4
A small independent organic food store offers a variety of specialty coffees.To determine Whether price has an impact on sales, the managers kept track of how many pounds of each Variety of coffee were sold last month.
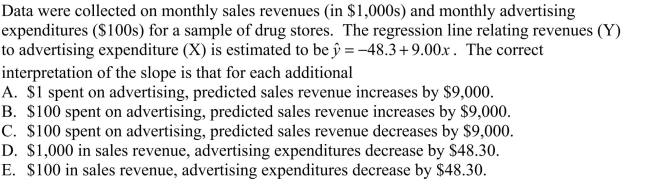
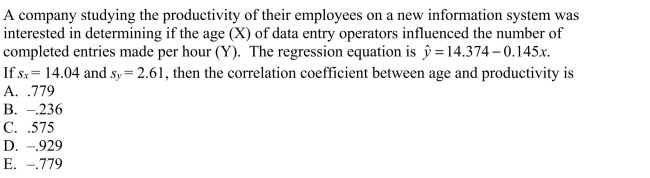
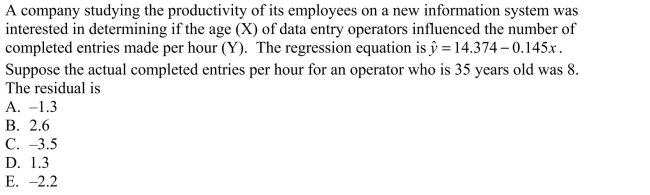
Based on the data and summary statistics, the intercept of the estimated regression line that Relates the response variable (monthly sales) to the predictor variable (price per pound) is
A)95.459.
B).858.
C)-4.684.
D)-.858.
E)-8.999.
Based on the data and summary statistics, the intercept of the estimated regression line that Relates the response variable (monthly sales) to the predictor variable (price per pound) is
A)95.459.
B).858.
C)-4.684.
D)-.858.
E)-8.999.
فتح الحزمة
افتح القفل للوصول البطاقات البالغ عددها 30 في هذه المجموعة.
فتح الحزمة
k this deck
5
Explain the meaning of } R 2 in the context of this problem.
فتح الحزمة
افتح القفل للوصول البطاقات البالغ عددها 30 في هذه المجموعة.
فتح الحزمة
k this deck
6
Interpret the intercept of your model in context.
فتح الحزمة
افتح القفل للوصول البطاقات البالغ عددها 30 في هذه المجموعة.
فتح الحزمة
k this deck
7
Residuals are …
A)the difference between observed responses and values predicted by the model.
B)data collected from individuals that is not consistent with the rest of the group.
C)none of these
D)possible models not explored by the researcher.
E)variation in the data that is explained by the model.
A)the difference between observed responses and values predicted by the model.
B)data collected from individuals that is not consistent with the rest of the group.
C)none of these
D)possible models not explored by the researcher.
E)variation in the data that is explained by the model.
فتح الحزمة
افتح القفل للوصول البطاقات البالغ عددها 30 في هذه المجموعة.
فتح الحزمة
k this deck
8
An article in the Journal of Statistics Education reported the price of diamonds of different sizes in Singapore dollars (SGD). The following table contains a data set that is consistent with this data, adjusted to US dollars in 2004:
-Make a scatterplot and describe the association between the size of the diamond (carat) and the cost (in US dollars).
-Make a scatterplot and describe the association between the size of the diamond (carat) and the cost (in US dollars).
فتح الحزمة
افتح القفل للوصول البطاقات البالغ عددها 30 في هذه المجموعة.
فتح الحزمة
k this deck
9
Explain the meaning of R 2 in the context of this problem.
فتح الحزمة
افتح القفل للوصول البطاقات البالغ عددها 30 في هذه المجموعة.
فتح الحزمة
k this deck
10
What is the correlation between cost and size?
فتح الحزمة
افتح القفل للوصول البطاقات البالغ عددها 30 في هذه المجموعة.
فتح الحزمة
k this deck
11
An article in the Journal of Statistics Education reported the price of diamonds of different sizes in Singapore dollars (SGD). The following table contains a data set that is consistent with this data, adjusted to US dollars in 2004:
-Create a model to predict diamond costs from the size of the diamond.
-Create a model to predict diamond costs from the size of the diamond.
فتح الحزمة
افتح القفل للوصول البطاقات البالغ عددها 30 في هذه المجموعة.
فتح الحزمة
k this deck
12
A small independent organic food store offers a variety of specialty coffees.To determine Whether price has an impact on sales, the managers kept track of how many pounds of each Variety of coffee were sold last month.
Based on the data and summary statistics shown below, the slope of the estimated regression
Line that relates the response variable (monthly sales) to the predictor variable (price per
Pound) is
A)95.459.
B).858.
C)-4.681.
D)-.858.
E)-8.999.
Based on the data and summary statistics shown below, the slope of the estimated regression
Line that relates the response variable (monthly sales) to the predictor variable (price per
Pound) is
A)95.459.
B).858.
C)-4.681.
D)-.858.
E)-8.999.
فتح الحزمة
افتح القفل للوصول البطاقات البالغ عددها 30 في هذه المجموعة.
فتح الحزمة
k this deck
13
Do you think a linear model is appropriate here? Explain.
فتح الحزمة
افتح القفل للوصول البطاقات البالغ عددها 30 في هذه المجموعة.
فتح الحزمة
k this deck
14
What is the correlation between year and postal rate?
فتح الحزمة
افتح القفل للوصول البطاقات البالغ عددها 30 في هذه المجموعة.
فتح الحزمة
k this deck
15
فتح الحزمة
افتح القفل للوصول البطاقات البالغ عددها 30 في هذه المجموعة.
فتح الحزمة
k this deck
16
A small independent organic food store offers a variety of specialty coffees.To determine Whether price has an impact on sales, the managers kept track of how many pounds of each Variety of coffee were sold last month.
Based on the summary statistics shown below, what percent of the variability in the number of pounds of coffee sold per week can be explained by price?
A)95.47%
B)100%
C)85.9%
D)55.6%
E)4.68%
Based on the summary statistics shown below, what percent of the variability in the number of pounds of coffee sold per week can be explained by price?
A)95.47%
B)100%
C)85.9%
D)55.6%
E)4.68%
فتح الحزمة
افتح القفل للوصول البطاقات البالغ عددها 30 في هذه المجموعة.
فتح الحزمة
k this deck
17
Interpret the slope of your model in context.
فتح الحزمة
افتح القفل للوصول البطاقات البالغ عددها 30 في هذه المجموعة.
فتح الحزمة
k this deck
18
Make a scatterplot and describe the association between the year and the
فتح الحزمة
افتح القفل للوصول البطاقات البالغ عددها 30 في هذه المجموعة.
فتح الحزمة
k this deck
19
Interpret the intercept of your model in context.
فتح الحزمة
افتح القفل للوصول البطاقات البالغ عددها 30 في هذه المجموعة.
فتح الحزمة
k this deck
20
Do you think a linear model is appropriate here? Explain.
فتح الحزمة
افتح القفل للوصول البطاقات البالغ عددها 30 في هذه المجموعة.
فتح الحزمة
k this deck
21
The correlation coefficient between high school grade point average (GPA) and college GPA is 0.560.For a student with a high school GPA that is 2.5 standard deviations above the Mean, we would expect that student to have a college GPA that is ______ the mean.
A)0.56 SD above
B)1.94 SD above
C)2.5 SD above
D)equal to
E)1.4 SD above
A)0.56 SD above
B)1.94 SD above
C)2.5 SD above
D)equal to
E)1.4 SD above
فتح الحزمة
افتح القفل للوصول البطاقات البالغ عددها 30 في هذه المجموعة.
فتح الحزمة
k this deck
22
If the point in the upper left corner of the scatterplot is removed, what will happen to the Correlation (r) and the slope of the line of best fit (b)?
A)r will decrease and b will increase.
B)r will increase and b will decrease.
C)Both will decrease.
D)Both will increase.
E)They will not change.
A)r will decrease and b will increase.
B)r will increase and b will decrease.
C)Both will decrease.
D)Both will increase.
E)They will not change.
فتح الحزمة
افتح القفل للوصول البطاقات البالغ عددها 30 في هذه المجموعة.
فتح الحزمة
k this deck
23
فتح الحزمة
افتح القفل للوصول البطاقات البالغ عددها 30 في هذه المجموعة.
فتح الحزمة
k this deck
24
An 8th grade class develops a linear model that predicts the number of cheerios (a small round cereal) that fit on the circumference of a plate by using the diameter in inches. Their model is (diameter).
The slope of this model is best interpreted in context as...
A) For every inches of diameter, the circumference is about 1 cheerio bigger.
B) For every 1 inch of diameter, the circumference holds about more cheerios.
C) It takes cheerios to fill a plate's circumference.
D) For every 1 inch of diameter, the circumference holds about more cheerios.
E) A mistake, because is about and that should be the slope.
فتح الحزمة
افتح القفل للوصول البطاقات البالغ عددها 30 في هذه المجموعة.
فتح الحزمة
k this deck
25
فتح الحزمة
افتح القفل للوصول البطاقات البالغ عددها 30 في هذه المجموعة.
فتح الحزمة
k this deck
26
فتح الحزمة
افتح القفل للوصول البطاقات البالغ عددها 30 في هذه المجموعة.
فتح الحزمة
k this deck
27
فتح الحزمة
افتح القفل للوصول البطاقات البالغ عددها 30 في هذه المجموعة.
فتح الحزمة
k this deck
28
فتح الحزمة
افتح القفل للوصول البطاقات البالغ عددها 30 في هذه المجموعة.
فتح الحزمة
k this deck
29
A regression analysis of students' college grade point averages (GPAs) and their high school GPAs found . Which of these is true?
I. High school GPA accounts for of college GPA.
II. of college GPAs can be correctly predicted with this model.
III. of the variance in college GPA can be accounted for by the model
A) I only
B) II only
C) III only
D) I and II
E) none of these
I. High school GPA accounts for of college GPA.
II. of college GPAs can be correctly predicted with this model.
III. of the variance in college GPA can be accounted for by the model
A) I only
B) II only
C) III only
D) I and II
E) none of these
فتح الحزمة
افتح القفل للوصول البطاقات البالغ عددها 30 في هذه المجموعة.
فتح الحزمة
k this deck
30
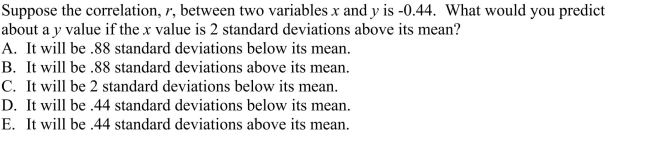
Suppose the correlation, r, between two variables x and y is -0.44.What percentage of the
Variability in y cannot be explained by x?
A)19%
B)44%
C)81%
D)88%
E)12%
Variability in y cannot be explained by x?
A)19%
B)44%
C)81%
D)88%
E)12%
فتح الحزمة
افتح القفل للوصول البطاقات البالغ عددها 30 في هذه المجموعة.
فتح الحزمة
k this deck
فتح الحزمة
افتح القفل للوصول البطاقات البالغ عددها 30 في هذه المجموعة.


