Deck 7: Correlation and Causality
ملء الشاشة (f)
سؤال
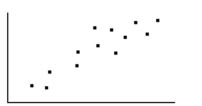
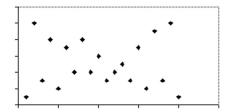
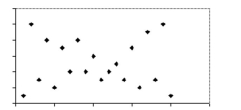
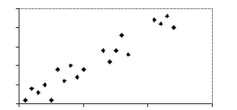
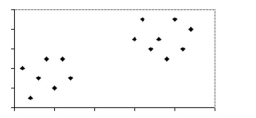
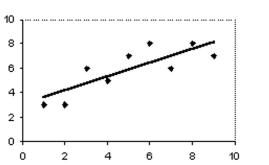
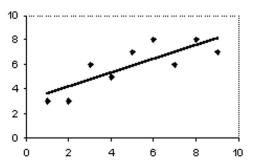
Select the best estimate of the correlation coefficient for the data depicted in the scatter diagram.
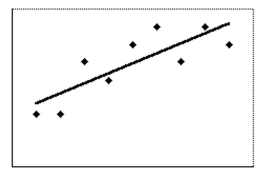
A)-0.65
B)0.95
C)0.65
D)0.20
A)-0.65
B)0.95
C)0.65
D)0.20
سؤال
سؤال
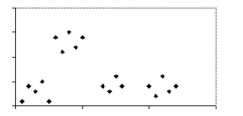
State whether there is no correlation, a positive correlation, or a negative correlation between the x and y variables. If there is a correlation, state whether it is most likely due to coincidence, a common underlying cause, or a direct cause.
-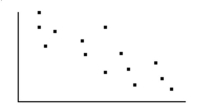 For a group of students in a statistics class, the scatter diagram compares their test scores (y)and the amount of loose pocket change they have(x).
A)Negative correlation; direct cause
B)Negative correlation; coincidence
C)No correlation
D)Negative correlation; common underlying cause
-
For a group of students in a statistics class, the scatter diagram compares their test scores (y)and the amount of loose pocket change they have(x).A)Negative correlation; direct cause
B)Negative correlation; coincidence
C)No correlation
D)Negative correlation; common underlying cause
سؤال
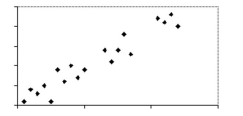
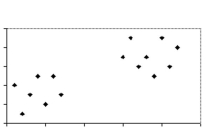
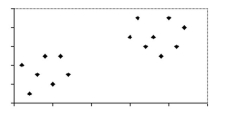
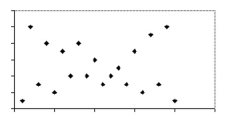
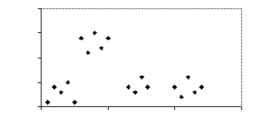
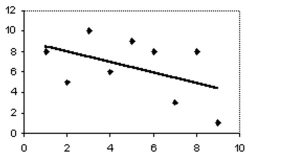
Select the best estimate of the correlation coefficient for the data depicted in the scatter diagram.
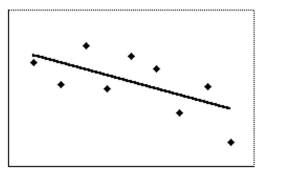
A)0.9
B)-0.6
C)-0.1
D)0.6
A)0.9
B)-0.6
C)-0.1
D)0.6
سؤال
Solve the problem.
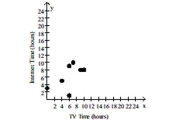
-The table below shows the times (in hours)that seven students spend watching television and using the internet. Construct a scatter diagram for the data and state whether these times have no correlation, a positive correlation, or a negative correlation.
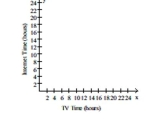
A) Negative correlation
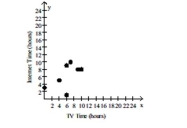
B) Positive correlation
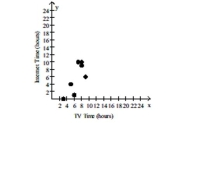
C) No correlation
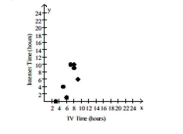
D) Positive correlation
-The table below shows the times (in hours)that seven students spend watching television and using the internet. Construct a scatter diagram for the data and state whether these times have no correlation, a positive correlation, or a negative correlation.
A) Negative correlation
B) Positive correlation
C) No correlation
D) Positive correlation
سؤال
State whether there is no correlation, a positive correlation, or a negative correlation between the x and y variables. If there is a correlation, state whether it is most likely due to coincidence, a common underlying cause, or a direct cause.
- For several customers at the local bookstore, the scatter diagram compares the weight of their books (y)and the umber of pages in them(x).
A)Positive correlation; coincidence
B)Positive correlation; direct cause
C)No correlation
D)Negative correlation; common underlying cause
-
For several customers at the local bookstore, the scatter diagram compares the weight of their books (y)and the umber of pages in them(x).A)Positive correlation; coincidence
B)Positive correlation; direct cause
C)No correlation
D)Negative correlation; common underlying cause
سؤال
سؤال
سؤال
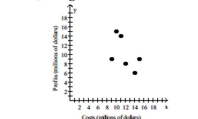
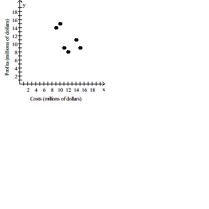
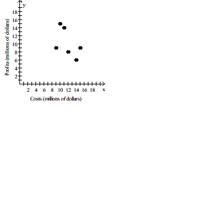
Solve the problem.
-The table below shows the legal costs and the profits of a company from 2000 to 2005. Construct a scatter diagram for the data and state whether legal costs and profits for this company have no correlation, a positive correlation, or a negative correlation for this period.
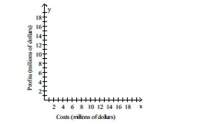
A) Positive correlation
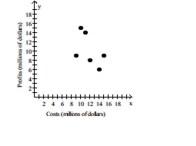
B) Positive correlation
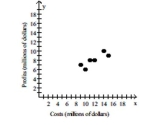
C) No correlation
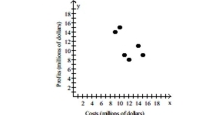
D) Negative correlation
-The table below shows the legal costs and the profits of a company from 2000 to 2005. Construct a scatter diagram for the data and state whether legal costs and profits for this company have no correlation, a positive correlation, or a negative correlation for this period.
A) Positive correlation
B) Positive correlation
C) No correlation
D) Negative correlation
سؤال
سؤال
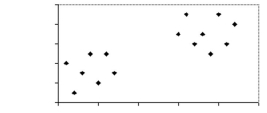
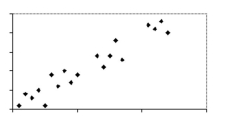
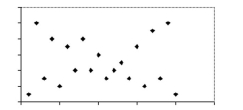
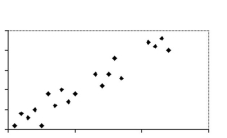
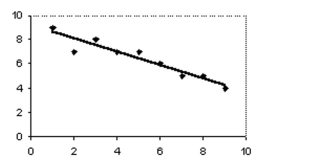
Select the best estimate of the correlation coefficient for the data depicted in the scatter diagram.
A)-0.1
B)-0.9
C)-0.5
D)0.9
A)-0.1
B)-0.9
C)-0.5
D)0.9
سؤال
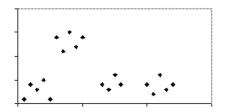
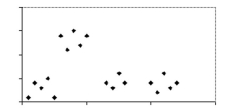
Select the best estimate of the correlation coefficient for the data depicted in the scatter diagram.
A)0.9
B)-0.9
C)0.5
D)-0.5
A)0.9
B)-0.9
C)0.5
D)-0.5
سؤال
Provide an appropriate response.
Estimate the coordinates of the outlier on the graph.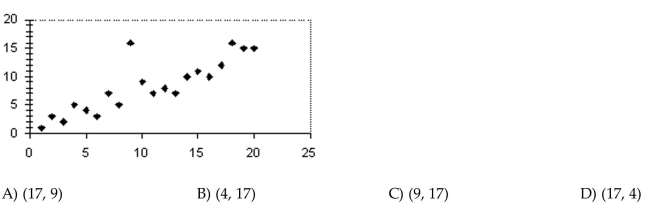
Estimate the coordinates of the outlier on the graph.
سؤال
State whether there is no correlation, a positive correlation, or a negative correlation between the x and y variables. If there is a correlation, state whether it is most likely due to coincidence, a common underlying cause, or a direct cause.
- For a group of employees at the local video store, the scatter diagram compares the number of days worked per year (y)and the average number of miles walkedweekly (x).
A)Positive correlation; coincidence
B)No correlation
C)Positive correlation; direct cause
D)Positive correlation; common underlying cause
-
For a group of employees at the local video store, the scatter diagram compares the number of days worked per year (y)and the average number of miles walkedweekly (x).A)Positive correlation; coincidence
B)No correlation
C)Positive correlation; direct cause
D)Positive correlation; common underlying cause
سؤال
State whether there is no correlation, a positive correlation, or a negative correlation between the x and y variables. If there is a correlation, state whether it is most likely due to coincidence, a common underlying cause, or a direct cause.
- For a group of English students at the local junior college, the scatter diagram compares the number of correct answers on a test they took(y)and the length of the pencil used to take the test(x).
A)Positive correlation; direct cause
B)Negative correlation; coincidence
C)No correlation
D)Positive correlation; coincidence
-
For a group of English students at the local junior college, the scatter diagram compares the number of correct answers on a test they took(y)and the length of the pencil used to take the test(x).A)Positive correlation; direct cause
B)Negative correlation; coincidence
C)No correlation
D)Positive correlation; coincidence
سؤال
سؤال
سؤال
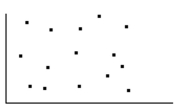
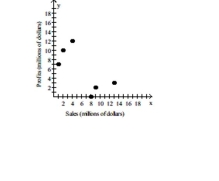
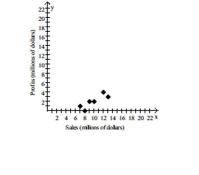
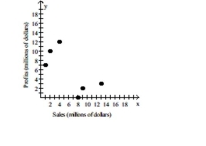
Solve the problem.
-The following table gives the total sales (revenue)and profits for 8 retailers. Construct a scatter diagram for thedata and state whether sales and profits for these companies have no correlation, a positive correlation, or a
Negative correlation.
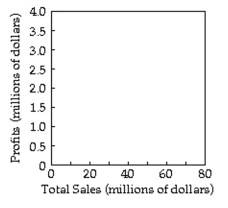
A) Positive correlation
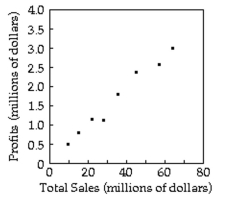
B) Negative correlation
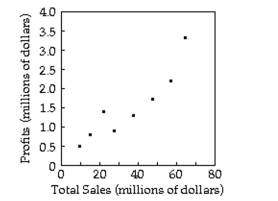
C) Positive correlation
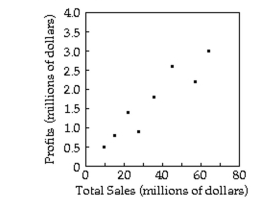
D) No correlation
-The following table gives the total sales (revenue)and profits for 8 retailers. Construct a scatter diagram for thedata and state whether sales and profits for these companies have no correlation, a positive correlation, or a
Negative correlation.
A) Positive correlation
B) Negative correlation
C) Positive correlation
D) No correlation
سؤال
How does the outlier affect the correlation coefficient?. 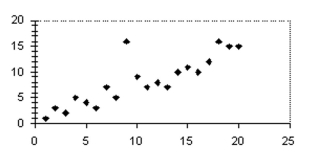
A)The outlier has no effect on the correlation coefficient.
B)The outlier reduces the correlation coefficient.
C)The outlier increases the correlation coefficient.
D)None of the above
A)The outlier has no effect on the correlation coefficient.
B)The outlier reduces the correlation coefficient.
C)The outlier increases the correlation coefficient.
D)None of the above
سؤال
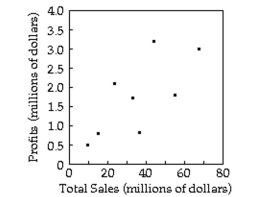
Solve the problem.
-The table below shows the sales and profits of a company from 2000 to 2005. Construct a scatter diagram for the data and state whether sales and profits for this company have no correlation, a positive correlation, or a negative correlation for this period.
A) Negative correlation
B) Positive correlation
C) No correlation
D) No correlation
سؤال
Solve the problem. Round your answers to the nearest whole percent.
 end
end
end سؤال
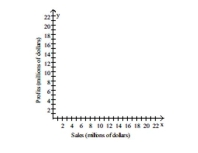
Write the coordinates of a point that would be an outlier on the following graph. 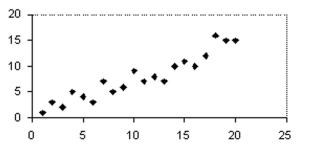
A)(23, 20)
B)(6, 5)
C)(20, 0)
D)(12, 10)
A)(23, 20)
B)(6, 5)
C)(20, 0)
D)(12, 10)
سؤال
سؤال
The table contains the weights (in pounds)and heights (in inches)of 9 randomly selected adults. Construct a scatter diagram for the data.
سؤال
Construct a scatter diagram with several groups of uncorrelated data but a strong correlation among all the data.
A)
B)
C)
D)
A)
B)
C)
D)
سؤال
Construct a scatter diagram with two groups of data, correlations within each group, but no correlation among all the data.
A)
B)
C)
D)
A)
B)
C)
D)
سؤال
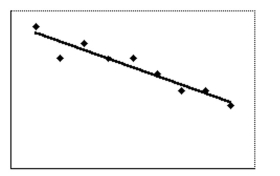
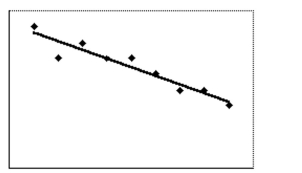
Select the best-fit line for the data on the scatter diagram. If none of the lines fit the data, write "none of the lines".
Select the best-fit line on the scatter diagram below.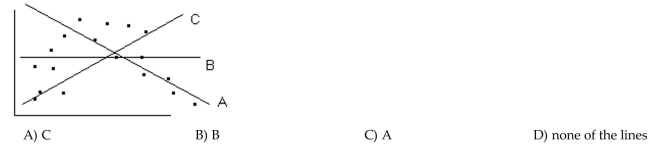
Select the best-fit line on the scatter diagram below.
سؤال
سؤال
To get the best deal on a microwave oven, Amanda called six appliance stores and asked the cost and volume of several models. The prices and volumes she was quoted are listed below. Construct a scatter diagram for the data.
سؤال
Including the outlier, estimate or compute the correlation coefficient for the complete data set. 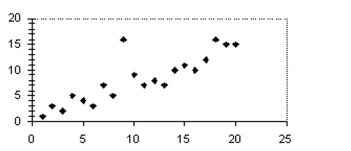
A)-0.62
B)-0.83
C)0.83
D)0.62
A)-0.62
B)-0.83
C)0.83
D)0.62
سؤال
سؤال
Construct a scatter diagram with two groups of data that have no correlation within either group but shows a moderate correlation among all the data. 
A)
B)
C)
D)
A)
B)
C)
D)
سؤال
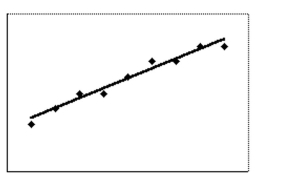
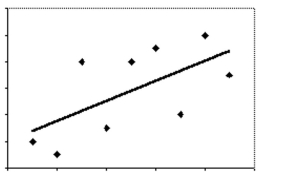
Select the best-fit line for the data on the scatter diagram. If none of the lines fit the data, write "none of the lines".
Select the best-fit line on the scatter diagram below.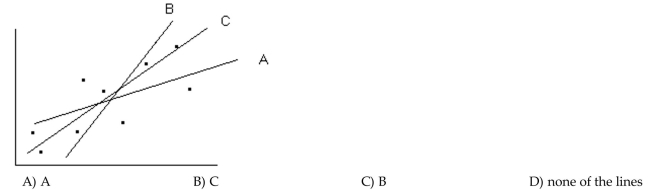
Select the best-fit line on the scatter diagram below.
سؤال
Write possible coordinates for the single outlier such that it would no longer be an outlier. 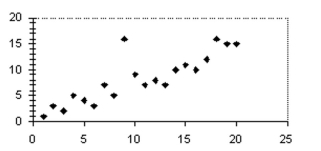
A)(8, 25)
B)(8, 20)
C)(8, 5)
D)(25, 8)
A)(8, 25)
B)(8, 20)
C)(8, 5)
D)(25, 8)
سؤال
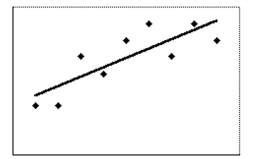
Select the best-fit line for the data on the scatter diagram. If none of the lines fit the data, write "none of the lines".
Select the best-fit line on the scatter diagram below.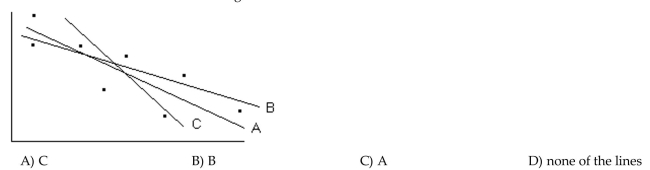
Select the best-fit line on the scatter diagram below.
سؤال
Solve the problem. Round your answers to the nearest whole percent.
-
The scatter diagram shows the data for the prices of a stock (y) and U.S. employment (x). The correlation coeffici . Determine how much of the variation in the stock price can be accounted for by the best-fit line.
A)
B)
C)
D) cient r is
-
The scatter diagram shows the data for the prices of a stock (y) and U.S. employment (x). The correlation coeffici . Determine how much of the variation in the stock price can be accounted for by the best-fit line.
A)
B)
C)
D) cient r is
سؤال
Write possible coordinates for both outliers so that neither would be an outlier. 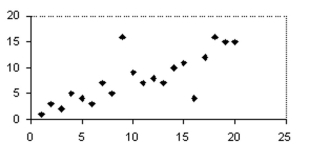
A)(8, 4)and (16, 19)
B)(8, 0)and (16,0)
C)(8, 19)and (16, 8)
D)(8, 4)and (16, 8)
A)(8, 4)and (16, 19)
B)(8, 0)and (16,0)
C)(8, 19)and (16, 8)
D)(8, 4)and (16, 8)
سؤال
سؤال
Construct a scatter diagram with several groups of data such that there is no correlation of data within the groups and no correlation among all the data. 
A)
B)
C)
D)
A)
B)
C)
D)
سؤال
Select the best-fit line for the data on the scatter diagram. If none of the lines fit the data, write "none of the lines".
Select the best-fit line on the scatter diagram below.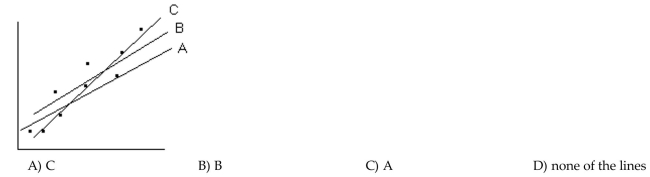
Select the best-fit line on the scatter diagram below.
سؤال
سؤال
سؤال
سؤال
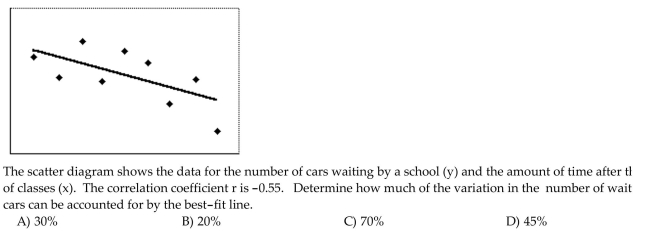
Solve the problem. Round your answers to the nearest whole percent.
 The scatter diagram shows the data for attendance at the local team's hockey games (y)and the number of wins (x)for
That team. The correlation coefficient r is 0.4. Determine how much of the variation in attendance can be accounted for
By the best-fit line.
A)16%
B)36%
C)84%
D)25%
The scatter diagram shows the data for attendance at the local team's hockey games (y)and the number of wins (x)forThat team. The correlation coefficient r is 0.4. Determine how much of the variation in attendance can be accounted for
By the best-fit line.
A)16%
B)36%
C)84%
D)25%
سؤال
سؤال
سؤال
Answer the question using the value of r and the given best-fit line on the scatter diagram.
- The scatter diagram and best-fit line show the data for the price of a stock (y)and U.S. employment (x). The correlation coefficient r is 0.8. Predict the stock price for an employment value of 5.
A)5.9
B)4.9
C)7
D)No valid prediction is possible.
-
The scatter diagram and best-fit line show the data for the price of a stock (y)and U.S. employment (x). The correlation coefficient r is 0.8. Predict the stock price for an employment value of 5.A)5.9
B)4.9
C)7
D)No valid prediction is possible.
سؤال
سؤال
سؤال
Answer the question using the value of r and the given best-fit line on the scatter diagram.
- The scatter diagram and best-fit line show the data for the number of cars waiting by a school (y)and the amount of time after the end of classes (x). The correlation coefficient r is -0.55. Predict the number of cars at time 8
After the end of classes.
A)6
B)No valid prediction is possible.
C)5
D)7
-
The scatter diagram and best-fit line show the data for the number of cars waiting by a school (y)and the amount of time after the end of classes (x). The correlation coefficient r is -0.55. Predict the number of cars at time 8After the end of classes.
A)6
B)No valid prediction is possible.
C)5
D)7
سؤال
Answer the question using the value of r and the given best-fit line on the scatter diagram.
- The scatter diagram and best-fit line show the data for price per item (y)and the availability of that item (x). The correlation coefficient r is -0.95. Predict the price per item for an availability of 3.
A)7.8
B)6.8
C)No valid prediction is possible.
D)8.8
-
The scatter diagram and best-fit line show the data for price per item (y)and the availability of that item (x). The correlation coefficient r is -0.95. Predict the price per item for an availability of 3.A)7.8
B)6.8
C)No valid prediction is possible.
D)8.8
سؤال
سؤال
Solve the problem. Round your answers to the nearest whole percent.
 The scatter diagram shows the data for price per item (y)and the availability of that item (x). The correlation coefficient r
Is -0.95. Determine how much of the variation in price per item can be accounted for by the best-fit line.
A)5%
B)10%
C)95%
D)90%
The scatter diagram shows the data for price per item (y)and the availability of that item (x). The correlation coefficient rIs -0.95. Determine how much of the variation in price per item can be accounted for by the best-fit line.
A)5%
B)10%
C)95%
D)90%
سؤال
سؤال
Answer the question using the value of r and the given best-fit line on the scatter diagram.
-
The scatter diagram and best-fit line show the data for the price of a stock (y)and U.S. employment (x). The correlation coefficient r is 0.8. Predict the stock price for an employment value of 11.
A)9.8
B)9
C)8
D)No valid prediction is possible.
-
The scatter diagram and best-fit line show the data for the price of a stock (y)and U.S. employment (x). The correlation coefficient r is 0.8. Predict the stock price for an employment value of 11.
A)9.8
B)9
C)8
D)No valid prediction is possible.

فتح الحزمة
قم بالتسجيل لفتح البطاقات في هذه المجموعة!
Unlock Deck
Unlock Deck
1/55
العب
ملء الشاشة (f)
Deck 7: Correlation and Causality
1
Select the best estimate of the correlation coefficient for the data depicted in the scatter diagram.
A)-0.65
B)0.95
C)0.65
D)0.20
A)-0.65
B)0.95
C)0.65
D)0.20
C
2
State whether you believe the two variables are correlated. If you believe they are correlated, state whether the correlation is positive or negative.
-The age of a car and its fuel efficiency.
A)Positive correlation
B)Negative correlation
C)Not correlated
-The age of a car and its fuel efficiency.
A)Positive correlation
B)Negative correlation
C)Not correlated
Negative correlation
3
State whether there is no correlation, a positive correlation, or a negative correlation between the x and y variables. If there is a correlation, state whether it is most likely due to coincidence, a common underlying cause, or a direct cause.
- For a group of students in a statistics class, the scatter diagram compares their test scores (y)and the amount of loose pocket change they have(x).
A)Negative correlation; direct cause
B)Negative correlation; coincidence
C)No correlation
D)Negative correlation; common underlying cause
-
For a group of students in a statistics class, the scatter diagram compares their test scores (y)and the amount of loose pocket change they have(x).A)Negative correlation; direct cause
B)Negative correlation; coincidence
C)No correlation
D)Negative correlation; common underlying cause
Negative correlation; coincidence
4
Select the best estimate of the correlation coefficient for the data depicted in the scatter diagram.
A)0.9
B)-0.6
C)-0.1
D)0.6
A)0.9
B)-0.6
C)-0.1
D)0.6
فتح الحزمة
افتح القفل للوصول البطاقات البالغ عددها 55 في هذه المجموعة.
فتح الحزمة
k this deck
5
Solve the problem.
-The table below shows the times (in hours)that seven students spend watching television and using the internet. Construct a scatter diagram for the data and state whether these times have no correlation, a positive correlation, or a negative correlation.
A) Negative correlation
B) Positive correlation
C) No correlation
D) Positive correlation
فتح الحزمة
افتح القفل للوصول البطاقات البالغ عددها 55 في هذه المجموعة.
فتح الحزمة
k this deck
6
State whether there is no correlation, a positive correlation, or a negative correlation between the x and y variables. If there is a correlation, state whether it is most likely due to coincidence, a common underlying cause, or a direct cause.
- For several customers at the local bookstore, the scatter diagram compares the weight of their books (y)and the umber of pages in them(x).
A)Positive correlation; coincidence
B)Positive correlation; direct cause
C)No correlation
D)Negative correlation; common underlying cause
-
For several customers at the local bookstore, the scatter diagram compares the weight of their books (y)and the umber of pages in them(x).A)Positive correlation; coincidence
B)Positive correlation; direct cause
C)No correlation
D)Negative correlation; common underlying cause
فتح الحزمة
افتح القفل للوصول البطاقات البالغ عددها 55 في هذه المجموعة.
فتح الحزمة
k this deck
7
State whether you believe the two variables are correlated. If you believe they are correlated, state whether the correlation is positive or negative.
-Rate of pedaling a bicycle and speed of the bicycle
A)Positive correlation
B)Negative correlation
C)Not correlated
-Rate of pedaling a bicycle and speed of the bicycle
A)Positive correlation
B)Negative correlation
C)Not correlated
فتح الحزمة
افتح القفل للوصول البطاقات البالغ عددها 55 في هذه المجموعة.
فتح الحزمة
k this deck
8
State whether you believe the two variables are correlated. If you believe they are correlated, state whether the correlation is positive or negative.
-The age of a textbook and how well it is written
A)Positive correlation
B)Negative correlation
C)Not correlated
-The age of a textbook and how well it is written
A)Positive correlation
B)Negative correlation
C)Not correlated
فتح الحزمة
افتح القفل للوصول البطاقات البالغ عددها 55 في هذه المجموعة.
فتح الحزمة
k this deck
9
Solve the problem.
-The table below shows the legal costs and the profits of a company from 2000 to 2005. Construct a scatter diagram for the data and state whether legal costs and profits for this company have no correlation, a positive correlation, or a negative correlation for this period.
A) Positive correlation
B) Positive correlation
C) No correlation
D) Negative correlation
فتح الحزمة
افتح القفل للوصول البطاقات البالغ عددها 55 في هذه المجموعة.
فتح الحزمة
k this deck
10
State whether you believe the two variables are correlated. If you believe they are correlated, state whether the correlation is positive or negative.
-Time spent walking and distance covered
A)Positive correlation
B)Negative correlation
C)Not correlated
-Time spent walking and distance covered
A)Positive correlation
B)Negative correlation
C)Not correlated
فتح الحزمة
افتح القفل للوصول البطاقات البالغ عددها 55 في هذه المجموعة.
فتح الحزمة
k this deck
11
Select the best estimate of the correlation coefficient for the data depicted in the scatter diagram.
A)-0.1
B)-0.9
C)-0.5
D)0.9
A)-0.1
B)-0.9
C)-0.5
D)0.9
فتح الحزمة
افتح القفل للوصول البطاقات البالغ عددها 55 في هذه المجموعة.
فتح الحزمة
k this deck
12
Select the best estimate of the correlation coefficient for the data depicted in the scatter diagram.
A)0.9
B)-0.9
C)0.5
D)-0.5
A)0.9
B)-0.9
C)0.5
D)-0.5
فتح الحزمة
افتح القفل للوصول البطاقات البالغ عددها 55 في هذه المجموعة.
فتح الحزمة
k this deck
13
Provide an appropriate response.
Estimate the coordinates of the outlier on the graph.
Estimate the coordinates of the outlier on the graph.
فتح الحزمة
افتح القفل للوصول البطاقات البالغ عددها 55 في هذه المجموعة.
فتح الحزمة
k this deck
14
State whether there is no correlation, a positive correlation, or a negative correlation between the x and y variables. If there is a correlation, state whether it is most likely due to coincidence, a common underlying cause, or a direct cause.
- For a group of employees at the local video store, the scatter diagram compares the number of days worked per year (y)and the average number of miles walkedweekly (x).
A)Positive correlation; coincidence
B)No correlation
C)Positive correlation; direct cause
D)Positive correlation; common underlying cause
-
For a group of employees at the local video store, the scatter diagram compares the number of days worked per year (y)and the average number of miles walkedweekly (x).A)Positive correlation; coincidence
B)No correlation
C)Positive correlation; direct cause
D)Positive correlation; common underlying cause
فتح الحزمة
افتح القفل للوصول البطاقات البالغ عددها 55 في هذه المجموعة.
فتح الحزمة
k this deck
15
State whether there is no correlation, a positive correlation, or a negative correlation between the x and y variables. If there is a correlation, state whether it is most likely due to coincidence, a common underlying cause, or a direct cause.
- For a group of English students at the local junior college, the scatter diagram compares the number of correct answers on a test they took(y)and the length of the pencil used to take the test(x).
A)Positive correlation; direct cause
B)Negative correlation; coincidence
C)No correlation
D)Positive correlation; coincidence
-
For a group of English students at the local junior college, the scatter diagram compares the number of correct answers on a test they took(y)and the length of the pencil used to take the test(x).A)Positive correlation; direct cause
B)Negative correlation; coincidence
C)No correlation
D)Positive correlation; coincidence
فتح الحزمة
افتح القفل للوصول البطاقات البالغ عددها 55 في هذه المجموعة.
فتح الحزمة
k this deck
16
State whether you believe the two variables are correlated. If you believe they are correlated, state whether the correlation is positive or negative.
-The number of hours one sleeps and the number of hours one is awake
A)Positive correlation
B)Negative correlation
C)Not correlated
-The number of hours one sleeps and the number of hours one is awake
A)Positive correlation
B)Negative correlation
C)Not correlated
فتح الحزمة
افتح القفل للوصول البطاقات البالغ عددها 55 في هذه المجموعة.
فتح الحزمة
k this deck
17
State whether you believe the two variables are correlated. If you believe they are correlated, state whether the correlation is positive or negative.
-The time it takes to read a book and the length of the book
A)Positive correlation
B)Negative correlation
C)Not correlated
-The time it takes to read a book and the length of the book
A)Positive correlation
B)Negative correlation
C)Not correlated
فتح الحزمة
افتح القفل للوصول البطاقات البالغ عددها 55 في هذه المجموعة.
فتح الحزمة
k this deck
18
Solve the problem.
-The following table gives the total sales (revenue)and profits for 8 retailers. Construct a scatter diagram for thedata and state whether sales and profits for these companies have no correlation, a positive correlation, or a
Negative correlation.
A) Positive correlation
B) Negative correlation
C) Positive correlation
D) No correlation
فتح الحزمة
افتح القفل للوصول البطاقات البالغ عددها 55 في هذه المجموعة.
فتح الحزمة
k this deck
19
How does the outlier affect the correlation coefficient?.
A)The outlier has no effect on the correlation coefficient.
B)The outlier reduces the correlation coefficient.
C)The outlier increases the correlation coefficient.
D)None of the above
A)The outlier has no effect on the correlation coefficient.
B)The outlier reduces the correlation coefficient.
C)The outlier increases the correlation coefficient.
D)None of the above
فتح الحزمة
افتح القفل للوصول البطاقات البالغ عددها 55 في هذه المجموعة.
فتح الحزمة
k this deck
20
Solve the problem.
-The table below shows the sales and profits of a company from 2000 to 2005. Construct a scatter diagram for the data and state whether sales and profits for this company have no correlation, a positive correlation, or a negative correlation for this period.
A) Negative correlation
B) Positive correlation
C) No correlation
D) No correlation
فتح الحزمة
افتح القفل للوصول البطاقات البالغ عددها 55 في هذه المجموعة.
فتح الحزمة
k this deck
21
Solve the problem. Round your answers to the nearest whole percent.
end
end فتح الحزمة
افتح القفل للوصول البطاقات البالغ عددها 55 في هذه المجموعة.
فتح الحزمة
k this deck
22
Write the coordinates of a point that would be an outlier on the following graph.
A)(23, 20)
B)(6, 5)
C)(20, 0)
D)(12, 10)
A)(23, 20)
B)(6, 5)
C)(20, 0)
D)(12, 10)
فتح الحزمة
افتح القفل للوصول البطاقات البالغ عددها 55 في هذه المجموعة.
فتح الحزمة
k this deck
23
To get the best deal on a microwave oven, Amanda called six appliance stores and asked the cost and volume of several models. The prices and volumes she was quoted are listed below. Amanda later learned that the group of 3 microwaves with volumes greater than 1 cubic foot and costing less than $200 were discontinued models Priced lower than normal. How does this change your view of the correlation?
A)Within each of the two groups, the correlation is less than it is overall.
B)The group of discontinued models has a stronger correlation than the other group.
C)There is little correlation either within the groups or overall.
D)Within each of the two groups, the correlation is stronger than it is overall.
فتح الحزمة
افتح القفل للوصول البطاقات البالغ عددها 55 في هذه المجموعة.
فتح الحزمة
k this deck
24
The table contains the weights (in pounds)and heights (in inches)of 9 randomly selected adults. Construct a scatter diagram for the data.
فتح الحزمة
افتح القفل للوصول البطاقات البالغ عددها 55 في هذه المجموعة.
فتح الحزمة
k this deck
25
Construct a scatter diagram with several groups of uncorrelated data but a strong correlation among all the data.
A)
B)
C)
D)
A)
B)
C)
D)
فتح الحزمة
افتح القفل للوصول البطاقات البالغ عددها 55 في هذه المجموعة.
فتح الحزمة
k this deck
26
Construct a scatter diagram with two groups of data, correlations within each group, but no correlation among all the data.
A)
B)
C)
D)
A)
B)
C)
D)
فتح الحزمة
افتح القفل للوصول البطاقات البالغ عددها 55 في هذه المجموعة.
فتح الحزمة
k this deck
27
Select the best-fit line for the data on the scatter diagram. If none of the lines fit the data, write "none of the lines".
Select the best-fit line on the scatter diagram below.
Select the best-fit line on the scatter diagram below.
فتح الحزمة
افتح القفل للوصول البطاقات البالغ عددها 55 في هذه المجموعة.
فتح الحزمة
k this deck
28
The table contains the weights (in pounds)and heights (in inches)of 9 randomly selected adults. Estimate or compute the correlation coefficient.
A)0.54
B)-0.73
C)-0.54
D)0.73
A)0.54
B)-0.73
C)-0.54
D)0.73
فتح الحزمة
افتح القفل للوصول البطاقات البالغ عددها 55 في هذه المجموعة.
فتح الحزمة
k this deck
29
To get the best deal on a microwave oven, Amanda called six appliance stores and asked the cost and volume of several models. The prices and volumes she was quoted are listed below. Construct a scatter diagram for the data.
فتح الحزمة
افتح القفل للوصول البطاقات البالغ عددها 55 في هذه المجموعة.
فتح الحزمة
k this deck
30
Including the outlier, estimate or compute the correlation coefficient for the complete data set.
A)-0.62
B)-0.83
C)0.83
D)0.62
A)-0.62
B)-0.83
C)0.83
D)0.62
فتح الحزمة
افتح القفل للوصول البطاقات البالغ عددها 55 في هذه المجموعة.
فتح الحزمة
k this deck
31
To get the best deal on a microwave oven, Amanda called six appliance stores and asked the cost and volume of several models. The prices and volumes she was quoted are listed below. Estimate or compute the correlation
Coefficient.
A)-0.3
B)0.3
C)-0.7
D)0.7
Coefficient.
A)-0.3
B)0.3
C)-0.7
D)0.7
فتح الحزمة
افتح القفل للوصول البطاقات البالغ عددها 55 في هذه المجموعة.
فتح الحزمة
k this deck
32
Construct a scatter diagram with two groups of data that have no correlation within either group but shows a moderate correlation among all the data.
A)
B)
C)
D)
A)
B)
C)
D)
فتح الحزمة
افتح القفل للوصول البطاقات البالغ عددها 55 في هذه المجموعة.
فتح الحزمة
k this deck
33
Select the best-fit line for the data on the scatter diagram. If none of the lines fit the data, write "none of the lines".
Select the best-fit line on the scatter diagram below.
Select the best-fit line on the scatter diagram below.
فتح الحزمة
افتح القفل للوصول البطاقات البالغ عددها 55 في هذه المجموعة.
فتح الحزمة
k this deck
34
Write possible coordinates for the single outlier such that it would no longer be an outlier.
A)(8, 25)
B)(8, 20)
C)(8, 5)
D)(25, 8)
A)(8, 25)
B)(8, 20)
C)(8, 5)
D)(25, 8)
فتح الحزمة
افتح القفل للوصول البطاقات البالغ عددها 55 في هذه المجموعة.
فتح الحزمة
k this deck
35
Select the best-fit line for the data on the scatter diagram. If none of the lines fit the data, write "none of the lines".
Select the best-fit line on the scatter diagram below.
Select the best-fit line on the scatter diagram below.
فتح الحزمة
افتح القفل للوصول البطاقات البالغ عددها 55 في هذه المجموعة.
فتح الحزمة
k this deck
36
Solve the problem. Round your answers to the nearest whole percent.
-
The scatter diagram shows the data for the prices of a stock (y) and U.S. employment (x). The correlation coeffici . Determine how much of the variation in the stock price can be accounted for by the best-fit line.
A)
B)
C)
D) cient r is
-
The scatter diagram shows the data for the prices of a stock (y) and U.S. employment (x). The correlation coeffici . Determine how much of the variation in the stock price can be accounted for by the best-fit line.
A)
B)
C)
D) cient r is
فتح الحزمة
افتح القفل للوصول البطاقات البالغ عددها 55 في هذه المجموعة.
فتح الحزمة
k this deck
37
Write possible coordinates for both outliers so that neither would be an outlier.
A)(8, 4)and (16, 19)
B)(8, 0)and (16,0)
C)(8, 19)and (16, 8)
D)(8, 4)and (16, 8)
A)(8, 4)and (16, 19)
B)(8, 0)and (16,0)
C)(8, 19)and (16, 8)
D)(8, 4)and (16, 8)
فتح الحزمة
افتح القفل للوصول البطاقات البالغ عددها 55 في هذه المجموعة.
فتح الحزمة
k this deck
38
The table contains the weights (in pounds)and heights (in inches)of 9 randomly selected adults. You learn that the five smallest weights were all women. How does this change your view of the correlation?
فتح الحزمة
افتح القفل للوصول البطاقات البالغ عددها 55 في هذه المجموعة.
فتح الحزمة
k this deck
39
Construct a scatter diagram with several groups of data such that there is no correlation of data within the groups and no correlation among all the data.
A)
B)
C)
D)
A)
B)
C)
D)
فتح الحزمة
افتح القفل للوصول البطاقات البالغ عددها 55 في هذه المجموعة.
فتح الحزمة
k this deck
40
Select the best-fit line for the data on the scatter diagram. If none of the lines fit the data, write "none of the lines".
Select the best-fit line on the scatter diagram below.
Select the best-fit line on the scatter diagram below.
فتح الحزمة
افتح القفل للوصول البطاقات البالغ عددها 55 في هذه المجموعة.
فتح الحزمة
k this deck
41
Determine whether the stated causal connection is valid or not valid.
The fuel economy of a car is affected by the car's type of upholstery.
A)Valid
B)Not valid
The fuel economy of a car is affected by the car's type of upholstery.
A)Valid
B)Not valid
فتح الحزمة
افتح القفل للوصول البطاقات البالغ عددها 55 في هذه المجموعة.
فتح الحزمة
k this deck
42
Determine whether the stated causal connection is valid or not valid.
Long-distance hikers sometimes get blisters on their feet.
A)Valid
B)Not valid
Long-distance hikers sometimes get blisters on their feet.
A)Valid
B)Not valid
فتح الحزمة
افتح القفل للوصول البطاقات البالغ عددها 55 في هذه المجموعة.
فتح الحزمة
k this deck
43
Determine whether the stated causal connection is valid or not valid.
The fuel economy of a car is affected by the car's engine size.
A)Valid
B)Not valid
The fuel economy of a car is affected by the car's engine size.
A)Valid
B)Not valid
فتح الحزمة
افتح القفل للوصول البطاقات البالغ عددها 55 في هذه المجموعة.
فتح الحزمة
k this deck
44
Solve the problem. Round your answers to the nearest whole percent.
The scatter diagram shows the data for attendance at the local team's hockey games (y)and the number of wins (x)for
That team. The correlation coefficient r is 0.4. Determine how much of the variation in attendance can be accounted for
By the best-fit line.
A)16%
B)36%
C)84%
D)25%
The scatter diagram shows the data for attendance at the local team's hockey games (y)and the number of wins (x)forThat team. The correlation coefficient r is 0.4. Determine how much of the variation in attendance can be accounted for
By the best-fit line.
A)16%
B)36%
C)84%
D)25%
فتح الحزمة
افتح القفل للوصول البطاقات البالغ عددها 55 في هذه المجموعة.
فتح الحزمة
k this deck
45
Solve the problem.
-There is a strong correlation between the number of homicides and the number of gas stations in a town. Local activists claim that building more gas stations will cause the homicide rate to rise. Evaluate the claim of causality.
-There is a strong correlation between the number of homicides and the number of gas stations in a town. Local activists claim that building more gas stations will cause the homicide rate to rise. Evaluate the claim of causality.
فتح الحزمة
افتح القفل للوصول البطاقات البالغ عددها 55 في هذه المجموعة.
فتح الحزمة
k this deck
46
Solve the problem.
-A local highway has an express lane that contains no exits and runs parallel to the other lanes for five miles before merging back with them. A study found that during rush hour traffic, driving times in the express lane were strongly correlated with the longest travel times over the five mile stretch in question. One driver commented that the express lane causes traffic slowdowns and was a waste of money. Comment on how persuasive this comment is and how additional research could help.
-A local highway has an express lane that contains no exits and runs parallel to the other lanes for five miles before merging back with them. A study found that during rush hour traffic, driving times in the express lane were strongly correlated with the longest travel times over the five mile stretch in question. One driver commented that the express lane causes traffic slowdowns and was a waste of money. Comment on how persuasive this comment is and how additional research could help.
فتح الحزمة
افتح القفل للوصول البطاقات البالغ عددها 55 في هذه المجموعة.
فتح الحزمة
k this deck
47
Answer the question using the value of r and the given best-fit line on the scatter diagram.
- The scatter diagram and best-fit line show the data for the price of a stock (y)and U.S. employment (x). The correlation coefficient r is 0.8. Predict the stock price for an employment value of 5.
A)5.9
B)4.9
C)7
D)No valid prediction is possible.
-
The scatter diagram and best-fit line show the data for the price of a stock (y)and U.S. employment (x). The correlation coefficient r is 0.8. Predict the stock price for an employment value of 5.A)5.9
B)4.9
C)7
D)No valid prediction is possible.
فتح الحزمة
افتح القفل للوصول البطاقات البالغ عددها 55 في هذه المجموعة.
فتح الحزمة
k this deck
48
Solve the problem.
-A study found a strong correlation between excessive red meat consumption and cholesterol problems . If excessive red meat consumption causes cholesterol problems , how could some of the people in the study frequently eat red meat and yet show no signs of cholesterol problems ?
-A study found a strong correlation between excessive red meat consumption and cholesterol problems . If excessive red meat consumption causes cholesterol problems , how could some of the people in the study frequently eat red meat and yet show no signs of cholesterol problems ?
فتح الحزمة
افتح القفل للوصول البطاقات البالغ عددها 55 في هذه المجموعة.
فتح الحزمة
k this deck
49
Solve the problem.
-A reporter studied the causes of household fires in his town and found a strong correlation between the damages (in dollars)and the number of fire trucks at the scene. The reporter's newspaper ran a headline claiming that using more fire trucks at the scene seems to cause more harm than good. Is the newspaper right in
their claim?
فتح الحزمة
افتح القفل للوصول البطاقات البالغ عددها 55 في هذه المجموعة.
فتح الحزمة
k this deck
50
Answer the question using the value of r and the given best-fit line on the scatter diagram.
- The scatter diagram and best-fit line show the data for the number of cars waiting by a school (y)and the amount of time after the end of classes (x). The correlation coefficient r is -0.55. Predict the number of cars at time 8
After the end of classes.
A)6
B)No valid prediction is possible.
C)5
D)7
-
The scatter diagram and best-fit line show the data for the number of cars waiting by a school (y)and the amount of time after the end of classes (x). The correlation coefficient r is -0.55. Predict the number of cars at time 8After the end of classes.
A)6
B)No valid prediction is possible.
C)5
D)7
فتح الحزمة
افتح القفل للوصول البطاقات البالغ عددها 55 في هذه المجموعة.
فتح الحزمة
k this deck
51
Answer the question using the value of r and the given best-fit line on the scatter diagram.
- The scatter diagram and best-fit line show the data for price per item (y)and the availability of that item (x). The correlation coefficient r is -0.95. Predict the price per item for an availability of 3.
A)7.8
B)6.8
C)No valid prediction is possible.
D)8.8
-
The scatter diagram and best-fit line show the data for price per item (y)and the availability of that item (x). The correlation coefficient r is -0.95. Predict the price per item for an availability of 3.A)7.8
B)6.8
C)No valid prediction is possible.
D)8.8
فتح الحزمة
افتح القفل للوصول البطاقات البالغ عددها 55 في هذه المجموعة.
فتح الحزمة
k this deck
52
Determine whether the stated causal connection is valid or not valid.
The distance that a hit golf ball travels is caused by the strength of the golfer.
A)Valid
B)Not valid
The distance that a hit golf ball travels is caused by the strength of the golfer.
A)Valid
B)Not valid
فتح الحزمة
افتح القفل للوصول البطاقات البالغ عددها 55 في هذه المجموعة.
فتح الحزمة
k this deck
53
Solve the problem. Round your answers to the nearest whole percent.
The scatter diagram shows the data for price per item (y)and the availability of that item (x). The correlation coefficient r
Is -0.95. Determine how much of the variation in price per item can be accounted for by the best-fit line.
A)5%
B)10%
C)95%
D)90%
The scatter diagram shows the data for price per item (y)and the availability of that item (x). The correlation coefficient rIs -0.95. Determine how much of the variation in price per item can be accounted for by the best-fit line.
A)5%
B)10%
C)95%
D)90%
فتح الحزمة
افتح القفل للوصول البطاقات البالغ عددها 55 في هذه المجموعة.
فتح الحزمة
k this deck
54
Determine whether the stated causal connection is valid or not valid.
Alcohol intoxication can be prevented by drinking light beer.
A)Valid
B)Not valid
Alcohol intoxication can be prevented by drinking light beer.
A)Valid
B)Not valid
فتح الحزمة
افتح القفل للوصول البطاقات البالغ عددها 55 في هذه المجموعة.
فتح الحزمة
k this deck
55
Answer the question using the value of r and the given best-fit line on the scatter diagram.
-
The scatter diagram and best-fit line show the data for the price of a stock (y)and U.S. employment (x). The correlation coefficient r is 0.8. Predict the stock price for an employment value of 11.
A)9.8
B)9
C)8
D)No valid prediction is possible.
-
The scatter diagram and best-fit line show the data for the price of a stock (y)and U.S. employment (x). The correlation coefficient r is 0.8. Predict the stock price for an employment value of 11.
A)9.8
B)9
C)8
D)No valid prediction is possible.
فتح الحزمة
افتح القفل للوصول البطاقات البالغ عددها 55 في هذه المجموعة.
فتح الحزمة
k this deck
فتح الحزمة
افتح القفل للوصول البطاقات البالغ عددها 55 في هذه المجموعة.


