Deck 19: Statistical Applications in Quality Management
ملء الشاشة (f)
سؤال
سؤال
SCENARIO 19-2 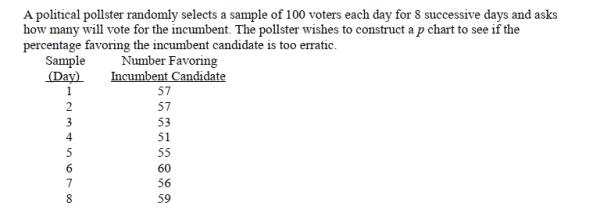
Referring to Scenario 19-2, which expression best characterizes the p chart?
A) In-control
B) Increasing trend
C) Decreasing trend
D) Individual outliers
Referring to Scenario 19-2, which expression best characterizes the p chart?
A) In-control
B) Increasing trend
C) Decreasing trend
D) Individual outliers
سؤال
سؤال
SCENARIO 19-3 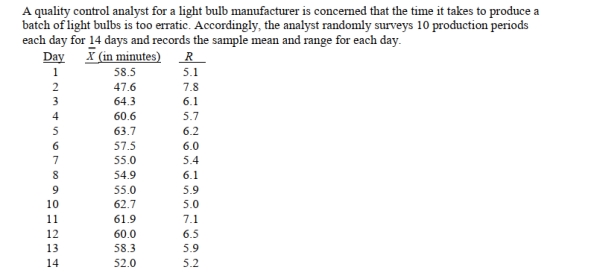
Referring to Scenario 19-3, suppose the analyst constructs an R chart to see if the variability in
Production times is in-control.What is the lower control limit for this R chart?
A) 4.84
B) 3.37
C) 2.98
D) 1.34
Referring to Scenario 19-3, suppose the analyst constructs an R chart to see if the variability in
Production times is in-control.What is the lower control limit for this R chart?
A) 4.84
B) 3.37
C) 2.98
D) 1.34
سؤال
سؤال
SCENARIO 19-2
Referring to Scenario 19-2, what is the numerical value of the upper control limit for the p chart?
A) 0.92
B) 0.89
C) 0.71
D) 0.62
Referring to Scenario 19-2, what is the numerical value of the upper control limit for the p chart?
A) 0.92
B) 0.89
C) 0.71
D) 0.62
سؤال
SCENARIO 19-3
Referring to Scenario 19-3, suppose the analyst constructs an R chart to see if the variability in
Production times is in-control.What is the upper control limit for this R chart?
A) 10.66
B) 9.37
C) 7.98
D) 6.34
Referring to Scenario 19-3, suppose the analyst constructs an R chart to see if the variability in
Production times is in-control.What is the upper control limit for this R chart?
A) 10.66
B) 9.37
C) 7.98
D) 6.34
سؤال
سؤال
SCENARIO 19-1 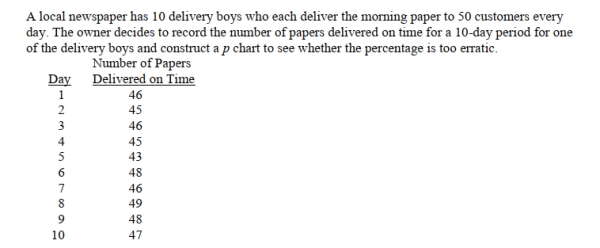
Referring to Scenario 19-1, what is the numerical value of the lower control limit for the p chart?
A) 0.920
B) 0.911
C) 0.815
D) 0.798
Referring to Scenario 19-1, what is the numerical value of the lower control limit for the p chart?
A) 0.920
B) 0.911
C) 0.815
D) 0.798
سؤال
SCENARIO 19-2
Referring to Scenario 19-2, what is the numerical value of the lower control limit for the p chart?
A) 0.37
B) 0.41
C) 0.50
D) 0.71
Referring to Scenario 19-2, what is the numerical value of the lower control limit for the p chart?
A) 0.37
B) 0.41
C) 0.50
D) 0.71
سؤال
سؤال
سؤال
سؤال
SCENARIO 19-1
Referring to Scenario 19-1, which expression best characterizes the p chart?
A) Cycles
B) Increasing trend
C) In-control
D) Individual outliers
Referring to Scenario 19-1, which expression best characterizes the p chart?
A) Cycles
B) Increasing trend
C) In-control
D) Individual outliers
سؤال
SCENARIO 19-3
Referring to Scenario 19-3, suppose the analyst constructs an R chart to see if the variability in
Production times is in-control.What is the center line of this R chart?
A) 4.8
B) 6.0
C) 6.9
D) 7.1
Referring to Scenario 19-3, suppose the analyst constructs an R chart to see if the variability in
Production times is in-control.What is the center line of this R chart?
A) 4.8
B) 6.0
C) 6.9
D) 7.1
سؤال
SCENARIO 19-2
Referring to Scenario 19-2, what is the numerical value of the center line for the p chart?
A) 0.53
B) 0.56
C) 0.63
D) 0.66
Referring to Scenario 19-2, what is the numerical value of the center line for the p chart?
A) 0.53
B) 0.56
C) 0.63
D) 0.66
سؤال
SCENARIO 19-1
Referring to Scenario 19-1, what is the numerical value of the upper control limit for the p chart?
A) 0.926
B) 0.961
C) 0.979
D) 1.037
Referring to Scenario 19-1, what is the numerical value of the upper control limit for the p chart?
A) 0.926
B) 0.961
C) 0.979
D) 1.037
سؤال
سؤال
سؤال
SCENARIO 19-1
Referring to Scenario 19-1, what is the numerical value of the center line for the p chart?
A) 0.926
B) 0.911
C) 0.885
D) 0.500
Referring to Scenario 19-1, what is the numerical value of the center line for the p chart?
A) 0.926
B) 0.911
C) 0.885
D) 0.500
سؤال
سؤال
SCENARIO 19-3
Referring to Scenario 19-3, suppose the analyst constructs an chart to see if the production
Process is in-control.What is the lower control limit (LCL)for this chart?
A) 47.60
B) 56.15
C) 57.15
D) 58.05
Referring to Scenario 19-3, suppose the analyst constructs an
chart to see if the productionProcess is in-control.What is the lower control limit (LCL)for this chart?
A) 47.60
B) 56.15
C) 57.15
D) 58.05
سؤال
SCENARIO 19-3
Referring to Scenario 19-3, suppose the analyst constructs an chart to see if the production
Process is in-control.Which expression best describes this chart?
A) In-control
B) Increasing trend
C) Decreasing trend
D) Individual outliers
Referring to Scenario 19-3, suppose the analyst constructs an
chart to see if the productionProcess is in-control.Which expression best describes this chart?
A) In-control
B) Increasing trend
C) Decreasing trend
D) Individual outliers
سؤال
سؤال
SCENARIO 19-3
Referring to Scenario 19-3, suppose the analyst constructs an chart to see if the production
Process is in-control.What is the upper control limit (UCL)for this chart?
A) 62.15
B) 60.95
C) 59.85
D) 58.75
Referring to Scenario 19-3, suppose the analyst constructs an
chart to see if the productionProcess is in-control.What is the upper control limit (UCL)for this chart?
A) 62.15
B) 60.95
C) 59.85
D) 58.75
سؤال
SCENARIO 19-4 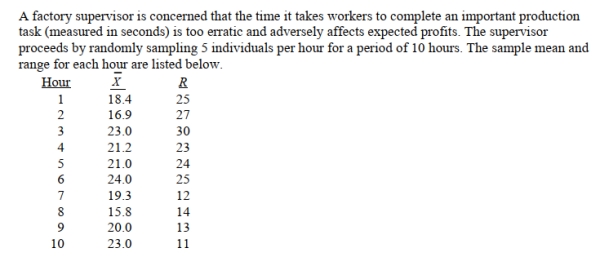 She also decides that lower and upper specification limit for the critical-to-quality variable should be
10 and 30 seconds, respectively.
Referring to Scenario 19-4, suppose the supervisor constructs an chart to see if the process is
In-control.Which expression best describes this chart?
A) Decreasing trend
B) In-control
C) Increasing trend
D) Individual outliers
She also decides that lower and upper specification limit for the critical-to-quality variable should be10 and 30 seconds, respectively.
Referring to Scenario 19-4, suppose the supervisor constructs an
chart to see if the process isIn-control.Which expression best describes this chart?
A) Decreasing trend
B) In-control
C) Increasing trend
D) Individual outliers
سؤال
SCENARIO 19-3
Referring to Scenario 19-3, suppose the sample mean and range data were based on 11
Observations per day instead of 10.How would this change affect the lower and upper control
Limits of the R chart?
A) LCL would increase; UCL would decrease.
B) LCL would remain the same; UCL would decrease.
C) Both LCL and UCL would remain the same.
D) LCL would decrease; UCL would increase.
سؤال
سؤال
SCENARIO 19-4 She also decides that lower and upper specification limit for the critical-to-quality variable should be
10 and 30 seconds, respectively.
Referring to Scenario 19-4, suppose the sample mean and range data were based on 6
Observations per hour instead of 5.How would this change affect the lower and upper control
Limits of an R chart?
A) LCL would increase; UCL would decrease.
B) LCL would remain the same; UCL would decrease.
C) Both LCL and UCL would remain the same.
D) LCL would decrease; UCL would increase.
She also decides that lower and upper specification limit for the critical-to-quality variable should be10 and 30 seconds, respectively.
Referring to Scenario 19-4, suppose the sample mean and range data were based on 6
Observations per hour instead of 5.How would this change affect the lower and upper control
Limits of an R chart?
A) LCL would increase; UCL would decrease.
B) LCL would remain the same; UCL would decrease.
C) Both LCL and UCL would remain the same.
D) LCL would decrease; UCL would increase.
سؤال
سؤال
SCENARIO 19-4 She also decides that lower and upper specification limit for the critical-to-quality variable should be
10 and 30 seconds, respectively.
Referring to Scenario 19-4, suppose the supervisor constructs an R chart to see if the variability in
Collection times is in-control.What are the lower and upper control limits for this R chart?
A) - 2.33, 43.13
B) - 2.28, 42.28
C) 0, 42.28
D) 0, 43.13
She also decides that lower and upper specification limit for the critical-to-quality variable should be10 and 30 seconds, respectively.
Referring to Scenario 19-4, suppose the supervisor constructs an R chart to see if the variability in
Collection times is in-control.What are the lower and upper control limits for this R chart?
A) - 2.33, 43.13
B) - 2.28, 42.28
C) 0, 42.28
D) 0, 43.13
سؤال
سؤال
SCENARIO 19-4 She also decides that lower and upper specification limit for the critical-to-quality variable should be
10 and 30 seconds, respectively.
Referring to Scenario 19-4, suppose the supervisor constructs an R chart to see if the variability in
Collection times is in-control.This R chart is characterized by which of the following?
A) Decreasing trend
B) Increasing trend
C) In-control
D) Individual outliers
She also decides that lower and upper specification limit for the critical-to-quality variable should be10 and 30 seconds, respectively.
Referring to Scenario 19-4, suppose the supervisor constructs an R chart to see if the variability in
Collection times is in-control.This R chart is characterized by which of the following?
A) Decreasing trend
B) Increasing trend
C) In-control
D) Individual outliers
سؤال
سؤال
سؤال
SCENARIO 19-4 She also decides that lower and upper specification limit for the critical-to-quality variable should be
10 and 30 seconds, respectively.
Referring to Scenario 19-4, suppose the supervisor constructs an R chart to see if the variability in
Collection times is in-control.What is the center line of this R chart?
A) 20.00
B) 20.56
C) 20.40
D) 24.00
She also decides that lower and upper specification limit for the critical-to-quality variable should be10 and 30 seconds, respectively.
Referring to Scenario 19-4, suppose the supervisor constructs an R chart to see if the variability in
Collection times is in-control.What is the center line of this R chart?
A) 20.00
B) 20.56
C) 20.40
D) 24.00
سؤال
SCENARIO 19-4 She also decides that lower and upper specification limit for the critical-to-quality variable should be
10 and 30 seconds, respectively.
Referring to Scenario 19-4, suppose the supervisor constructs an chart to see if the process is
In-control.What are the lower and upper control limits of this chart?
A) 10.00, 30.00
B) 8.49, 32.03
C) 5.39, 35.13
D) 4.96, 35.56
She also decides that lower and upper specification limit for the critical-to-quality variable should be10 and 30 seconds, respectively.
Referring to Scenario 19-4, suppose the supervisor constructs an
chart to see if the process isIn-control.What are the lower and upper control limits of this chart?
A) 10.00, 30.00
B) 8.49, 32.03
C) 5.39, 35.13
D) 4.96, 35.56
سؤال
SCENARIO 19-3
Referring to Scenario 19-3, suppose the analyst constructs an R chart to see if the variability in
Production times is in-control.The R chart is characterized by which of the following?
A) Increasing trend
B) Decreasing trend
C) In-control
D) Points outside the control limits
Referring to Scenario 19-3, suppose the analyst constructs an R chart to see if the variability in
Production times is in-control.The R chart is characterized by which of the following?
A) Increasing trend
B) Decreasing trend
C) In-control
D) Points outside the control limits
سؤال
SCENARIO 19-4 She also decides that lower and upper specification limit for the critical-to-quality variable should be
10 and 30 seconds, respectively.
Referring to Scenario 19-4, suppose the supervisor constructs an chart to see if the process is
In-control.What is the center line of the chart?
A) 20.00
B) 20.26
C) 21.00
D) 24.26
She also decides that lower and upper specification limit for the critical-to-quality variable should be10 and 30 seconds, respectively.
Referring to Scenario 19-4, suppose the supervisor constructs an
chart to see if the process isIn-control.What is the center line of the chart?
A) 20.00
B) 20.26
C) 21.00
D) 24.26
سؤال
SCENARIO 19-3
Referring to Scenario 19-3, suppose the analyst constructs an chart to see if the production
Process is in-control.What is the center line for this chart?
A) 64.3
B) 59.5
C) 58.0
D) 57.1
Referring to Scenario 19-3, suppose the analyst constructs an
chart to see if the productionProcess is in-control.What is the center line for this chart?
A) 64.3
B) 59.5
C) 58.0
D) 57.1
سؤال
سؤال
سؤال
سؤال
True or False: It is not possible for the 
chart to be out-of-control when the R chart is in control.
chart to be out-of-control when the R chart is in control.
سؤال
سؤال
سؤال
Which of the following is a method for breaking process into a series of steps in order to
Eliminate defects and produce near perfect results?
A) Deming's 14 points management.
B) Six Sigma management.
C) Shewhart-Deming cycle.
D) R chart and chart.
Eliminate defects and produce near perfect results?
A) Deming's 14 points management.
B) Six Sigma management.
C) Shewhart-Deming cycle.
D) R chart and
chart. سؤال
سؤال
سؤال
سؤال
سؤال
سؤال
سؤال
سؤال
سؤال
سؤال
سؤال
True or False: Referring to Scenario 19-8, based on the 
chart, it appears that the process is in
control.
chart, it appears that the process is in
control.
سؤال
سؤال
سؤال
سؤال
سؤال
سؤال
سؤال
سؤال
سؤال
سؤال
سؤال
سؤال
سؤال
سؤال
سؤال
سؤال
سؤال
سؤال
سؤال
سؤال
سؤال
سؤال

فتح الحزمة
قم بالتسجيل لفتح البطاقات في هذه المجموعة!
Unlock Deck
Unlock Deck
1/86
العب
ملء الشاشة (f)
Deck 19: Statistical Applications in Quality Management
1
Variation due to the inherent variability in a system of operation is called
A) special or assignable causes.
B) common or chance causes.
C) explained variation.
D) the standard deviation.
A) special or assignable causes.
B) common or chance causes.
C) explained variation.
D) the standard deviation.
B
2
SCENARIO 19-2
Referring to Scenario 19-2, which expression best characterizes the p chart?
A) In-control
B) Increasing trend
C) Decreasing trend
D) Individual outliers
Referring to Scenario 19-2, which expression best characterizes the p chart?
A) In-control
B) Increasing trend
C) Decreasing trend
D) Individual outliers
A
3
Variation signaled by individual fluctuations or patterns in the data is called
A) special or assignable causes.
B) common or chance causes.
C) explained variation.
D) the standard deviation.
A) special or assignable causes.
B) common or chance causes.
C) explained variation.
D) the standard deviation.
A
4
SCENARIO 19-3
Referring to Scenario 19-3, suppose the analyst constructs an R chart to see if the variability in
Production times is in-control.What is the lower control limit for this R chart?
A) 4.84
B) 3.37
C) 2.98
D) 1.34
Referring to Scenario 19-3, suppose the analyst constructs an R chart to see if the variability in
Production times is in-control.What is the lower control limit for this R chart?
A) 4.84
B) 3.37
C) 2.98
D) 1.34
فتح الحزمة
افتح القفل للوصول البطاقات البالغ عددها 86 في هذه المجموعة.
فتح الحزمة
k this deck
5
One of the morals of the red bead experiment is:
A) variation is part of the process.
B) only management can change the system.
C) it is the system that primarily determines performance.
D) All of the above.
A) variation is part of the process.
B) only management can change the system.
C) it is the system that primarily determines performance.
D) All of the above.
فتح الحزمة
افتح القفل للوصول البطاقات البالغ عددها 86 في هذه المجموعة.
فتح الحزمة
k this deck
6
SCENARIO 19-2
Referring to Scenario 19-2, what is the numerical value of the upper control limit for the p chart?
A) 0.92
B) 0.89
C) 0.71
D) 0.62
Referring to Scenario 19-2, what is the numerical value of the upper control limit for the p chart?
A) 0.92
B) 0.89
C) 0.71
D) 0.62
فتح الحزمة
افتح القفل للوصول البطاقات البالغ عددها 86 في هذه المجموعة.
فتح الحزمة
k this deck
7
SCENARIO 19-3
Referring to Scenario 19-3, suppose the analyst constructs an R chart to see if the variability in
Production times is in-control.What is the upper control limit for this R chart?
A) 10.66
B) 9.37
C) 7.98
D) 6.34
Referring to Scenario 19-3, suppose the analyst constructs an R chart to see if the variability in
Production times is in-control.What is the upper control limit for this R chart?
A) 10.66
B) 9.37
C) 7.98
D) 6.34
فتح الحزمة
افتح القفل للوصول البطاقات البالغ عددها 86 في هذه المجموعة.
فتح الحزمة
k this deck
8
Once the control limits are set for a control chart, one attempts to
A) discern patterns that might exist in values over time.
B) determine whether any points fall outside the control limits.
C) Both of the above.
D) None of the above.
A) discern patterns that might exist in values over time.
B) determine whether any points fall outside the control limits.
C) Both of the above.
D) None of the above.
فتح الحزمة
افتح القفل للوصول البطاقات البالغ عددها 86 في هذه المجموعة.
فتح الحزمة
k this deck
9
SCENARIO 19-1
Referring to Scenario 19-1, what is the numerical value of the lower control limit for the p chart?
A) 0.920
B) 0.911
C) 0.815
D) 0.798
Referring to Scenario 19-1, what is the numerical value of the lower control limit for the p chart?
A) 0.920
B) 0.911
C) 0.815
D) 0.798
فتح الحزمة
افتح القفل للوصول البطاقات البالغ عددها 86 في هذه المجموعة.
فتح الحزمة
k this deck
10
SCENARIO 19-2
Referring to Scenario 19-2, what is the numerical value of the lower control limit for the p chart?
A) 0.37
B) 0.41
C) 0.50
D) 0.71
Referring to Scenario 19-2, what is the numerical value of the lower control limit for the p chart?
A) 0.37
B) 0.41
C) 0.50
D) 0.71
فتح الحزمة
افتح القفل للوصول البطاقات البالغ عددها 86 في هذه المجموعة.
فتح الحزمة
k this deck
11
The control chart
A) focuses on the time dimension of a system.
B) captures the natural variability in the system.
C) can be used for categorical, discrete, or continuous variables.
D) All of the above.
A) focuses on the time dimension of a system.
B) captures the natural variability in the system.
C) can be used for categorical, discrete, or continuous variables.
D) All of the above.
فتح الحزمة
افتح القفل للوصول البطاقات البالغ عددها 86 في هذه المجموعة.
فتح الحزمة
k this deck
12
A process is said to be out of control if
A) a point falls above the upper or below the lower control lines.
B) eight or more consecutive points fall above the center line or eight or more consecutive points fall below the center line.
C) Either of the above.
D) None of the above.
A) a point falls above the upper or below the lower control lines.
B) eight or more consecutive points fall above the center line or eight or more consecutive points fall below the center line.
C) Either of the above.
D) None of the above.
فتح الحزمة
افتح القفل للوصول البطاقات البالغ عددها 86 في هذه المجموعة.
فتح الحزمة
k this deck
13
Which of the following situations suggests a process that appears to be operating in a state of
Statistical control?
A) A control chart with a series of consecutive points that are above the center line and a series of consecutive points that are below the center line.
B) A control chart in which no points fall outside either the upper control limit or the lower control limit and no patterns are present.
C) A control chart in which several points fall outside the upper control limit.
D) All of the above.
فتح الحزمة
افتح القفل للوصول البطاقات البالغ عددها 86 في هذه المجموعة.
فتح الحزمة
k this deck
14
SCENARIO 19-1
Referring to Scenario 19-1, which expression best characterizes the p chart?
A) Cycles
B) Increasing trend
C) In-control
D) Individual outliers
Referring to Scenario 19-1, which expression best characterizes the p chart?
A) Cycles
B) Increasing trend
C) In-control
D) Individual outliers
فتح الحزمة
افتح القفل للوصول البطاقات البالغ عددها 86 في هذه المجموعة.
فتح الحزمة
k this deck
15
SCENARIO 19-3
Referring to Scenario 19-3, suppose the analyst constructs an R chart to see if the variability in
Production times is in-control.What is the center line of this R chart?
A) 4.8
B) 6.0
C) 6.9
D) 7.1
Referring to Scenario 19-3, suppose the analyst constructs an R chart to see if the variability in
Production times is in-control.What is the center line of this R chart?
A) 4.8
B) 6.0
C) 6.9
D) 7.1
فتح الحزمة
افتح القفل للوصول البطاقات البالغ عددها 86 في هذه المجموعة.
فتح الحزمة
k this deck
16
SCENARIO 19-2
Referring to Scenario 19-2, what is the numerical value of the center line for the p chart?
A) 0.53
B) 0.56
C) 0.63
D) 0.66
Referring to Scenario 19-2, what is the numerical value of the center line for the p chart?
A) 0.53
B) 0.56
C) 0.63
D) 0.66
فتح الحزمة
افتح القفل للوصول البطاقات البالغ عددها 86 في هذه المجموعة.
فتح الحزمة
k this deck
17
SCENARIO 19-1
Referring to Scenario 19-1, what is the numerical value of the upper control limit for the p chart?
A) 0.926
B) 0.961
C) 0.979
D) 1.037
Referring to Scenario 19-1, what is the numerical value of the upper control limit for the p chart?
A) 0.926
B) 0.961
C) 0.979
D) 1.037
فتح الحزمة
افتح القفل للوصول البطاقات البالغ عددها 86 في هذه المجموعة.
فتح الحزمة
k this deck
18
Which of the following situations suggests a process that appears to be operating out of statistical
Control?
A) A control chart with a series of consecutive points that are above the center line and a series of consecutive points that are below the center line.
B) A control chart in which points fall outside the lower control limit.
C) A control chart in which several points fall outside the upper control limit.
D) All of the above.
فتح الحزمة
افتح القفل للوصول البطاقات البالغ عددها 86 في هذه المجموعة.
فتح الحزمة
k this deck
19
The principal focus of the control chart is the attempt to separate special or assignable causes of
Variation from common causes of variation.Which causes of variation can be reduced only by
Changing the system?
A) Special or assignable causes
B) Common causes
C) Total causes
D) None of the above
Variation from common causes of variation.Which causes of variation can be reduced only by
Changing the system?
A) Special or assignable causes
B) Common causes
C) Total causes
D) None of the above
فتح الحزمة
افتح القفل للوصول البطاقات البالغ عددها 86 في هذه المجموعة.
فتح الحزمة
k this deck
20
SCENARIO 19-1
Referring to Scenario 19-1, what is the numerical value of the center line for the p chart?
A) 0.926
B) 0.911
C) 0.885
D) 0.500
Referring to Scenario 19-1, what is the numerical value of the center line for the p chart?
A) 0.926
B) 0.911
C) 0.885
D) 0.500
فتح الحزمة
افتح القفل للوصول البطاقات البالغ عددها 86 في هذه المجموعة.
فتح الحزمة
k this deck
21
True or False: Changes in the system to reduce common cause variation are the responsibility of
management.
management.
فتح الحزمة
افتح القفل للوصول البطاقات البالغ عددها 86 في هذه المجموعة.
فتح الحزمة
k this deck
22
SCENARIO 19-3
Referring to Scenario 19-3, suppose the analyst constructs an chart to see if the production
Process is in-control.What is the lower control limit (LCL)for this chart?
A) 47.60
B) 56.15
C) 57.15
D) 58.05
Referring to Scenario 19-3, suppose the analyst constructs an
chart to see if the productionProcess is in-control.What is the lower control limit (LCL)for this chart?
A) 47.60
B) 56.15
C) 57.15
D) 58.05
فتح الحزمة
افتح القفل للوصول البطاقات البالغ عددها 86 في هذه المجموعة.
فتح الحزمة
k this deck
23
SCENARIO 19-3
Referring to Scenario 19-3, suppose the analyst constructs an chart to see if the production
Process is in-control.Which expression best describes this chart?
A) In-control
B) Increasing trend
C) Decreasing trend
D) Individual outliers
Referring to Scenario 19-3, suppose the analyst constructs an
chart to see if the productionProcess is in-control.Which expression best describes this chart?
A) In-control
B) Increasing trend
C) Decreasing trend
D) Individual outliers
فتح الحزمة
افتح القفل للوصول البطاقات البالغ عددها 86 في هذه المجموعة.
فتح الحزمة
k this deck
24
True or False: Common causes of variation represent variation due to the inherent variability in
the system.
the system.
فتح الحزمة
افتح القفل للوصول البطاقات البالغ عددها 86 في هذه المجموعة.
فتح الحزمة
k this deck
25
SCENARIO 19-3
Referring to Scenario 19-3, suppose the analyst constructs an chart to see if the production
Process is in-control.What is the upper control limit (UCL)for this chart?
A) 62.15
B) 60.95
C) 59.85
D) 58.75
Referring to Scenario 19-3, suppose the analyst constructs an
chart to see if the productionProcess is in-control.What is the upper control limit (UCL)for this chart?
A) 62.15
B) 60.95
C) 59.85
D) 58.75
فتح الحزمة
افتح القفل للوصول البطاقات البالغ عددها 86 في هذه المجموعة.
فتح الحزمة
k this deck
26
SCENARIO 19-4 She also decides that lower and upper specification limit for the critical-to-quality variable should be
10 and 30 seconds, respectively.
Referring to Scenario 19-4, suppose the supervisor constructs an chart to see if the process is
In-control.Which expression best describes this chart?
A) Decreasing trend
B) In-control
C) Increasing trend
D) Individual outliers
She also decides that lower and upper specification limit for the critical-to-quality variable should be10 and 30 seconds, respectively.
Referring to Scenario 19-4, suppose the supervisor constructs an
chart to see if the process isIn-control.Which expression best describes this chart?
A) Decreasing trend
B) In-control
C) Increasing trend
D) Individual outliers
فتح الحزمة
افتح القفل للوصول البطاقات البالغ عددها 86 في هذه المجموعة.
فتح الحزمة
k this deck
27
SCENARIO 19-3
Referring to Scenario 19-3, suppose the sample mean and range data were based on 11
Observations per day instead of 10.How would this change affect the lower and upper control
Limits of the R chart?
A) LCL would increase; UCL would decrease.
B) LCL would remain the same; UCL would decrease.
C) Both LCL and UCL would remain the same.
D) LCL would decrease; UCL would increase.
فتح الحزمة
افتح القفل للوصول البطاقات البالغ عددها 86 في هذه المجموعة.
فتح الحزمة
k this deck
28
True or False: Common causes of variation are correctable without modifying the system.
فتح الحزمة
افتح القفل للوصول البطاقات البالغ عددها 86 في هذه المجموعة.
فتح الحزمة
k this deck
29
SCENARIO 19-4 She also decides that lower and upper specification limit for the critical-to-quality variable should be
10 and 30 seconds, respectively.
Referring to Scenario 19-4, suppose the sample mean and range data were based on 6
Observations per hour instead of 5.How would this change affect the lower and upper control
Limits of an R chart?
A) LCL would increase; UCL would decrease.
B) LCL would remain the same; UCL would decrease.
C) Both LCL and UCL would remain the same.
D) LCL would decrease; UCL would increase.
She also decides that lower and upper specification limit for the critical-to-quality variable should be10 and 30 seconds, respectively.
Referring to Scenario 19-4, suppose the sample mean and range data were based on 6
Observations per hour instead of 5.How would this change affect the lower and upper control
Limits of an R chart?
A) LCL would increase; UCL would decrease.
B) LCL would remain the same; UCL would decrease.
C) Both LCL and UCL would remain the same.
D) LCL would decrease; UCL would increase.
فتح الحزمة
افتح القفل للوصول البطاقات البالغ عددها 86 في هذه المجموعة.
فتح الحزمة
k this deck
30
True or False: One of the morals of the red bead experiment is that variation is part of any
process.
process.
فتح الحزمة
افتح القفل للوصول البطاقات البالغ عددها 86 في هذه المجموعة.
فتح الحزمة
k this deck
31
SCENARIO 19-4 She also decides that lower and upper specification limit for the critical-to-quality variable should be
10 and 30 seconds, respectively.
Referring to Scenario 19-4, suppose the supervisor constructs an R chart to see if the variability in
Collection times is in-control.What are the lower and upper control limits for this R chart?
A) - 2.33, 43.13
B) - 2.28, 42.28
C) 0, 42.28
D) 0, 43.13
She also decides that lower and upper specification limit for the critical-to-quality variable should be10 and 30 seconds, respectively.
Referring to Scenario 19-4, suppose the supervisor constructs an R chart to see if the variability in
Collection times is in-control.What are the lower and upper control limits for this R chart?
A) - 2.33, 43.13
B) - 2.28, 42.28
C) 0, 42.28
D) 0, 43.13
فتح الحزمة
افتح القفل للوصول البطاقات البالغ عددها 86 في هذه المجموعة.
فتح الحزمة
k this deck
32
True or False: The purpose of a control chart is to eliminate common cause variation.
فتح الحزمة
افتح القفل للوصول البطاقات البالغ عددها 86 في هذه المجموعة.
فتح الحزمة
k this deck
33
SCENARIO 19-4 She also decides that lower and upper specification limit for the critical-to-quality variable should be
10 and 30 seconds, respectively.
Referring to Scenario 19-4, suppose the supervisor constructs an R chart to see if the variability in
Collection times is in-control.This R chart is characterized by which of the following?
A) Decreasing trend
B) Increasing trend
C) In-control
D) Individual outliers
She also decides that lower and upper specification limit for the critical-to-quality variable should be10 and 30 seconds, respectively.
Referring to Scenario 19-4, suppose the supervisor constructs an R chart to see if the variability in
Collection times is in-control.This R chart is characterized by which of the following?
A) Decreasing trend
B) Increasing trend
C) In-control
D) Individual outliers
فتح الحزمة
افتح القفل للوصول البطاقات البالغ عددها 86 في هذه المجموعة.
فتح الحزمة
k this deck
34
True or False: Special or assignable causes of variation are signaled by individual fluctuations or
patterns in the data.
patterns in the data.
فتح الحزمة
افتح القفل للوصول البطاقات البالغ عددها 86 في هذه المجموعة.
فتح الحزمة
k this deck
35
True or False: The control limits are based on the standard deviation of the process.
فتح الحزمة
افتح القفل للوصول البطاقات البالغ عددها 86 في هذه المجموعة.
فتح الحزمة
k this deck
36
SCENARIO 19-4 She also decides that lower and upper specification limit for the critical-to-quality variable should be
10 and 30 seconds, respectively.
Referring to Scenario 19-4, suppose the supervisor constructs an R chart to see if the variability in
Collection times is in-control.What is the center line of this R chart?
A) 20.00
B) 20.56
C) 20.40
D) 24.00
She also decides that lower and upper specification limit for the critical-to-quality variable should be10 and 30 seconds, respectively.
Referring to Scenario 19-4, suppose the supervisor constructs an R chart to see if the variability in
Collection times is in-control.What is the center line of this R chart?
A) 20.00
B) 20.56
C) 20.40
D) 24.00
فتح الحزمة
افتح القفل للوصول البطاقات البالغ عددها 86 في هذه المجموعة.
فتح الحزمة
k this deck
37
SCENARIO 19-4 She also decides that lower and upper specification limit for the critical-to-quality variable should be
10 and 30 seconds, respectively.
Referring to Scenario 19-4, suppose the supervisor constructs an chart to see if the process is
In-control.What are the lower and upper control limits of this chart?
A) 10.00, 30.00
B) 8.49, 32.03
C) 5.39, 35.13
D) 4.96, 35.56
She also decides that lower and upper specification limit for the critical-to-quality variable should be10 and 30 seconds, respectively.
Referring to Scenario 19-4, suppose the supervisor constructs an
chart to see if the process isIn-control.What are the lower and upper control limits of this chart?
A) 10.00, 30.00
B) 8.49, 32.03
C) 5.39, 35.13
D) 4.96, 35.56
فتح الحزمة
افتح القفل للوصول البطاقات البالغ عددها 86 في هذه المجموعة.
فتح الحزمة
k this deck
38
SCENARIO 19-3
Referring to Scenario 19-3, suppose the analyst constructs an R chart to see if the variability in
Production times is in-control.The R chart is characterized by which of the following?
A) Increasing trend
B) Decreasing trend
C) In-control
D) Points outside the control limits
Referring to Scenario 19-3, suppose the analyst constructs an R chart to see if the variability in
Production times is in-control.The R chart is characterized by which of the following?
A) Increasing trend
B) Decreasing trend
C) In-control
D) Points outside the control limits
فتح الحزمة
افتح القفل للوصول البطاقات البالغ عددها 86 في هذه المجموعة.
فتح الحزمة
k this deck
39
SCENARIO 19-4 She also decides that lower and upper specification limit for the critical-to-quality variable should be
10 and 30 seconds, respectively.
Referring to Scenario 19-4, suppose the supervisor constructs an chart to see if the process is
In-control.What is the center line of the chart?
A) 20.00
B) 20.26
C) 21.00
D) 24.26
She also decides that lower and upper specification limit for the critical-to-quality variable should be10 and 30 seconds, respectively.
Referring to Scenario 19-4, suppose the supervisor constructs an
chart to see if the process isIn-control.What is the center line of the chart?
A) 20.00
B) 20.26
C) 21.00
D) 24.26
فتح الحزمة
افتح القفل للوصول البطاقات البالغ عددها 86 في هذه المجموعة.
فتح الحزمة
k this deck
40
SCENARIO 19-3
Referring to Scenario 19-3, suppose the analyst constructs an chart to see if the production
Process is in-control.What is the center line for this chart?
A) 64.3
B) 59.5
C) 58.0
D) 57.1
Referring to Scenario 19-3, suppose the analyst constructs an
chart to see if the productionProcess is in-control.What is the center line for this chart?
A) 64.3
B) 59.5
C) 58.0
D) 57.1
فتح الحزمة
افتح القفل للوصول البطاقات البالغ عددها 86 في هذه المجموعة.
فتح الحزمة
k this deck
41
True or False: The SS method involves methods that enable participants to reduce setup time
for equipment and resources and materials needed for changeover.
for equipment and resources and materials needed for changeover.
فتح الحزمة
افتح القفل للوصول البطاقات البالغ عددها 86 في هذه المجموعة.
فتح الحزمة
k this deck
42
True or False: In the United States, the control limits on a control chart are placed so that they are
3 standard deviations above and below a central line.
3 standard deviations above and below a central line.
فتح الحزمة
افتح القفل للوصول البطاقات البالغ عددها 86 في هذه المجموعة.
فتح الحزمة
k this deck
43
Developing operational definitions for each critical-to-quality characteristic involves which part
Of the DMAIC process?
A) Define
B) Measure
C) Analyze
D) Improve
E) Control
Of the DMAIC process?
A) Define
B) Measure
C) Analyze
D) Improve
E) Control
فتح الحزمة
افتح القفل للوصول البطاقات البالغ عددها 86 في هذه المجموعة.
فتح الحزمة
k this deck
44
True or False: It is not possible for the
chart to be out-of-control when the R chart is in control.
chart to be out-of-control when the R chart is in control.
فتح الحزمة
افتح القفل للوصول البطاقات البالغ عددها 86 في هذه المجموعة.
فتح الحزمة
k this deck
45
True or False: A master black belt is among the tools of Lean Six Sigma.
فتح الحزمة
افتح القفل للوصول البطاقات البالغ عددها 86 في هذه المجموعة.
فتح الحزمة
k this deck
46
True or False: Quick Changeover Techniques is among the tools of Lean Six Sigma.
فتح الحزمة
افتح القفل للوصول البطاقات البالغ عددها 86 في هذه المجموعة.
فتح الحزمة
k this deck
47
Which of the following is a method for breaking process into a series of steps in order to
Eliminate defects and produce near perfect results?
A) Deming's 14 points management.
B) Six Sigma management.
C) Shewhart-Deming cycle.
D) R chart and chart.
Eliminate defects and produce near perfect results?
A) Deming's 14 points management.
B) Six Sigma management.
C) Shewhart-Deming cycle.
D) R chart and
chart. فتح الحزمة
افتح القفل للوصول البطاقات البالغ عددها 86 في هذه المجموعة.
فتح الحزمة
k this deck
48
True or False: Champions is among the tools of Lean Six Sigma.
فتح الحزمة
افتح القفل للوصول البطاقات البالغ عددها 86 في هذه المجموعة.
فتح الحزمة
k this deck
49
True or False: The R chart is a control chart used to monitor a process mean.
فتح الحزمة
افتح القفل للوصول البطاقات البالغ عددها 86 في هذه المجموعة.
فتح الحزمة
k this deck
50
Determining the root causes of why defects can occur along with the variables in the processthat cause these defects to occur involves which part of the DMAIC process?
A)Define
B)Measure
C)Analyze
D)Improve
E)Control
A)Define
B)Measure
C)Analyze
D)Improve
E)Control
فتح الحزمة
افتح القفل للوصول البطاقات البالغ عددها 86 في هذه المجموعة.
فتح الحزمة
k this deck
51
True or False: Poke-Yoke devices is among the tools of Lean Six Sigma.
فتح الحزمة
افتح القفل للوصول البطاقات البالغ عددها 86 في هذه المجموعة.
فتح الحزمة
k this deck
52
The cause of variation that can be reduced only by changing the system is ______ cause
variation.
variation.
فتح الحزمة
افتح القفل للوصول البطاقات البالغ عددها 86 في هذه المجموعة.
فتح الحزمة
k this deck
53
True or False: The focus of Lean Six Sigma is on removing non-value added steps and waste
which can exist in any part of an organization.
which can exist in any part of an organization.
فتح الحزمة
افتح القفل للوصول البطاقات البالغ عددها 86 في هذه المجموعة.
فتح الحزمة
k this deck
54
_______ causes of variation are correctable without modifying the system.
فتح الحزمة
افتح القفل للوصول البطاقات البالغ عددها 86 في هذه المجموعة.
فتح الحزمة
k this deck
55
Maintaining the gains that have been made with a revised process in the long term by avoiding
Potential problems that can occur when a process is changed involves which part of the DMAIC
Process?
A) Define
B) Measure
C) Analyze
D) Improve
E) Control
Potential problems that can occur when a process is changed involves which part of the DMAIC
Process?
A) Define
B) Measure
C) Analyze
D) Improve
E) Control
فتح الحزمة
افتح القفل للوصول البطاقات البالغ عددها 86 في هذه المجموعة.
فتح الحزمة
k this deck
56
Which of the following is not part of the DMAIC process in Six Sigma management?
A) Define
B) Do
C) Analyze
D) Control
A) Define
B) Do
C) Analyze
D) Control
فتح الحزمة
افتح القفل للوصول البطاقات البالغ عددها 86 في هذه المجموعة.
فتح الحزمة
k this deck
57
True or False: SS method is among the tools of Lean Six Sigma.
فتح الحزمة
افتح القفل للوصول البطاقات البالغ عددها 86 في هذه المجموعة.
فتح الحزمة
k this deck
58
True or False: Referring to Scenario 19-8, based on the
chart, it appears that the process is in
control.
chart, it appears that the process is in
control.
فتح الحزمة
افتح القفل للوصول البطاقات البالغ عددها 86 في هذه المجموعة.
فتح الحزمة
k this deck
59
True or False: The p chart is a control chart used for monitoring the proportion of items that meet
given specifications.
given specifications.
فتح الحزمة
افتح القفل للوصول البطاقات البالغ عددها 86 في هذه المجموعة.
فتح الحزمة
k this deck
60
True or False: Total Production Maintenance is among the tools of Lean Six Sigma.
فتح الحزمة
افتح القفل للوصول البطاقات البالغ عددها 86 في هذه المجموعة.
فتح الحزمة
k this deck
61
True or False: TPM establishes ways to eliminate unnecessary housekeeping aspects of a work
environment.
environment.
فتح الحزمة
افتح القفل للوصول البطاقات البالغ عددها 86 في هذه المجموعة.
فتح الحزمة
k this deck
62
True or False: Quick Changeover Techniques establish ways to eliminate unnecessary
housekeeping aspects of a work environment.
housekeeping aspects of a work environment.
فتح الحزمة
افتح القفل للوصول البطاقات البالغ عددها 86 في هذه المجموعة.
فتح الحزمة
k this deck
63
Which of the following best measures the ability of a process to consistently meet specified
Customer-driven requirement?
A) Process capability.
B) Specification limits
C) Upper control limit
D) Lower control limit
Customer-driven requirement?
A) Process capability.
B) Specification limits
C) Upper control limit
D) Lower control limit
فتح الحزمة
افتح القفل للوصول البطاقات البالغ عددها 86 في هذه المجموعة.
فتح الحزمة
k this deck
64
True or False: The SS method establishes ways to eliminate unnecessary housekeeping aspects
of a work environment.
of a work environment.
فتح الحزمة
افتح القفل للوصول البطاقات البالغ عددها 86 في هذه المجموعة.
فتح الحزمة
k this deck
65
True or False: Quick Changeover Techniques involve methods that enable participants to
reduce setup time for equipment and resources and materials needed for changeover.
reduce setup time for equipment and resources and materials needed for changeover.
فتح الحزمة
افتح القفل للوصول البطاقات البالغ عددها 86 في هذه المجموعة.
فتح الحزمة
k this deck
66
True or False: The SS method establishes ways to organize necessary housekeeping aspects of a
work environment.
work environment.
فتح الحزمة
افتح القفل للوصول البطاقات البالغ عددها 86 في هذه المجموعة.
فتح الحزمة
k this deck
67
True or False: An in-control process must be achieved before being able to estimate process
capability.
capability.
فتح الحزمة
افتح القفل للوصول البطاقات البالغ عددها 86 في هذه المجموعة.
فتح الحزمة
k this deck
68
True or False: Quick Changeover Techniques establish ways to clean and maintain the
necessary housekeeping aspects of a work environment.
necessary housekeeping aspects of a work environment.
فتح الحزمة
افتح القفل للوصول البطاقات البالغ عددها 86 في هذه المجموعة.
فتح الحزمة
k this deck
69
True or False: Total Productive Maintenance focuses on preventing the causes of defects.
فتح الحزمة
افتح القفل للوصول البطاقات البالغ عددها 86 في هذه المجموعة.
فتح الحزمة
k this deck
70
True or False: Mistake Proofing devices focus on methods that enable participants to reduce
setup time for equipment and resources and materials needed for changeover.
setup time for equipment and resources and materials needed for changeover.
فتح الحزمة
افتح القفل للوصول البطاقات البالغ عددها 86 في هذه المجموعة.
فتح الحزمة
k this deck
71
True or False: Poke-Yoke devices establish ways to eliminate unnecessary housekeeping
aspects of a work environment.
aspects of a work environment.
فتح الحزمة
افتح القفل للوصول البطاقات البالغ عددها 86 في هذه المجموعة.
فتح الحزمة
k this deck
72
True or False: SMED focuses on preventing the causes of defects.
فتح الحزمة
افتح القفل للوصول البطاقات البالغ عددها 86 في هذه المجموعة.
فتح الحزمة
k this deck
73
True or False: The SS method establishes ways to clean and maintain the necessary
housekeeping aspects of a work environment.
housekeeping aspects of a work environment.
فتح الحزمة
افتح القفل للوصول البطاقات البالغ عددها 86 في هذه المجموعة.
فتح الحزمة
k this deck
74
True or False: Poke-Yoke devices establish ways to clean and maintain the necessary
housekeeping aspects of a work environment.
housekeeping aspects of a work environment.
فتح الحزمة
افتح القفل للوصول البطاقات البالغ عددها 86 في هذه المجموعة.
فتح الحزمة
k this deck
75
True or False: TPM establishes ways to clean and maintain the necessary housekeeping aspects
of a work environment.
of a work environment.
فتح الحزمة
افتح القفل للوصول البطاقات البالغ عددها 86 في هذه المجموعة.
فتح الحزمة
k this deck
76
True or False: SS method focuses on preventing the causes of defects.
فتح الحزمة
افتح القفل للوصول البطاقات البالغ عددها 86 في هذه المجموعة.
فتح الحزمة
k this deck
77
True or False: SMED establishes ways to eliminate unnecessary housekeeping aspects of a
work environment.
work environment.
فتح الحزمة
افتح القفل للوصول البطاقات البالغ عددها 86 في هذه المجموعة.
فتح الحزمة
k this deck
78
True or False: Total Productive Maintenance focuses on methods that enable participants to
reduce setup time for equipment and resources and materials needed for changeover.
reduce setup time for equipment and resources and materials needed for changeover.
فتح الحزمة
افتح القفل للوصول البطاقات البالغ عددها 86 في هذه المجموعة.
فتح الحزمة
k this deck
79
True or False: Mistake Proofing (Poke-Yoke)devices focus on preventing the causes of defects.
فتح الحزمة
افتح القفل للوصول البطاقات البالغ عددها 86 في هذه المجموعة.
فتح الحزمة
k this deck
80
True or False: SMED establishes ways to clean and maintain the necessary housekeeping
aspects of a work environment.
aspects of a work environment.
فتح الحزمة
افتح القفل للوصول البطاقات البالغ عددها 86 في هذه المجموعة.
فتح الحزمة
k this deck
فتح الحزمة
افتح القفل للوصول البطاقات البالغ عددها 86 في هذه المجموعة.


