Deck 6: Sampling Distributions
ملء الشاشة (f)
سؤال

سؤال
سؤال
سؤال
The probability distribution shown below describes a population of measurements that
can assume values of 5, 10, 15, and 20, each of which occurs with the same frequency: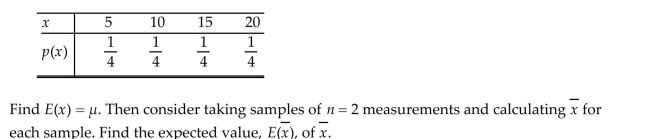
can assume values of 5, 10, 15, and 20, each of which occurs with the same frequency:
سؤال
سؤال
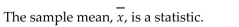
Consider the probability distribution shown here. 
سؤال
سؤال

سؤال
سؤال
The probability distribution shown below describes a population of measurements.  Suppose that we took repeated random samples of n = 2 observations from the population described above. Find the expected value of the sampling distribution of the sample mean.
A)3
B)1
C)4
D)2
E)0
Suppose that we took repeated random samples of n = 2 observations from the population described above. Find the expected value of the sampling distribution of the sample mean.A)3
B)1
C)4
D)2
E)0
سؤال
سؤال
سؤال
Consider the population described by the probability distribution below. 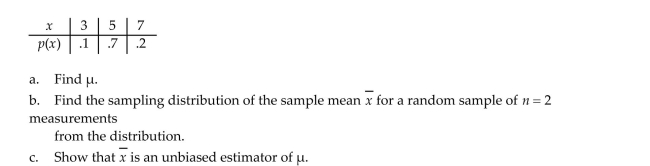
سؤال
سؤال
The probability distribution shown below describes a population of measurements that
can assume values of 1, 5, 9, and 13, each of which occurs with the same frequency: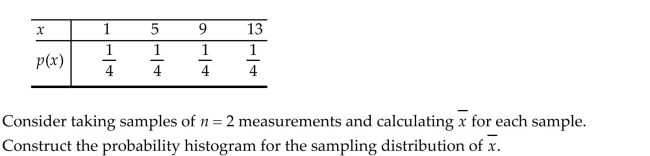
can assume values of 1, 5, 9, and 13, each of which occurs with the same frequency:
سؤال
The probability distribution shown below describes a population of measurements. 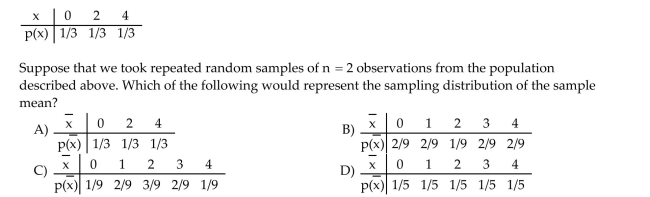
سؤال
سؤال
Consider the population described by the probability distribution below. 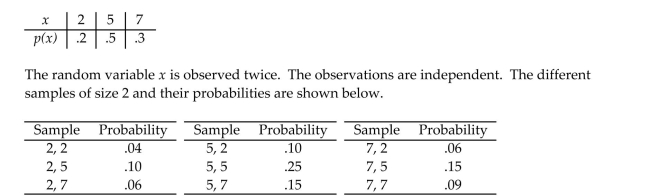 Find the sampling distribution of the sample mean
Find the sampling distribution of the sample mean سؤال
The sampling distribution of the sample mean is shown below. 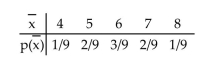 Find the expected value of the sampling distribution of the sample mean.
A)5
B)4
C)6
D)7
Find the expected value of the sampling distribution of the sample mean.A)5
B)4
C)6
D)7
سؤال
سؤال
سؤال
سؤال
سؤال
سؤال
Consider the population described by the probability distribution below. 
سؤال
سؤال
سؤال
سؤال
سؤال
Consider the population described by the probability distribution below. 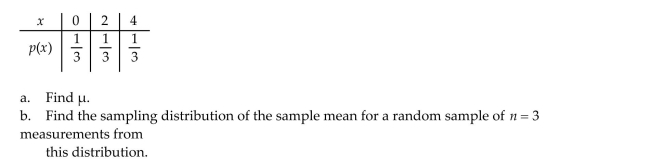
سؤال
سؤال
سؤال
سؤال

سؤال
سؤال
سؤال
سؤال
سؤال
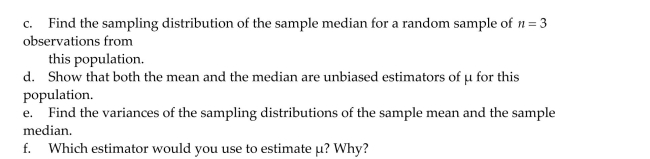
Which of the following statements about the sampling distribution of the sample mean is incorrect? 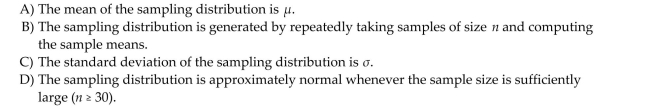
سؤال
Consider the population described by the probability distribution below. 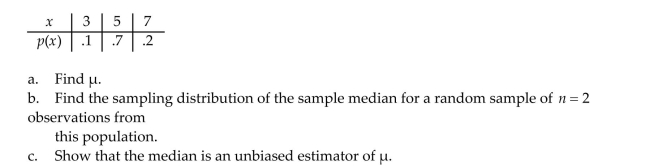
سؤال
سؤال
سؤال

سؤال
سؤال
سؤال
سؤال
سؤال
سؤال
سؤال
سؤال
سؤال

فتح الحزمة
قم بالتسجيل لفتح البطاقات في هذه المجموعة!
Unlock Deck
Unlock Deck
1/52
العب
ملء الشاشة (f)
Deck 6: Sampling Distributions
1
False
2
A point estimator of a population parameter is a rule or formula which tells us how to use sample
data to calculate a single number that can be used as an estimate of the population parameter.
data to calculate a single number that can be used as an estimate of the population parameter.
True
3
Sample statistics are random variables, because different samples can lead to different values of
the sample statistics.
the sample statistics.
True
4
The probability distribution shown below describes a population of measurements that
can assume values of 5, 10, 15, and 20, each of which occurs with the same frequency:
can assume values of 5, 10, 15, and 20, each of which occurs with the same frequency:
فتح الحزمة
افتح القفل للوصول البطاقات البالغ عددها 52 في هذه المجموعة.
فتح الحزمة
k this deck
5
فتح الحزمة
افتح القفل للوصول البطاقات البالغ عددها 52 في هذه المجموعة.
فتح الحزمة
k this deck
6
Consider the probability distribution shown here.
فتح الحزمة
افتح القفل للوصول البطاقات البالغ عددها 52 في هذه المجموعة.
فتح الحزمة
k this deck
7
When estimating the population mean, the sample mean is always a better estimate than the
sample median.
sample median.
فتح الحزمة
افتح القفل للوصول البطاقات البالغ عددها 52 في هذه المجموعة.
فتح الحزمة
k this deck
8
فتح الحزمة
افتح القفل للوصول البطاقات البالغ عددها 52 في هذه المجموعة.
فتح الحزمة
k this deck
9
A statistic is biased if the mean of the sampling distribution is equal to the parameter it is intended
to estimate.
to estimate.
فتح الحزمة
افتح القفل للوصول البطاقات البالغ عددها 52 في هذه المجموعة.
فتح الحزمة
k this deck
10
The probability distribution shown below describes a population of measurements. Suppose that we took repeated random samples of n = 2 observations from the population described above. Find the expected value of the sampling distribution of the sample mean.
A)3
B)1
C)4
D)2
E)0
Suppose that we took repeated random samples of n = 2 observations from the population described above. Find the expected value of the sampling distribution of the sample mean.A)3
B)1
C)4
D)2
E)0
فتح الحزمة
افتح القفل للوصول البطاقات البالغ عددها 52 في هذه المجموعة.
فتح الحزمة
k this deck
11
The length of time a traffic signal stays green (nicknamed the ʺgreen timeʺ)at a particular intersection follows a normal probability distribution with a mean of 200 seconds and the standard
Deviation of 10 seconds. Use this information to answer the following questions. Which of the
Following describes the derivation of the sampling distribution of the sample mean?
A)The standard deviations of a large number of samples of size n randomly selected from the population of ʺgreen timesʺ are calculated and their probabilities are plotted.
B)The mean and median of a large randomly selected sample of ʺgreen timesʺ are calculated. Depending on whether or not the population of ʺgreen timesʺ is normally distributed, either
The mean or the median is chosen as the best measurement of center.
C)The means of a large number of samples of size n randomly selected from the population of ʺgreen timesʺ are calculated and their probabilities are plotted.
D)A single sample of sufficiently large size is randomly selected from the population of ʺgreen timesʺ and its probability is determined.
فتح الحزمة
افتح القفل للوصول البطاقات البالغ عددها 52 في هذه المجموعة.
فتح الحزمة
k this deck
12
The sampling distribution of a sample statistic calculated from a sample of n measurements is the
probability distribution of the statistic.
probability distribution of the statistic.
فتح الحزمة
افتح القفل للوصول البطاقات البالغ عددها 52 في هذه المجموعة.
فتح الحزمة
k this deck
13
Consider the population described by the probability distribution below.
فتح الحزمة
افتح القفل للوصول البطاقات البالغ عددها 52 في هذه المجموعة.
فتح الحزمة
k this deck
14
Which of the following describes what the property of unbiasedness means?
A)The sampling distribution in question has the smallest variation of all possible sampling distributions.
B)The center of the sampling distribution is found at the population parameter that is being estimated.
C)The shape of the sampling distribution is approximately normally distributed.
D)The center of the sampling distribution is found at the population standard deviation.
فتح الحزمة
افتح القفل للوصول البطاقات البالغ عددها 52 في هذه المجموعة.
فتح الحزمة
k this deck
15
The probability distribution shown below describes a population of measurements that
can assume values of 1, 5, 9, and 13, each of which occurs with the same frequency:
can assume values of 1, 5, 9, and 13, each of which occurs with the same frequency:
فتح الحزمة
افتح القفل للوصول البطاقات البالغ عددها 52 في هذه المجموعة.
فتح الحزمة
k this deck
16
The probability distribution shown below describes a population of measurements.
فتح الحزمة
افتح القفل للوصول البطاقات البالغ عددها 52 في هذه المجموعة.
فتح الحزمة
k this deck
17
In most situations, the true mean and standard deviation are unknown quantities that have to be
estimated.
estimated.
فتح الحزمة
افتح القفل للوصول البطاقات البالغ عددها 52 في هذه المجموعة.
فتح الحزمة
k this deck
18
Consider the population described by the probability distribution below. Find the sampling distribution of the sample mean
Find the sampling distribution of the sample mean فتح الحزمة
افتح القفل للوصول البطاقات البالغ عددها 52 في هذه المجموعة.
فتح الحزمة
k this deck
19
The sampling distribution of the sample mean is shown below. Find the expected value of the sampling distribution of the sample mean.
A)5
B)4
C)6
D)7
Find the expected value of the sampling distribution of the sample mean.A)5
B)4
C)6
D)7
فتح الحزمة
افتح القفل للوصول البطاقات البالغ عددها 52 في هذه المجموعة.
فتح الحزمة
k this deck
20
The term statistic refers to a population quantity, and the term parameter refers to a sample
quantity.
quantity.
فتح الحزمة
افتح القفل للوصول البطاقات البالغ عددها 52 في هذه المجموعة.
فتح الحزمة
k this deck
21
The standard error of the sampling distribution of the sample mean is equal to σ, the standard
deviation of the population.
deviation of the population.
فتح الحزمة
افتح القفل للوصول البطاقات البالغ عددها 52 في هذه المجموعة.
فتح الحزمة
k this deck
22
فتح الحزمة
افتح القفل للوصول البطاقات البالغ عددها 52 في هذه المجموعة.
فتح الحزمة
k this deck
23
The Central Limit Theorem is important in statistics because _____.
A)for a large n, it says the sampling distribution of the sample mean is approximately normal, regardless of the population
B)for any population, it says the sampling distribution of the sample mean is approximately normal, regardless of the sample size
C)for any size sample, it says the sampling distribution of the sample mean is approximately normal
D)for a large n, it says the population is approximately normal
فتح الحزمة
افتح القفل للوصول البطاقات البالغ عددها 52 في هذه المجموعة.
فتح الحزمة
k this deck
24
فتح الحزمة
افتح القفل للوصول البطاقات البالغ عددها 52 في هذه المجموعة.
فتح الحزمة
k this deck
25
Consider the population described by the probability distribution below.
فتح الحزمة
افتح القفل للوصول البطاقات البالغ عددها 52 في هذه المجموعة.
فتح الحزمة
k this deck
26
The daily revenue at a university snack bar has been recorded for the past five years. Records indicate that the mean daily revenue is $3450 and the standard deviation is $300. The distribution
Is skewed to the right due to several high volume days (football game days). Suppose that 100
Days are randomly selected and the average daily revenue computed. Which of the following
Describes the sampling distribution of the sample mean?
A)normally distributed with a mean of $345 and a standard deviation of $30
B)normally distributed with a mean of $3450 and a standard deviation of $30
C)skewed to the right with a mean of $3450 and a standard deviation of $300
D)normally distributed with a mean of $3450 and a standard deviation of $300
فتح الحزمة
افتح القفل للوصول البطاقات البالغ عددها 52 في هذه المجموعة.
فتح الحزمة
k this deck
27
The ideal estimator has the greatest variance among all unbiased estimators.
فتح الحزمة
افتح القفل للوصول البطاقات البالغ عددها 52 في هذه المجموعة.
فتح الحزمة
k this deck
28
The Central Limit Theorem guarantees that the population is normal whenever n is sufficiently
large.
large.
فتح الحزمة
افتح القفل للوصول البطاقات البالغ عددها 52 في هذه المجموعة.
فتح الحزمة
k this deck
29
As the sample size gets larger, the standard error of the sampling distribution of the sample mean
gets larger as well.
gets larger as well.
فتح الحزمة
افتح القفل للوصول البطاقات البالغ عددها 52 في هذه المجموعة.
فتح الحزمة
k this deck
30
Consider the population described by the probability distribution below.
فتح الحزمة
افتح القفل للوصول البطاقات البالغ عددها 52 في هذه المجموعة.
فتح الحزمة
k this deck
31
Which of the following does the Central Limit Theorem allow us to disregard when working with the sampling distribution of the sample mean?
A)The mean of the population distribution.
B)The standard deviation of the population distribution.
C)The shape of the population distribution.
D)All of the above can be disregarded when the Central Limit Theorem is used.
A)The mean of the population distribution.
B)The standard deviation of the population distribution.
C)The shape of the population distribution.
D)All of the above can be disregarded when the Central Limit Theorem is used.
فتح الحزمة
افتح القفل للوصول البطاقات البالغ عددها 52 في هذه المجموعة.
فتح الحزمة
k this deck
32
Suppose studentsʹ ages follow a skewed right distribution with a mean of 24 years old and a standard deviation of 3 years. If we randomly sample 350 students, which of the following
Statements about the sampling distribution of the sample mean age is incorrect?
A)The mean of the sampling distribution is approximately 24 years old.
B)The shape of the sampling distribution is approximately normal.
C)The standard deviation of the sampling distribution is equal to 3 years.
D)All of the above statements are correct.
فتح الحزمة
افتح القفل للوصول البطاقات البالغ عددها 52 في هذه المجموعة.
فتح الحزمة
k this deck
33
The number of cars running a red light in a day, at a given intersection, possesses a distribution with a mean of 2.4 cars and a standard deviation of 4. The number of cars running the red light
Was observed on 100 randomly chosen days and the mean number of cars calculated. Describe the
Sampling distribution of the sample mean.
A)approximately normal with mean = 2.4 and standard deviation = 4
B)shape unknown with mean = 2.4 and standard deviation = 0.4
C)approximately normal with mean = 2.4 and standard deviation = 0.4
D)shape unknown with mean = 2.4 and standard deviation = 4
فتح الحزمة
افتح القفل للوصول البطاقات البالغ عددها 52 في هذه المجموعة.
فتح الحزمة
k this deck
34
فتح الحزمة
افتح القفل للوصول البطاقات البالغ عددها 52 في هذه المجموعة.
فتح الحزمة
k this deck
35
The minimum-variance unbiased estimator (MVUE)has the least variance among all unbiased
estimators.
estimators.
فتح الحزمة
افتح القفل للوصول البطاقات البالغ عددها 52 في هذه المجموعة.
فتح الحزمة
k this deck
36
The Central Limit Theorem is considered powerful in statistics because __________.
A)it works for any sample size provided the population is normal
B)it works for any sample provided the population distribution is known
C)it works for any population distribution provided the population mean is known
D)it works for any population distribution provided the sample size is sufficiently large
فتح الحزمة
افتح القفل للوصول البطاقات البالغ عددها 52 في هذه المجموعة.
فتح الحزمة
k this deck
37
The Central Limit Theorem states that the sampling distribution of the sample mean is approximately normal under certain conditions. Which of the following is a necessary condition
For the Central Limit Theorem to be used?
A)The population from which we are sampling must be normally distributed.
B)The population size must be large .
C)The sample size must be large .
D)The population from which we are sampling must not be normally distributed.
For the Central Limit Theorem to be used?
A)The population from which we are sampling must be normally distributed.
B)The population size must be large .
C)The sample size must be large .
D)The population from which we are sampling must not be normally distributed.
فتح الحزمة
افتح القفل للوصول البطاقات البالغ عددها 52 في هذه المجموعة.
فتح الحزمة
k this deck
38
Which of the following describes what the property of minimum variance means?
A)The center of the sampling distribution is found at the population standard deviation.
B)The shape of the sampling distribution is approximately normally distributed.
C)The center of the sampling distribution is found at the population parameter that is being estimated.
D)The sampling distribution in question has the smallest variation of all possible unbiased sampling distributions.
فتح الحزمة
افتح القفل للوصول البطاقات البالغ عددها 52 في هذه المجموعة.
فتح الحزمة
k this deck
39
Which of the following statements about the sampling distribution of the sample mean is incorrect?
فتح الحزمة
افتح القفل للوصول البطاقات البالغ عددها 52 في هذه المجموعة.
فتح الحزمة
k this deck
40
Consider the population described by the probability distribution below.
فتح الحزمة
افتح القفل للوصول البطاقات البالغ عددها 52 في هذه المجموعة.
فتح الحزمة
k this deck
41
فتح الحزمة
افتح القفل للوصول البطاقات البالغ عددها 52 في هذه المجموعة.
فتح الحزمة
k this deck
42
The weight of corn chips dispensed into a 10-ounce bag by the dispensing machine has
been identified as possessing a normal distribution with a mean of 10.5 ounces and a
standard deviation of .2 ounce. Suppose 100 bags of chips are randomly selected. Find the
probability that the mean weight of these 100 bags exceeds 10.45 ounces.
been identified as possessing a normal distribution with a mean of 10.5 ounces and a
standard deviation of .2 ounce. Suppose 100 bags of chips are randomly selected. Find the
probability that the mean weight of these 100 bags exceeds 10.45 ounces.
فتح الحزمة
افتح القفل للوصول البطاقات البالغ عددها 52 في هذه المجموعة.
فتح الحزمة
k this deck
43
فتح الحزمة
افتح القفل للوصول البطاقات البالغ عددها 52 في هذه المجموعة.
فتح الحزمة
k this deck
44
One year, the distribution of salaries for professional sports players had mean $1.6 million and standard deviation $0.8 million. Suppose a sample of 400 major league players was taken. Find the
Approximate probability that the average salary of the 400 players that year exceeded $1.1 million.
A)approximately 0
B)approximately 1
C).2357
D).7357
Approximate probability that the average salary of the 400 players that year exceeded $1.1 million.
A)approximately 0
B)approximately 1
C).2357
D).7357
فتح الحزمة
افتح القفل للوصول البطاقات البالغ عددها 52 في هذه المجموعة.
فتح الحزمة
k this deck
45
The weight of corn chips dispensed into a 16-ounce bag by the dispensing machine has been identified as possessing a normal distribution with a mean of 16.5 ounces and a standard deviation
Of 0.2 ounce. Suppose 100 bags of chips are randomly selected. Find the probability that the mean
Weight of these 100 bags exceeds 16.6 ounces.
A).1915
B).3085
C).6915
D)approximately 0
Of 0.2 ounce. Suppose 100 bags of chips are randomly selected. Find the probability that the mean
Weight of these 100 bags exceeds 16.6 ounces.
A).1915
B).3085
C).6915
D)approximately 0
فتح الحزمة
افتح القفل للوصول البطاقات البالغ عددها 52 في هذه المجموعة.
فتح الحزمة
k this deck
46
فتح الحزمة
افتح القفل للوصول البطاقات البالغ عددها 52 في هذه المجموعة.
فتح الحزمة
k this deck
47
فتح الحزمة
افتح القفل للوصول البطاقات البالغ عددها 52 في هذه المجموعة.
فتح الحزمة
k this deck
48
The average score of all golfers for a particular course has a mean of 61 and a standard deviation of 3.5. Suppose 49 golfers played the course today. Find the probability that the average score of the
49 golfers exceeded 62.
A).4772
B).0228
C).1293
D).3707
49 golfers exceeded 62.
A).4772
B).0228
C).1293
D).3707
فتح الحزمة
افتح القفل للوصول البطاقات البالغ عددها 52 في هذه المجموعة.
فتح الحزمة
k this deck
49
فتح الحزمة
افتح القفل للوصول البطاقات البالغ عددها 52 في هذه المجموعة.
فتح الحزمة
k this deck
50
فتح الحزمة
افتح القفل للوصول البطاقات البالغ عددها 52 في هذه المجموعة.
فتح الحزمة
k this deck
51
فتح الحزمة
افتح القفل للوصول البطاقات البالغ عددها 52 في هذه المجموعة.
فتح الحزمة
k this deck
52
فتح الحزمة
افتح القفل للوصول البطاقات البالغ عددها 52 في هذه المجموعة.
فتح الحزمة
k this deck
فتح الحزمة
افتح القفل للوصول البطاقات البالغ عددها 52 في هذه المجموعة.


