Deck 9: Testing the Difference Between Two Means, Two Variances, and Two Proportions
ملء الشاشة (f)
سؤال
 ol. As
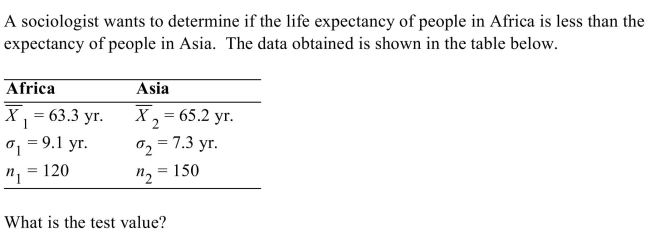
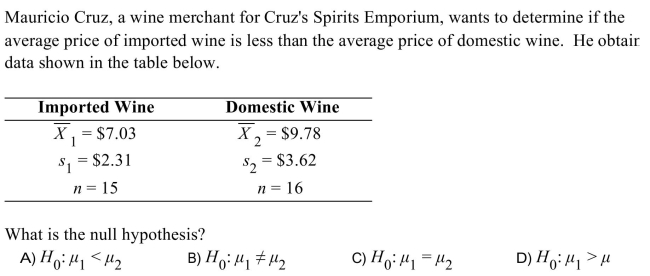
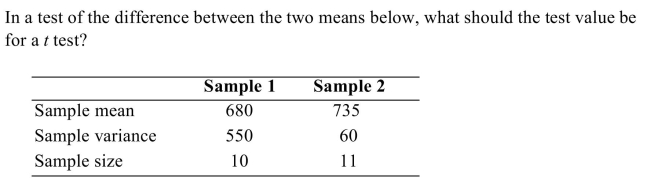
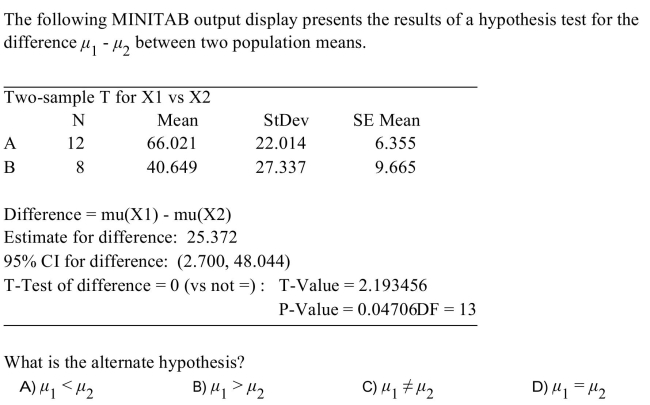
A) -0.66
B) -3.90
C) 0.39
D) -0.26
سؤال
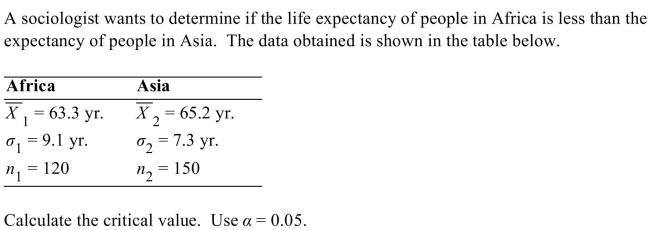
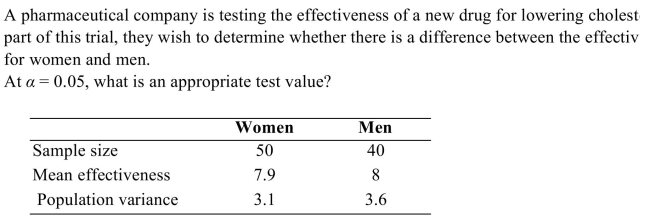
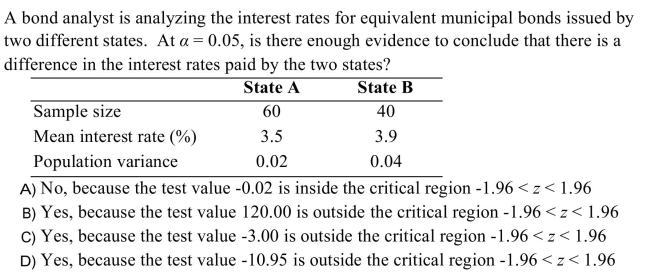
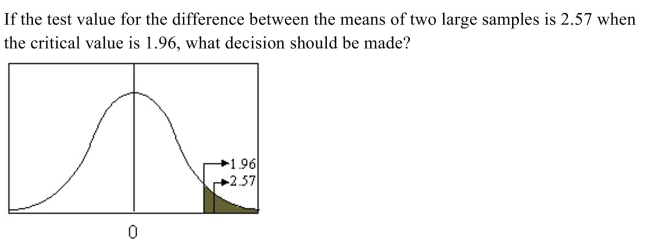
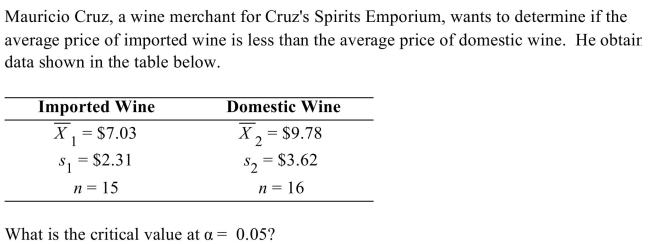
A) -2.58
B) -2.33
C) -1.65
D) -1.96
سؤال
سؤال
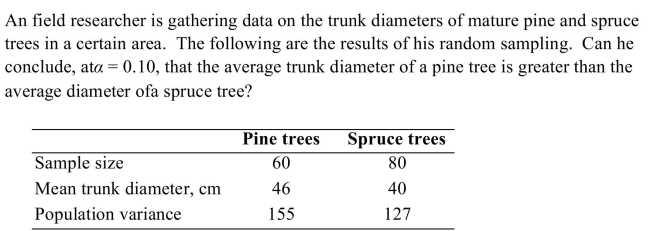
A) The data does not support the conclusion that the average pine tree trunks are larger because the test value 24.54 is greater than than the critical value 1.65.
B) The data supports the conclusion that the average pine tree trunks are larger because the test value 2.94 is greater than than the critical value 1.28.
C) The data does not support the conclusion that the average pine tree trunks are larger because the test value 1.44 is greater than than the critical value 1.28.
D) The data supports the conclusion that the average pine tree trunks are larger because the test value 2.94 is greater than than the critical value 1.65.
سؤال
سؤال
A) -5.38
B) -1.86
C) -3.70
D) -0.47
سؤال
سؤال
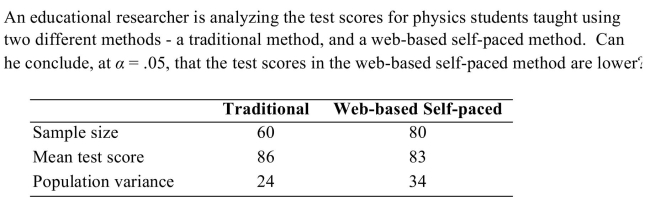
A) The data supports the claim because the test value 3.30 is greater than the critical value 1.65.
B) The data supports the claim because the test value 3.30 is greater than the critical value 1.96.
C) The data supports the claim because the test value 1.82 is less than the critical value 1.96.
D) The data supports the claim because the test value 1.82 is greater than the critical value 1.65.
سؤال
سؤال

سؤال
سؤال
A) 9.51
B) 1.21
C) 0.22
D) 2.10
سؤال
سؤال
سؤال
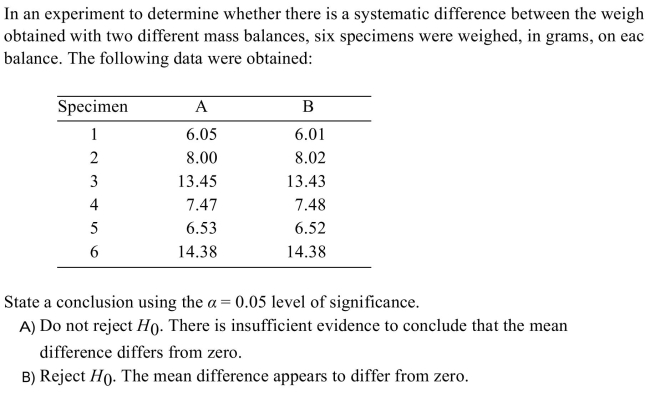
A) Accept the null hypothesis.
B) Reject the alternative hypothesis.
C) Reject the null hypothesis.
D) Accept the equality hypothesis.
سؤال

سؤال
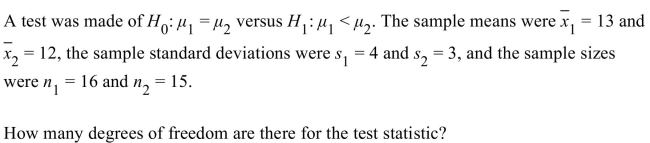
A) 15
B) 16
C) 11
D) 14
سؤال
سؤال
سؤال

سؤال
سؤال
سؤال
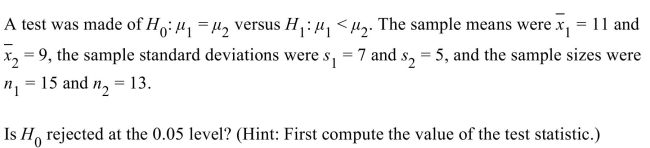
A) Yes
B) No
سؤال
سؤال
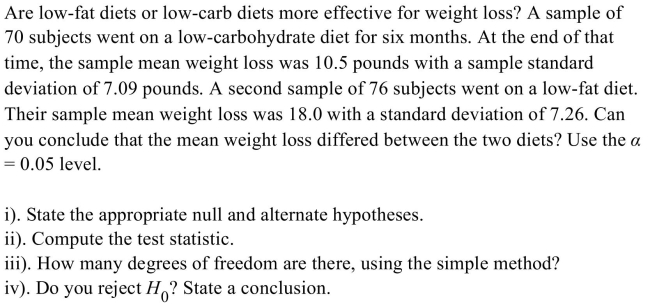
Twelve dieters lost an average of 5.2 pounds in 6 weeks when given a special diet plus a "fat-blocking" herbal formula. A control group of twelve other dieters were given the
Same diet, but without the herbal formula, and lost an average of 4.5 pounds during the
Same time. The standard deviation of the "fat-blocker" sample was 2.8 and the standard
Deviation of the control group was 2.5. Find the 95% confidence interval for the
Differences of the means.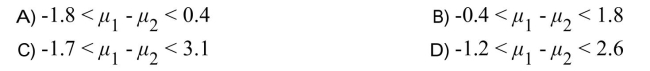
Same diet, but without the herbal formula, and lost an average of 4.5 pounds during the
Same time. The standard deviation of the "fat-blocker" sample was 2.8 and the standard
Deviation of the control group was 2.5. Find the 95% confidence interval for the
Differences of the means.
سؤال
سؤال
سؤال
سؤال
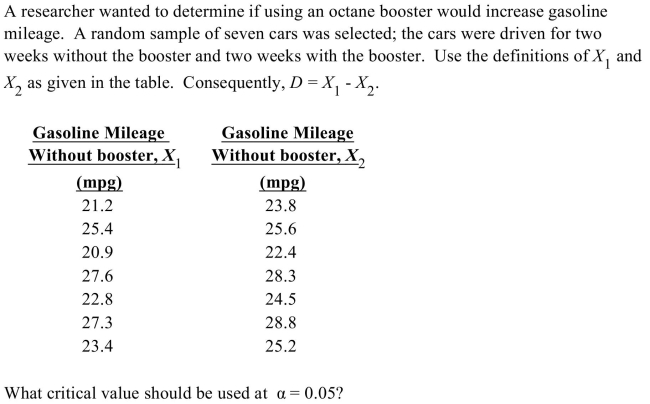
A) -1.753
B) -2.131
C) -1.761
D) -2.145
سؤال
A) -0.31
B) -0.91
C) -7.07
D) -0.11
سؤال
A) No
B) Yes
سؤال
A) -4.46
B) -6.49
C) -2.54
D) -0.92
سؤال
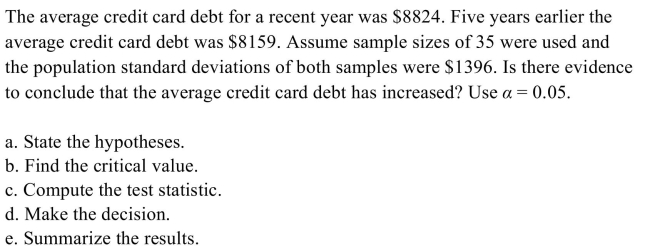
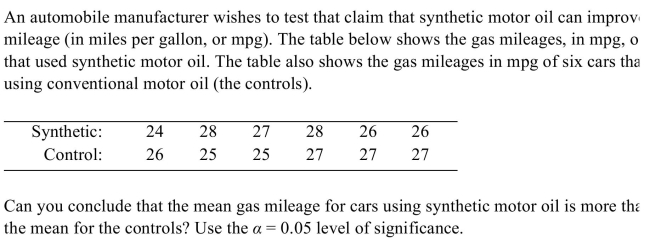
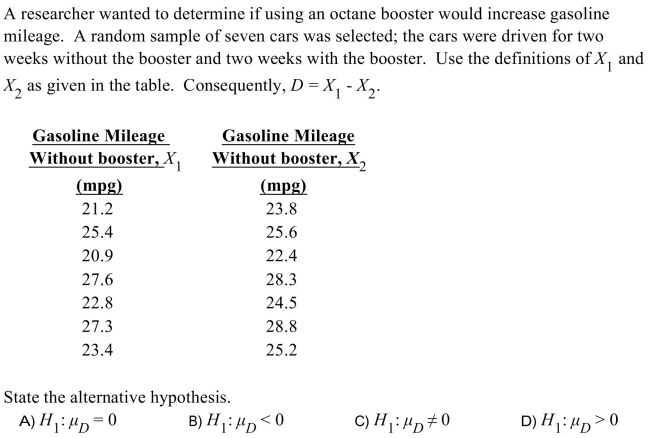
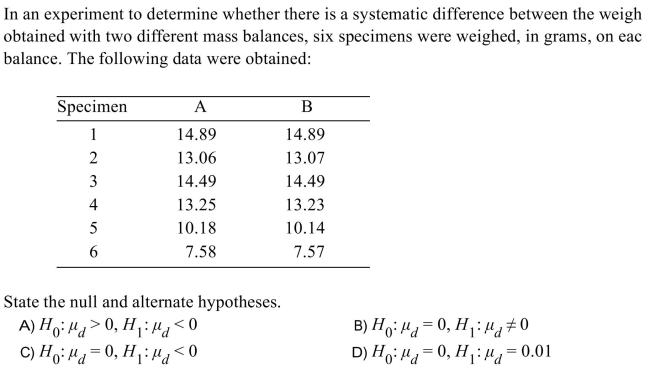
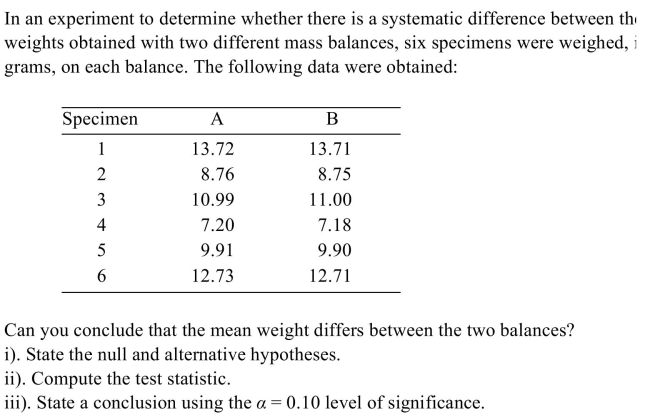
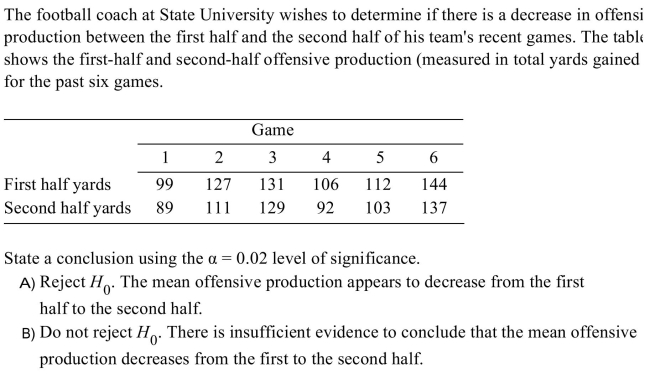
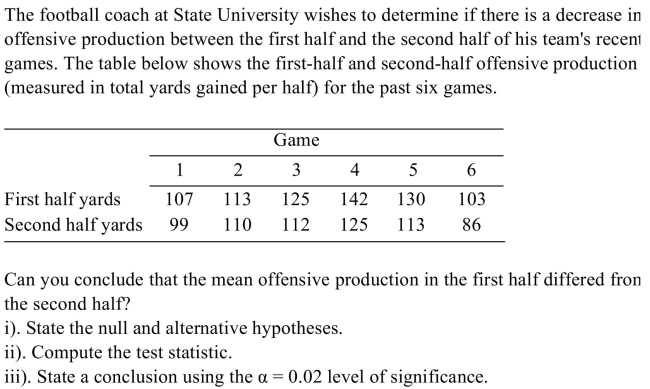
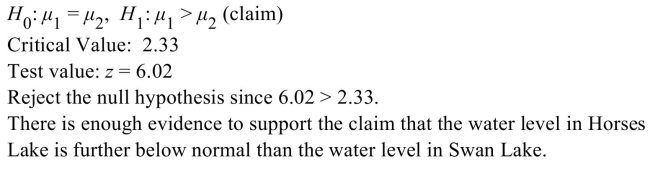
 a.State the hypotheses.
b. Find the critical value(s).
c. Compute the test value.
d. Make the decision.
e. Summarize the results.
سؤال
A) Yes
B) No
سؤال
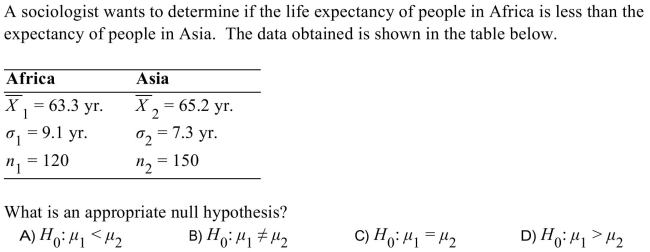
A group of college students believes the average grades in psychology courses are different than the average grades in biology courses. The group found the average
Psychology grades of a sample of 11 students was 82.4 and the average biology grades of
A sample of 11 students was 81.2. What is the null hypothesis for this study?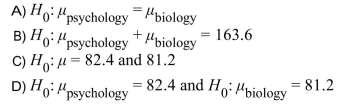
Psychology grades of a sample of 11 students was 82.4 and the average biology grades of
A sample of 11 students was 81.2. What is the null hypothesis for this study?
سؤال
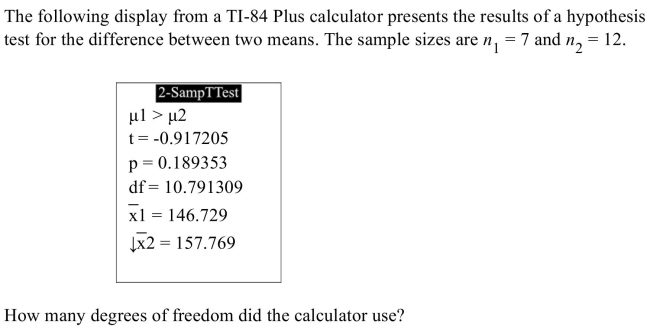
A) 10.791309
B) 11.791309
C) 0.189353
D) -0.917205
سؤال
A) No
B) Yes
سؤال
A) Yes
B) No
سؤال
A) -1.888
B) -4.411
C) -0.555
D) -2.935
سؤال
 as
asA) Yes
B) No
سؤال
سؤال
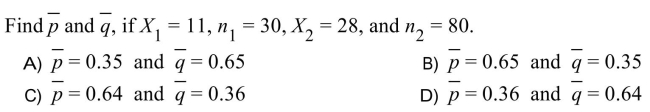
A) 0.84
B) 0.13
C) 0.11
D) 0.78
سؤال
A) -1.67
B) -1.43
C) 1.67
D) 6.3
سؤال
سؤال
A) No
B) Yes
سؤال
A) 4.651
B) 1.405
C) 8.547
D) 3.141
سؤال
A) No
B) Yes
سؤال
سؤال
A) No
B) Yes
سؤال
A) -1.943
B) -2.447
C) -2.365
D) -1.895
سؤال
A) 2.666
B) 1.083
C) 2.433
D) 0.313
سؤال
سؤال
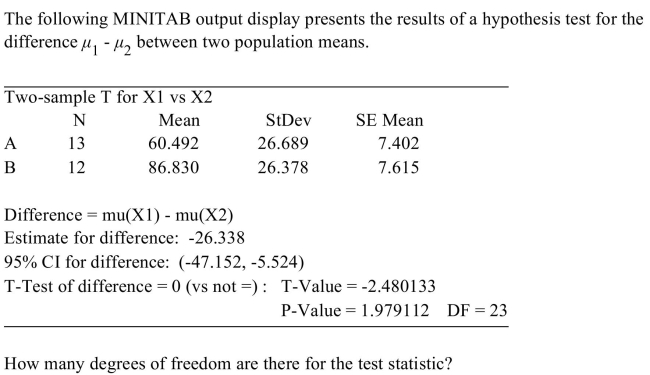
A) 22
B) 26.338
C) 23
D) 1.979112
سؤال
A) 1.164
B) 1.063
C) 0.475
D) 3.960
سؤال
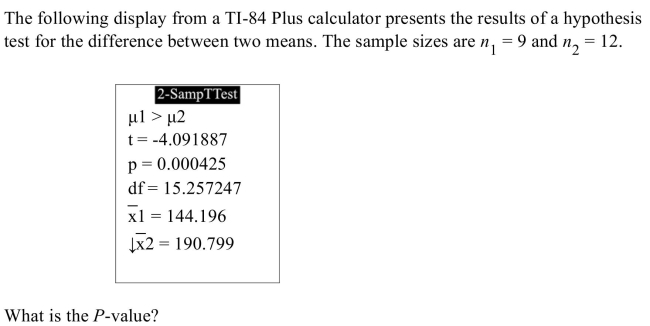
A) 0.999575
B) 15.257247
C) 0.000425
D) -4.091887
سؤال
سؤال
سؤال
سؤال
A) 1.31
B) 0.53
C) 1.03
D) 2.53
سؤال
سؤال
A poll found that 39% of male voters and 42% of female voters support a particular candidate. To test whether this candidate has equal levels of support between male and
Female voters, the alternative hypothesis should be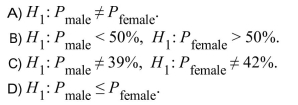
Female voters, the alternative hypothesis should be
سؤال
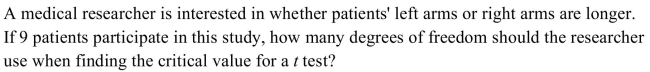
A) 17
B) 9
C) 16
D) 8
سؤال
سؤال
سؤال
سؤال
64% of students at a university live on campus. A random sample found that 28 of 45 male students and 39 of 50 of female students live on campus. At the 0.05 level of
Significance, is there sufficient evidence to support the claim that a difference exists
Between the proportions of male and female students who live on campus?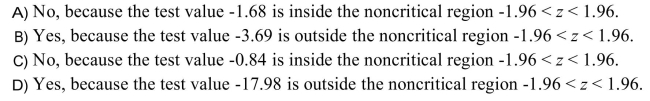
Significance, is there sufficient evidence to support the claim that a difference exists
Between the proportions of male and female students who live on campus?
سؤال
A) There is not enough information to draw a conclusion.
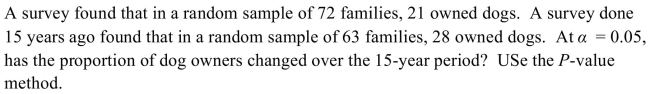
B) No. There is not sufficient evidence to conclude that the proportion of dog owners has changed.
C) Yes. There is sufficient evidence to conclude that the proportion of dog owners has changed.
سؤال
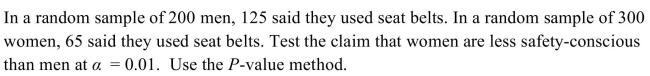
A) There is not enough information to draw a conclusion.
B) Yes. There is enough evidence to support the claim that women are less safety-conscious than men.
C) No. There is not enough evidence to support the claim that women are less safety-conscious than men.
سؤال
سؤال
سؤال
Many elementary school students in a school district currently have ear infections. A random sample of children in two different schools found that 16 of 42 at one school and
17 of 30 at the other have ear infections. At the 0.05 level of significance, is there
Sufficient evidence to support the claim that a difference exists between the proportions
Of students who have ear infections at the two schools?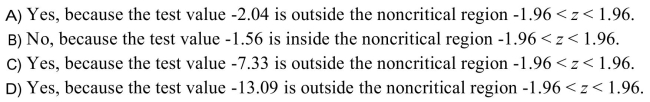
17 of 30 at the other have ear infections. At the 0.05 level of significance, is there
Sufficient evidence to support the claim that a difference exists between the proportions
Of students who have ear infections at the two schools?
سؤال
A study of cats and dogs found that 30 of 60 cats and 11 of 40 dogs slept more than 10 hours per day. At the 0.05 level of significance, is there sufficient evidence to conclude
That a difference exists between the proportions of cats and dogs that sleep more than 10
Hours per day?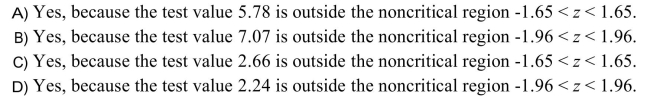
That a difference exists between the proportions of cats and dogs that sleep more than 10
Hours per day?
سؤال
 positive or zero.
 سؤال
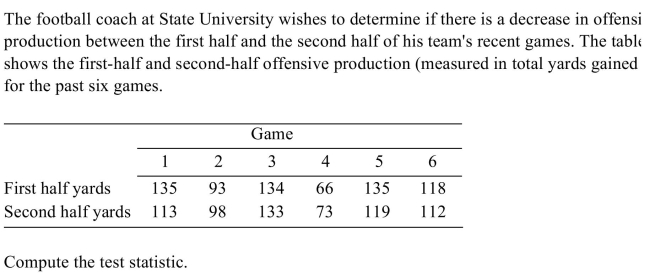
A) 2
B) 6
C) 5
D) 14
سؤال
سؤال

سؤال

A) 0.53
B) 0.89
C) 0.47
D) 0.11
سؤال
سؤال
سؤال
A poll found that 37% of male voters and 45% of female voters support a particular candidate. To test whether this candidate has equal levels of support between male and
Female voters, the null hypothesis should be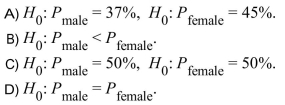
Female voters, the null hypothesis should be

فتح الحزمة
قم بالتسجيل لفتح البطاقات في هذه المجموعة!
Unlock Deck
Unlock Deck
1/99
العب
ملء الشاشة (f)
Deck 9: Testing the Difference Between Two Means, Two Variances, and Two Proportions
1
ol. AsA) -0.66
B) -3.90
C) 0.39
D) -0.26
D
2
A) -2.58
B) -2.33
C) -1.65
D) -1.96
C
3
4
A) The data does not support the conclusion that the average pine tree trunks are larger because the test value 24.54 is greater than than the critical value 1.65.
B) The data supports the conclusion that the average pine tree trunks are larger because the test value 2.94 is greater than than the critical value 1.28.
C) The data does not support the conclusion that the average pine tree trunks are larger because the test value 1.44 is greater than than the critical value 1.28.
D) The data supports the conclusion that the average pine tree trunks are larger because the test value 2.94 is greater than than the critical value 1.65.
فتح الحزمة
افتح القفل للوصول البطاقات البالغ عددها 99 في هذه المجموعة.
فتح الحزمة
k this deck
5
فتح الحزمة
افتح القفل للوصول البطاقات البالغ عددها 99 في هذه المجموعة.
فتح الحزمة
k this deck
6
A) -5.38
B) -1.86
C) -3.70
D) -0.47
فتح الحزمة
افتح القفل للوصول البطاقات البالغ عددها 99 في هذه المجموعة.
فتح الحزمة
k this deck
7
فتح الحزمة
افتح القفل للوصول البطاقات البالغ عددها 99 في هذه المجموعة.
فتح الحزمة
k this deck
8
A) The data supports the claim because the test value 3.30 is greater than the critical value 1.65.
B) The data supports the claim because the test value 3.30 is greater than the critical value 1.96.
C) The data supports the claim because the test value 1.82 is less than the critical value 1.96.
D) The data supports the claim because the test value 1.82 is greater than the critical value 1.65.
فتح الحزمة
افتح القفل للوصول البطاقات البالغ عددها 99 في هذه المجموعة.
فتح الحزمة
k this deck
9
فتح الحزمة
افتح القفل للوصول البطاقات البالغ عددها 99 في هذه المجموعة.
فتح الحزمة
k this deck
10
فتح الحزمة
افتح القفل للوصول البطاقات البالغ عددها 99 في هذه المجموعة.
فتح الحزمة
k this deck
11
فتح الحزمة
افتح القفل للوصول البطاقات البالغ عددها 99 في هذه المجموعة.
فتح الحزمة
k this deck
12
A) 9.51
B) 1.21
C) 0.22
D) 2.10
فتح الحزمة
افتح القفل للوصول البطاقات البالغ عددها 99 في هذه المجموعة.
فتح الحزمة
k this deck
13
فتح الحزمة
افتح القفل للوصول البطاقات البالغ عددها 99 في هذه المجموعة.
فتح الحزمة
k this deck
14
فتح الحزمة
افتح القفل للوصول البطاقات البالغ عددها 99 في هذه المجموعة.
فتح الحزمة
k this deck
15
A) Accept the null hypothesis.
B) Reject the alternative hypothesis.
C) Reject the null hypothesis.
D) Accept the equality hypothesis.
فتح الحزمة
افتح القفل للوصول البطاقات البالغ عددها 99 في هذه المجموعة.
فتح الحزمة
k this deck
16
فتح الحزمة
افتح القفل للوصول البطاقات البالغ عددها 99 في هذه المجموعة.
فتح الحزمة
k this deck
17
A) 15
B) 16
C) 11
D) 14
فتح الحزمة
افتح القفل للوصول البطاقات البالغ عددها 99 في هذه المجموعة.
فتح الحزمة
k this deck
18
فتح الحزمة
افتح القفل للوصول البطاقات البالغ عددها 99 في هذه المجموعة.
فتح الحزمة
k this deck
19
فتح الحزمة
افتح القفل للوصول البطاقات البالغ عددها 99 في هذه المجموعة.
فتح الحزمة
k this deck
20
فتح الحزمة
افتح القفل للوصول البطاقات البالغ عددها 99 في هذه المجموعة.
فتح الحزمة
k this deck
21
فتح الحزمة
افتح القفل للوصول البطاقات البالغ عددها 99 في هذه المجموعة.
فتح الحزمة
k this deck
22
فتح الحزمة
افتح القفل للوصول البطاقات البالغ عددها 99 في هذه المجموعة.
فتح الحزمة
k this deck
23
A) Yes
B) No
فتح الحزمة
افتح القفل للوصول البطاقات البالغ عددها 99 في هذه المجموعة.
فتح الحزمة
k this deck
24
فتح الحزمة
افتح القفل للوصول البطاقات البالغ عددها 99 في هذه المجموعة.
فتح الحزمة
k this deck
25
Twelve dieters lost an average of 5.2 pounds in 6 weeks when given a special diet plus a "fat-blocking" herbal formula. A control group of twelve other dieters were given the
Same diet, but without the herbal formula, and lost an average of 4.5 pounds during the
Same time. The standard deviation of the "fat-blocker" sample was 2.8 and the standard
Deviation of the control group was 2.5. Find the 95% confidence interval for the
Differences of the means.
Same diet, but without the herbal formula, and lost an average of 4.5 pounds during the
Same time. The standard deviation of the "fat-blocker" sample was 2.8 and the standard
Deviation of the control group was 2.5. Find the 95% confidence interval for the
Differences of the means.
فتح الحزمة
افتح القفل للوصول البطاقات البالغ عددها 99 في هذه المجموعة.
فتح الحزمة
k this deck
26
فتح الحزمة
افتح القفل للوصول البطاقات البالغ عددها 99 في هذه المجموعة.
فتح الحزمة
k this deck
27
فتح الحزمة
افتح القفل للوصول البطاقات البالغ عددها 99 في هذه المجموعة.
فتح الحزمة
k this deck
28
فتح الحزمة
افتح القفل للوصول البطاقات البالغ عددها 99 في هذه المجموعة.
فتح الحزمة
k this deck
29
A) -1.753
B) -2.131
C) -1.761
D) -2.145
فتح الحزمة
افتح القفل للوصول البطاقات البالغ عددها 99 في هذه المجموعة.
فتح الحزمة
k this deck
30
A) -0.31
B) -0.91
C) -7.07
D) -0.11
فتح الحزمة
افتح القفل للوصول البطاقات البالغ عددها 99 في هذه المجموعة.
فتح الحزمة
k this deck
31
A) No
B) Yes
فتح الحزمة
افتح القفل للوصول البطاقات البالغ عددها 99 في هذه المجموعة.
فتح الحزمة
k this deck
32
A) -4.46
B) -6.49
C) -2.54
D) -0.92
فتح الحزمة
افتح القفل للوصول البطاقات البالغ عددها 99 في هذه المجموعة.
فتح الحزمة
k this deck
33
a.State the hypotheses.b. Find the critical value(s).
c. Compute the test value.
d. Make the decision.
e. Summarize the results.
فتح الحزمة
افتح القفل للوصول البطاقات البالغ عددها 99 في هذه المجموعة.
فتح الحزمة
k this deck
34
A) Yes
B) No
فتح الحزمة
افتح القفل للوصول البطاقات البالغ عددها 99 في هذه المجموعة.
فتح الحزمة
k this deck
35
A group of college students believes the average grades in psychology courses are different than the average grades in biology courses. The group found the average
Psychology grades of a sample of 11 students was 82.4 and the average biology grades of
A sample of 11 students was 81.2. What is the null hypothesis for this study?
Psychology grades of a sample of 11 students was 82.4 and the average biology grades of
A sample of 11 students was 81.2. What is the null hypothesis for this study?
فتح الحزمة
افتح القفل للوصول البطاقات البالغ عددها 99 في هذه المجموعة.
فتح الحزمة
k this deck
36
A) 10.791309
B) 11.791309
C) 0.189353
D) -0.917205
فتح الحزمة
افتح القفل للوصول البطاقات البالغ عددها 99 في هذه المجموعة.
فتح الحزمة
k this deck
37
A) No
B) Yes
فتح الحزمة
افتح القفل للوصول البطاقات البالغ عددها 99 في هذه المجموعة.
فتح الحزمة
k this deck
38
A) Yes
B) No
فتح الحزمة
افتح القفل للوصول البطاقات البالغ عددها 99 في هذه المجموعة.
فتح الحزمة
k this deck
39
A) -1.888
B) -4.411
C) -0.555
D) -2.935
فتح الحزمة
افتح القفل للوصول البطاقات البالغ عددها 99 في هذه المجموعة.
فتح الحزمة
k this deck
40
asA) Yes
B) No
فتح الحزمة
افتح القفل للوصول البطاقات البالغ عددها 99 في هذه المجموعة.
فتح الحزمة
k this deck
41
فتح الحزمة
افتح القفل للوصول البطاقات البالغ عددها 99 في هذه المجموعة.
فتح الحزمة
k this deck
42
A) 0.84
B) 0.13
C) 0.11
D) 0.78
فتح الحزمة
افتح القفل للوصول البطاقات البالغ عددها 99 في هذه المجموعة.
فتح الحزمة
k this deck
43
A) -1.67
B) -1.43
C) 1.67
D) 6.3
فتح الحزمة
افتح القفل للوصول البطاقات البالغ عددها 99 في هذه المجموعة.
فتح الحزمة
k this deck
44
فتح الحزمة
افتح القفل للوصول البطاقات البالغ عددها 99 في هذه المجموعة.
فتح الحزمة
k this deck
45
A) No
B) Yes
فتح الحزمة
افتح القفل للوصول البطاقات البالغ عددها 99 في هذه المجموعة.
فتح الحزمة
k this deck
46
A) 4.651
B) 1.405
C) 8.547
D) 3.141
فتح الحزمة
افتح القفل للوصول البطاقات البالغ عددها 99 في هذه المجموعة.
فتح الحزمة
k this deck
47
A) No
B) Yes
فتح الحزمة
افتح القفل للوصول البطاقات البالغ عددها 99 في هذه المجموعة.
فتح الحزمة
k this deck
48
فتح الحزمة
افتح القفل للوصول البطاقات البالغ عددها 99 في هذه المجموعة.
فتح الحزمة
k this deck
49
A) No
B) Yes
فتح الحزمة
افتح القفل للوصول البطاقات البالغ عددها 99 في هذه المجموعة.
فتح الحزمة
k this deck
50
A) -1.943
B) -2.447
C) -2.365
D) -1.895
فتح الحزمة
افتح القفل للوصول البطاقات البالغ عددها 99 في هذه المجموعة.
فتح الحزمة
k this deck
51
A) 2.666
B) 1.083
C) 2.433
D) 0.313
فتح الحزمة
افتح القفل للوصول البطاقات البالغ عددها 99 في هذه المجموعة.
فتح الحزمة
k this deck
52
فتح الحزمة
افتح القفل للوصول البطاقات البالغ عددها 99 في هذه المجموعة.
فتح الحزمة
k this deck
53
A) 22
B) 26.338
C) 23
D) 1.979112
فتح الحزمة
افتح القفل للوصول البطاقات البالغ عددها 99 في هذه المجموعة.
فتح الحزمة
k this deck
54
A) 1.164
B) 1.063
C) 0.475
D) 3.960
فتح الحزمة
افتح القفل للوصول البطاقات البالغ عددها 99 في هذه المجموعة.
فتح الحزمة
k this deck
55
A) 0.999575
B) 15.257247
C) 0.000425
D) -4.091887
فتح الحزمة
افتح القفل للوصول البطاقات البالغ عددها 99 في هذه المجموعة.
فتح الحزمة
k this deck
56
فتح الحزمة
افتح القفل للوصول البطاقات البالغ عددها 99 في هذه المجموعة.
فتح الحزمة
k this deck
57
فتح الحزمة
افتح القفل للوصول البطاقات البالغ عددها 99 في هذه المجموعة.
فتح الحزمة
k this deck
58
فتح الحزمة
افتح القفل للوصول البطاقات البالغ عددها 99 في هذه المجموعة.
فتح الحزمة
k this deck
59
A) 1.31
B) 0.53
C) 1.03
D) 2.53
فتح الحزمة
افتح القفل للوصول البطاقات البالغ عددها 99 في هذه المجموعة.
فتح الحزمة
k this deck
60
فتح الحزمة
افتح القفل للوصول البطاقات البالغ عددها 99 في هذه المجموعة.
فتح الحزمة
k this deck
61
A poll found that 39% of male voters and 42% of female voters support a particular candidate. To test whether this candidate has equal levels of support between male and
Female voters, the alternative hypothesis should be
Female voters, the alternative hypothesis should be
فتح الحزمة
افتح القفل للوصول البطاقات البالغ عددها 99 في هذه المجموعة.
فتح الحزمة
k this deck
62
A) 17
B) 9
C) 16
D) 8
فتح الحزمة
افتح القفل للوصول البطاقات البالغ عددها 99 في هذه المجموعة.
فتح الحزمة
k this deck
63
The formula of the test value to be used in a t test for dependent samples is
.
.
فتح الحزمة
افتح القفل للوصول البطاقات البالغ عددها 99 في هذه المجموعة.
فتح الحزمة
k this deck
64
When the subjects are paired or matched in some way, samples are considered to
be .
be .
فتح الحزمة
افتح القفل للوصول البطاقات البالغ عددها 99 في هذه المجموعة.
فتح الحزمة
k this deck
65
فتح الحزمة
افتح القفل للوصول البطاقات البالغ عددها 99 في هذه المجموعة.
فتح الحزمة
k this deck
66
64% of students at a university live on campus. A random sample found that 28 of 45 male students and 39 of 50 of female students live on campus. At the 0.05 level of
Significance, is there sufficient evidence to support the claim that a difference exists
Between the proportions of male and female students who live on campus?
Significance, is there sufficient evidence to support the claim that a difference exists
Between the proportions of male and female students who live on campus?
فتح الحزمة
افتح القفل للوصول البطاقات البالغ عددها 99 في هذه المجموعة.
فتح الحزمة
k this deck
67
A) There is not enough information to draw a conclusion.
B) No. There is not sufficient evidence to conclude that the proportion of dog owners has changed.
C) Yes. There is sufficient evidence to conclude that the proportion of dog owners has changed.
فتح الحزمة
افتح القفل للوصول البطاقات البالغ عددها 99 في هذه المجموعة.
فتح الحزمة
k this deck
68
A) There is not enough information to draw a conclusion.
B) Yes. There is enough evidence to support the claim that women are less safety-conscious than men.
C) No. There is not enough evidence to support the claim that women are less safety-conscious than men.
فتح الحزمة
افتح القفل للوصول البطاقات البالغ عددها 99 في هذه المجموعة.
فتح الحزمة
k this deck
69
A recent survey reported that in a sample of 300 students who attend two-year colleges, 105 work at least 20 hours per week. Additionally, in a sample of 225 students attending
Private four-year universities, only 20 students work at least 20 hours per week. What is
The test value for a test of the difference between these two population proportions?
A) 4.18
B) 2.38
C) 7.61
D) 6.95
Private four-year universities, only 20 students work at least 20 hours per week. What is
The test value for a test of the difference between these two population proportions?
A) 4.18
B) 2.38
C) 7.61
D) 6.95
فتح الحزمة
افتح القفل للوصول البطاقات البالغ عددها 99 في هذه المجموعة.
فتح الحزمة
k this deck
70
When subjects are matched according to one variable, the matching process does not
eliminate the influence of other variables.
eliminate the influence of other variables.
فتح الحزمة
افتح القفل للوصول البطاقات البالغ عددها 99 في هذه المجموعة.
فتح الحزمة
k this deck
71
Many elementary school students in a school district currently have ear infections. A random sample of children in two different schools found that 16 of 42 at one school and
17 of 30 at the other have ear infections. At the 0.05 level of significance, is there
Sufficient evidence to support the claim that a difference exists between the proportions
Of students who have ear infections at the two schools?
17 of 30 at the other have ear infections. At the 0.05 level of significance, is there
Sufficient evidence to support the claim that a difference exists between the proportions
Of students who have ear infections at the two schools?
فتح الحزمة
افتح القفل للوصول البطاقات البالغ عددها 99 في هذه المجموعة.
فتح الحزمة
k this deck
72
A study of cats and dogs found that 30 of 60 cats and 11 of 40 dogs slept more than 10 hours per day. At the 0.05 level of significance, is there sufficient evidence to conclude
That a difference exists between the proportions of cats and dogs that sleep more than 10
Hours per day?
That a difference exists between the proportions of cats and dogs that sleep more than 10
Hours per day?
فتح الحزمة
افتح القفل للوصول البطاقات البالغ عددها 99 في هذه المجموعة.
فتح الحزمة
k this deck
73
positive or zero. فتح الحزمة
افتح القفل للوصول البطاقات البالغ عددها 99 في هذه المجموعة.
فتح الحزمة
k this deck
74
A) 2
B) 6
C) 5
D) 14
فتح الحزمة
افتح القفل للوصول البطاقات البالغ عددها 99 في هذه المجموعة.
فتح الحزمة
k this deck
75
فتح الحزمة
افتح القفل للوصول البطاقات البالغ عددها 99 في هذه المجموعة.
فتح الحزمة
k this deck
76
فتح الحزمة
افتح القفل للوصول البطاقات البالغ عددها 99 في هذه المجموعة.
فتح الحزمة
k this deck
77
A) 0.53
B) 0.89
C) 0.47
D) 0.11
فتح الحزمة
افتح القفل للوصول البطاقات البالغ عددها 99 في هذه المجموعة.
فتح الحزمة
k this deck
78
Samples are independent when they are not related.
فتح الحزمة
افتح القفل للوصول البطاقات البالغ عددها 99 في هذه المجموعة.
فتح الحزمة
k this deck
79
Two groups were polled about their attitudes towards capital punishment. In one group 30 out of 100 favored capital punishment, and in the other group 40 out of 80 favored
Capital punishment. Calculate an appropriate test value test the hypothesis that the
Population proportions are the same.
A) -37.40
B) -2.73
C) -0.20
D) -13.68
Capital punishment. Calculate an appropriate test value test the hypothesis that the
Population proportions are the same.
A) -37.40
B) -2.73
C) -0.20
D) -13.68
فتح الحزمة
افتح القفل للوصول البطاقات البالغ عددها 99 في هذه المجموعة.
فتح الحزمة
k this deck
80
A poll found that 37% of male voters and 45% of female voters support a particular candidate. To test whether this candidate has equal levels of support between male and
Female voters, the null hypothesis should be
Female voters, the null hypothesis should be
فتح الحزمة
افتح القفل للوصول البطاقات البالغ عددها 99 في هذه المجموعة.
فتح الحزمة
k this deck
فتح الحزمة
افتح القفل للوصول البطاقات البالغ عددها 99 في هذه المجموعة.


