Deck 10: T Tests, Two-Way Tables, and Anova
ملء الشاشة (f)
سؤال
سؤال
-The t distribution can be used when finding a confidence interval for the population mean whenever the sample size is small.
سؤال
سؤال
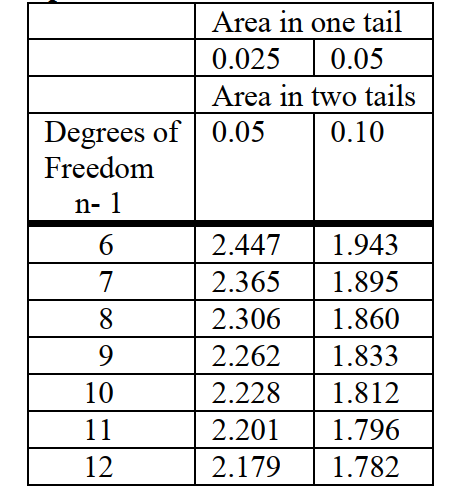
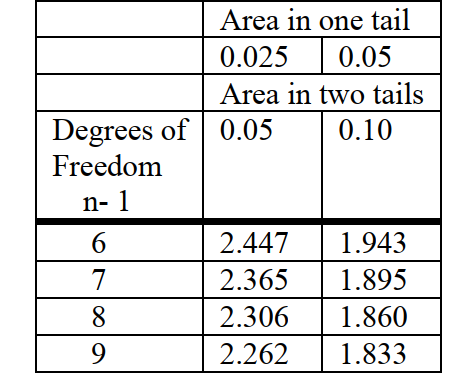
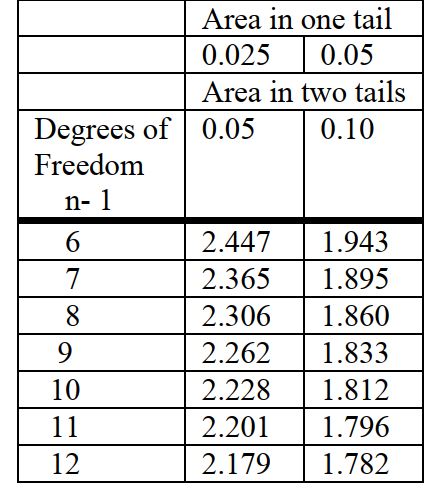
The partial t-table below can be used where necessary.
-The t distribution can be used when finding a confidence interval for the mean with a small sample whenever the data comprise a simple random sample.
-The t distribution can be used when finding a confidence interval for the mean with a small sample whenever the data comprise a simple random sample.
سؤال
-Data from the test in Problem 5 resulted in a sample mean of 163.2 yards with a sample standard deviation of 5.8 yards. Assuming normality, carry out a hypothesis test at the 0.05
سؤال
سؤال
سؤال
سؤال
سؤال
سؤال
سؤال
سؤال
سؤال
سؤال
سؤال
سؤال

-Resulted in a sample mean of 171.6 yards with a sample standard deviation of 2.4 yards. Assuming normality, carry out a hypothesis test at the 0.05 significance
سؤال
سؤال
سؤال
سؤال
سؤال
سؤال
سؤال
-Resulted in a sample mean of 184.2 yards and a sample standard deviation of 5.8 yards. Assuming normality, carry out a hypothesis test at the 0.05 significance
سؤال
سؤال
سؤال
سؤال
سؤال
سؤال
سؤال
سؤال
سؤال
سؤال
سؤال
سؤال
level and determine whether the ball meets the golfer's requirements. Use the partial t-table
above.
One hundred people are selected at random and tested for colorblindness to determine whether
gender and colorblindness are independent. The following counts were observed.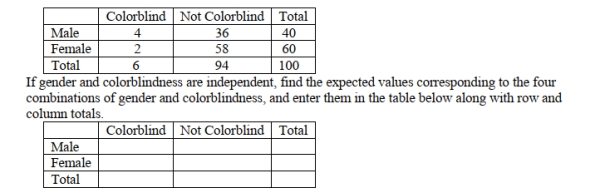
above.
One hundred people are selected at random and tested for colorblindness to determine whether
gender and colorblindness are independent. The following counts were observed.
سؤال
سؤال
-The t distribution can be used when finding a confidence interval for the population mean with a small sample anytime the population standard deviation is unknown.
سؤال
سؤال
سؤال
The analysis of the data in Problem 9 resulted in the following output from Excel. Anova: Single Factor 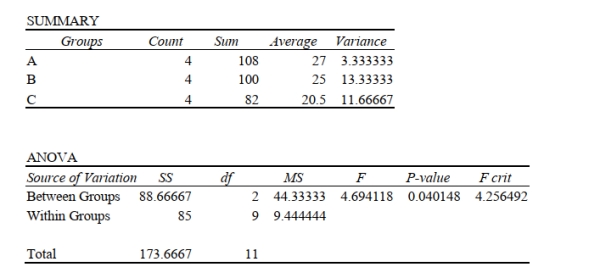 If the significance level for the test is 0.05, which conclusion below is correct?
A) The data do not provide sufficient evidence to conclude that the groups A, B, and C are somehow related.
B) The data do not provide sufficient evidence to conclude that the population means of groups A, B, and C are different.
C) The data do not provide sufficient evidence to conclude that the population variances of groups A, B, and C are different.
D) The data do provide sufficient evidence to conclude that the population means of groups A, B, and C are different.
E) None of the above.
If the significance level for the test is 0.05, which conclusion below is correct?A) The data do not provide sufficient evidence to conclude that the groups A, B, and C are somehow related.
B) The data do not provide sufficient evidence to conclude that the population means of groups A, B, and C are different.
C) The data do not provide sufficient evidence to conclude that the population variances of groups A, B, and C are different.
D) The data do provide sufficient evidence to conclude that the population means of groups A, B, and C are different.
E) None of the above.

فتح الحزمة
قم بالتسجيل لفتح البطاقات في هذه المجموعة!
Unlock Deck
Unlock Deck
1/41
العب
ملء الشاشة (f)
Deck 10: T Tests, Two-Way Tables, and Anova
1
A simple random sample from a normal distribution is taken in order to obtain a 95% confidence interval for the population mean. If the sample size is 11, the sample mean x is 32, and the sample standard deviation s is 12.6, what is the margin of error? Show your answer to 2 decimal places.
2
-The t distribution can be used when finding a confidence interval for the population mean whenever the sample size is small.
False
3
A simple random sample from a normal distribution is taken in order to obtain a 95% confidence interval for the population mean. If the sample size is 8, the sample mean x is 22, and the sample standard deviation s is 6.3, what is the margin of error? Show your answer to 2 decimal places.
4
The partial t-table below can be used where necessary.
-The t distribution can be used when finding a confidence interval for the mean with a small sample whenever the data comprise a simple random sample.
-The t distribution can be used when finding a confidence interval for the mean with a small sample whenever the data comprise a simple random sample.
فتح الحزمة
افتح القفل للوصول البطاقات البالغ عددها 41 في هذه المجموعة.
فتح الحزمة
k this deck
5
-Data from the test in Problem 5 resulted in a sample mean of 163.2 yards with a sample standard deviation of 5.8 yards. Assuming normality, carry out a hypothesis test at the 0.05
فتح الحزمة
افتح القفل للوصول البطاقات البالغ عددها 41 في هذه المجموعة.
فتح الحزمة
k this deck
6
-Find the value of the ?2 statistic for the data .
فتح الحزمة
افتح القفل للوصول البطاقات البالغ عددها 41 في هذه المجموعة.
فتح الحزمة
k this deck
7
One hundred people are selected at random and tested for colorblindness to determine whether gender and colorblindness are independent. The following counts were observed.
If gender and colorblindness are independent, find the expected values corresponding to the four combinations of gender and colorblindness, and enter them in the table below along with row and column totals.
If gender and colorblindness are independent, find the expected values corresponding to the four combinations of gender and colorblindness, and enter them in the table below along with row and column totals.
فتح الحزمة
افتح القفل للوصول البطاقات البالغ عددها 41 في هذه المجموعة.
فتح الحزمة
k this deck
8
-State the null and alternative hypothesis for the test associated with the data
فتح الحزمة
افتح القفل للوصول البطاقات البالغ عددها 41 في هذه المجموعة.
فتح الحزمة
k this deck
9
A 95% confidence interval for the mean of a normal population is found to be 15.6 < µ < 25.2. What is the margin of error?
فتح الحزمة
افتح القفل للوصول البطاقات البالغ عددها 41 في هذه المجموعة.
فتح الحزمة
k this deck
10
-The critical value of ?2 for a 2 x 2 table using a 0.05 significance level is 3.841. If the value of the ?2 statistic iS 3.427, state your conclusion about the relationship between gender and colorblindness.
فتح الحزمة
افتح القفل للوصول البطاقات البالغ عددها 41 في هذه المجموعة.
فتح الحزمة
k this deck
11
A 95% confidence interval for the mean of a normal population is found to be 13.2 < µ < 22.4. What is the margin of error?
فتح الحزمة
افتح القفل للوصول البطاقات البالغ عددها 41 في هذه المجموعة.
فتح الحزمة
k this deck
12
The analysis of the data in Problem 9 resulted in the following output from Excel.
Anova: Single Factor
If the significance level for the test is 0.05, which conclusion below is correct?
A) The data do not provide sufficient evidence to conclude that the groups A, B, and C are somehow related.
B) The data do not provide sufficient evidence to conclude that the population means of groups A, B, and C are different.
C) The data do not provide sufficient evidence to conclude that the population variances of groups A, B, and C are different.
D) The data do provide sufficient evidence to conclude that the population means of groups A, B, and C are different.
E) None of the above.
فتح الحزمة
افتح القفل للوصول البطاقات البالغ عددها 41 في هذه المجموعة.
فتح الحزمة
k this deck
13
-Find the value of the ?2 statistic for the data
فتح الحزمة
افتح القفل للوصول البطاقات البالغ عددها 41 في هذه المجموعة.
فتح الحزمة
k this deck
14
The following data were analyzed using one-way analysis of variance.
` Which one of the following statements is correct?
A) The purpose of the analysis is to determine whether the groups A, B, and C are independent.
B) The purpose of the analysis is to test the hypothesis that the population means of the three groups are equal.
C) The purpose of the analysis is to test the hypothesis that the population variances of the three groups are equal.
D) The purpose of the analysis is to test the hypothesis that the sample means of the three groups are equal.
فتح الحزمة
افتح القفل للوصول البطاقات البالغ عددها 41 في هذه المجموعة.
فتح الحزمة
k this deck
15
A golfer wished to find a ball that would travel more than 160 yards when hit with his 7-iron with a club speed of 90 miles per hour. He had a golf equipment lab test a low compression ball by having a robot swing his club 8 times at the required speed. State the null and alternative hypotheses for this test.
فتح الحزمة
افتح القفل للوصول البطاقات البالغ عددها 41 في هذه المجموعة.
فتح الحزمة
k this deck
16
One hundred people are selected at random and tested for colorblindness to determine whether gender and colorblindness are independent. The following counts were observed.
If gender and colorblindness are independent, find the expected values corresponding to the four combinations of gender and colorblindness, and enter them in the table below along with row and column totals.
If gender and colorblindness are independent, find the expected values corresponding to the four combinations of gender and colorblindness, and enter them in the table below along with row and column totals.
فتح الحزمة
افتح القفل للوصول البطاقات البالغ عددها 41 في هذه المجموعة.
فتح الحزمة
k this deck
17
-Resulted in a sample mean of 171.6 yards with a sample standard deviation of 2.4 yards. Assuming normality, carry out a hypothesis test at the 0.05 significance
فتح الحزمة
افتح القفل للوصول البطاقات البالغ عددها 41 في هذه المجموعة.
فتح الحزمة
k this deck
18
The following data were analyzed using one-way analysis of variance. ` Which one of the following statements is correct?
A) The purpose of the analysis is to determine whether the groups A, B, and C are independent.
B) The purpose of the analysis is to test the hypothesis that the population means of the three groups are equal.
C) The purpose of the analysis is to test the hypothesis that the population variances of the three groups are equal.
D) The purpose of the analysis is to test the hypothesis that the sample means of the three groups are equal.
فتح الحزمة
افتح القفل للوصول البطاقات البالغ عددها 41 في هذه المجموعة.
فتح الحزمة
k this deck
19
A golfer wished to find a ball that would travel more than 170 yards when hit with his 6-iron with a club head speed of 90 miles per hour. He had a golf equipment lab test a low compression ball by having a robot swing his club 12 times at the required speed. State the null and alternative hypotheses for this test.
فتح الحزمة
افتح القفل للوصول البطاقات البالغ عددها 41 في هذه المجموعة.
فتح الحزمة
k this deck
20
-The critical value of ? 2 for a 2 x 2 table using a 0.05 significance level is 3.841. If the value of the ? 2 statistic is 3.179, state your conclusion about the relationship between gender and colorblindness.
فتح الحزمة
افتح القفل للوصول البطاقات البالغ عددها 41 في هذه المجموعة.
فتح الحزمة
k this deck
21
The critical value of χ2 for a 2 x 2 table using a 0.05 significance level is 3.841. If the value of the
χ2 statistic in Problem 8 had been 4.216, state your conclusion about the relationship between
gender and colorblindness.
χ2 statistic in Problem 8 had been 4.216, state your conclusion about the relationship between
gender and colorblindness.
فتح الحزمة
افتح القفل للوصول البطاقات البالغ عددها 41 في هذه المجموعة.
فتح الحزمة
k this deck
22
The margin of error in estimating the population mean of a normal population is E = 6.3 when the sample standard deviation is 8.2. If the sample standard deviation were increased to 9.1 and the sample size stayed the same, would the margin of error be larger or smaller than 6.3? Explain your answer.
فتح الحزمة
افتح القفل للوصول البطاقات البالغ عددها 41 في هذه المجموعة.
فتح الحزمة
k this deck
23
The following data were analyzed using one-way analysis of variance. ` Which one of the following statements is correct?
A) The purpose of the analysis is to determine whether the groups A, B, and C are independent.
B) The purpose of the analysis is to test the hypothesis that the population means of the three groups are equal.
C) The purpose of the analysis is to test the hypothesis that the population variances of the three groups are equal.
D) The purpose of the analysis is to test the hypothesis that the sample means of the three groups are equal.
A) The purpose of the analysis is to determine whether the groups A, B, and C are independent.
B) The purpose of the analysis is to test the hypothesis that the population means of the three groups are equal.
C) The purpose of the analysis is to test the hypothesis that the population variances of the three groups are equal.
D) The purpose of the analysis is to test the hypothesis that the sample means of the three groups are equal.
فتح الحزمة
افتح القفل للوصول البطاقات البالغ عددها 41 في هذه المجموعة.
فتح الحزمة
k this deck
24
-Resulted in a sample mean of 184.2 yards and a sample standard deviation of 5.8 yards. Assuming normality, carry out a hypothesis test at the 0.05 significance
فتح الحزمة
افتح القفل للوصول البطاقات البالغ عددها 41 في هذه المجموعة.
فتح الحزمة
k this deck
25
A simple random sample from a normal distribution is taken in order to obtain a 95% confidence interval for the population mean. If the sample size is 12, the sample mean x
is 22, and the sample standard deviation s is 5.5, what is the margin of error? Show your answer to 2 decimal places.
is 22, and the sample standard deviation s is 5.5, what is the margin of error? Show your answer to 2 decimal places.
فتح الحزمة
افتح القفل للوصول البطاقات البالغ عددها 41 في هذه المجموعة.
فتح الحزمة
k this deck
26
The following data were analyzed using one-way analysis of variance. ` Which one of the following statements is correct?
A) The purpose of the analysis is to determine whether the groups A, B, and C are independent.
B) The purpose of the analysis is to test the hypothesis that the population means of the three groups are equal.
C) The purpose of the analysis is to test the hypothesis that the population variances of the three groups are equal.
D) The purpose of the analysis is to test the hypothesis that the sample means of the three groups are equal.
A) The purpose of the analysis is to determine whether the groups A, B, and C are independent.
B) The purpose of the analysis is to test the hypothesis that the population means of the three groups are equal.
C) The purpose of the analysis is to test the hypothesis that the population variances of the three groups are equal.
D) The purpose of the analysis is to test the hypothesis that the sample means of the three groups are equal.
فتح الحزمة
افتح القفل للوصول البطاقات البالغ عددها 41 في هذه المجموعة.
فتح الحزمة
k this deck
27
A 95% confidence interval for the mean of a normal population is found to be 15.6 < µ < 24.8. What is the margin of error?
فتح الحزمة
افتح القفل للوصول البطاقات البالغ عددها 41 في هذه المجموعة.
فتح الحزمة
k this deck
28
The analysis of the data in Problem 9 resulted in the following output from Excel.
Anova: Single Factor
If the significance level for the test is 0.05, which conclusion below is correct?
A) The data provide sufficient evidence to conclude that the groups A, B, and C are somehow related.
B) The data provide sufficient evidence to conclude that the population means of groups A, B, and C are different.
C) The data provide sufficient evidence to conclude that the population variances of groups A, B, and C are different.
D) The data do not provide sufficient evidence to conclude that the population means of groups A, B, and C are different.
E) None of the above.
فتح الحزمة
افتح القفل للوصول البطاقات البالغ عددها 41 في هذه المجموعة.
فتح الحزمة
k this deck
29
A 95% confidence interval for the mean of a normal population is found to be 17.6 < µ < 23.6.
What is the margin of error?
What is the margin of error?
فتح الحزمة
افتح القفل للوصول البطاقات البالغ عددها 41 في هذه المجموعة.
فتح الحزمة
k this deck
30
A simple random sample from a normal distribution is taken in order to obtain a 95% confidence
interval for the population mean. If the sample size is 12, the sample mean x
is 32, and the
sample standard deviation s is 7.5, what is the margin of error? Show your answer to 2 decimal
places.
interval for the population mean. If the sample size is 12, the sample mean x
is 32, and the
sample standard deviation s is 7.5, what is the margin of error? Show your answer to 2 decimal
places.
فتح الحزمة
افتح القفل للوصول البطاقات البالغ عددها 41 في هذه المجموعة.
فتح الحزمة
k this deck
31
State the null and alternative hypothesis for the test associated with the data in Problem 7.
فتح الحزمة
افتح القفل للوصول البطاقات البالغ عددها 41 في هذه المجموعة.
فتح الحزمة
k this deck
32
-The critical value of ?2 for a 2 x 2 table using a 0.05 significance level is 3.841. If the value of the ?2 statistic is 4.613, state your conclusion about the relationship between gender and colorblindness.
فتح الحزمة
افتح القفل للوصول البطاقات البالغ عددها 41 في هذه المجموعة.
فتح الحزمة
k this deck
33
-State the null and alternative hypothesis for the test associated with the data.
فتح الحزمة
افتح القفل للوصول البطاقات البالغ عددها 41 في هذه المجموعة.
فتح الحزمة
k this deck
34
One hundred people are selected at random and tested for colorblindness to determine whether
gender and colorblindness are independent. The following counts were observed.
Colorblind Not Colorblind Total
If gender and colorblindness are independent, find the expected values corresponding to the four combinations of gender and colorblindness, and enter them in the following table along with row
فتح الحزمة
افتح القفل للوصول البطاقات البالغ عددها 41 في هذه المجموعة.
فتح الحزمة
k this deck
35
The t distribution can be used when finding a confidence interval for the population mean
with a small sample whenever the sample comes from a symmetric population.
with a small sample whenever the sample comes from a symmetric population.
فتح الحزمة
افتح القفل للوصول البطاقات البالغ عددها 41 في هذه المجموعة.
فتح الحزمة
k this deck
36
level and determine whether the ball meets the golfer's requirements. Use the partial t-table
above.
One hundred people are selected at random and tested for colorblindness to determine whether
gender and colorblindness are independent. The following counts were observed.
above.
One hundred people are selected at random and tested for colorblindness to determine whether
gender and colorblindness are independent. The following counts were observed.
فتح الحزمة
افتح القفل للوصول البطاقات البالغ عددها 41 في هذه المجموعة.
فتح الحزمة
k this deck
37
Find the value of the χ2 statistic for the data in Problem 7.
131
131
فتح الحزمة
افتح القفل للوصول البطاقات البالغ عددها 41 في هذه المجموعة.
فتح الحزمة
k this deck
38
-The t distribution can be used when finding a confidence interval for the population mean with a small sample anytime the population standard deviation is unknown.
فتح الحزمة
افتح القفل للوصول البطاقات البالغ عددها 41 في هذه المجموعة.
فتح الحزمة
k this deck
39
A golfer wished to find a ball that would travel more than 180 yards when hit with his 5-iron witha club speed of 90 miles per hour. He had a golf equipment lab test a low compression ball by having a robot swing his club 7 times at the required speed. State the null and alternative hypotheses for this test.
فتح الحزمة
افتح القفل للوصول البطاقات البالغ عددها 41 في هذه المجموعة.
فتح الحزمة
k this deck
40
The analysis of the data in Problem 9 resulted in the following output from Excel.
Anova: Single Factor
If the significance level for the test is 0.05, which conclusion below is correct?
A) The data do not provide sufficient evidence to conclude that the groups A, B, and C are somehow related.
B) The data do not provide sufficient evidence to conclude that the population means of groups A, B, and C are different.
C) The data do not provide sufficient evidence to conclude that the population variances of groups A, B, and C are different.
D) The data do provide sufficient evidence to conclude that the population means of groups A, B, and C are different.
E) None of the above.
فتح الحزمة
افتح القفل للوصول البطاقات البالغ عددها 41 في هذه المجموعة.
فتح الحزمة
k this deck
41
The analysis of the data in Problem 9 resulted in the following output from Excel. Anova: Single Factor If the significance level for the test is 0.05, which conclusion below is correct?
A) The data do not provide sufficient evidence to conclude that the groups A, B, and C are somehow related.
B) The data do not provide sufficient evidence to conclude that the population means of groups A, B, and C are different.
C) The data do not provide sufficient evidence to conclude that the population variances of groups A, B, and C are different.
D) The data do provide sufficient evidence to conclude that the population means of groups A, B, and C are different.
E) None of the above.
If the significance level for the test is 0.05, which conclusion below is correct?A) The data do not provide sufficient evidence to conclude that the groups A, B, and C are somehow related.
B) The data do not provide sufficient evidence to conclude that the population means of groups A, B, and C are different.
C) The data do not provide sufficient evidence to conclude that the population variances of groups A, B, and C are different.
D) The data do provide sufficient evidence to conclude that the population means of groups A, B, and C are different.
E) None of the above.
فتح الحزمة
افتح القفل للوصول البطاقات البالغ عددها 41 في هذه المجموعة.
فتح الحزمة
k this deck
فتح الحزمة
افتح القفل للوصول البطاقات البالغ عددها 41 في هذه المجموعة.


