Deck 4: Describing Data
ملء الشاشة (f)
سؤال
سؤال
سؤال
سؤال
سؤال
سؤال
سؤال
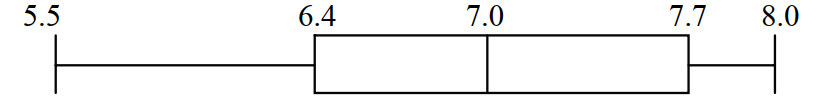
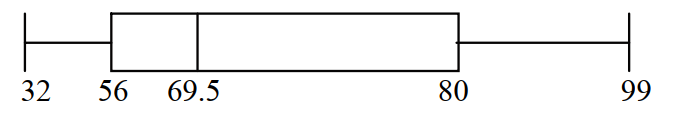
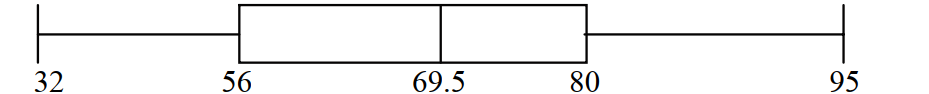
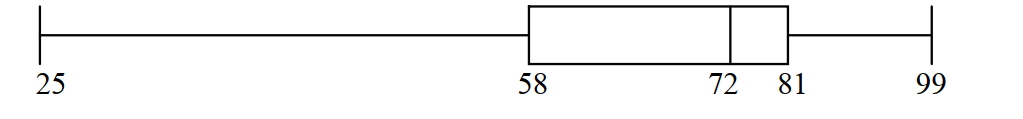
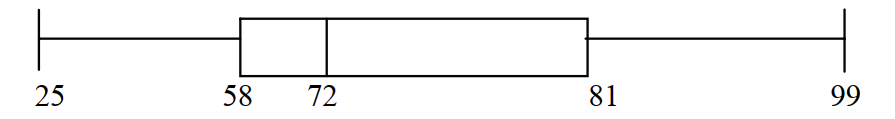
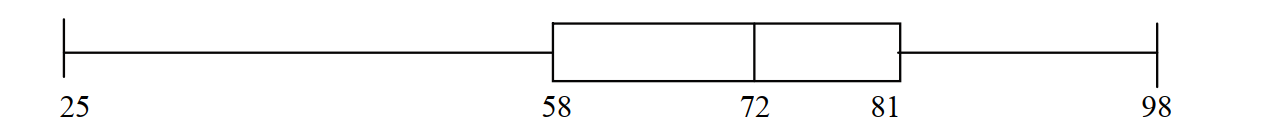
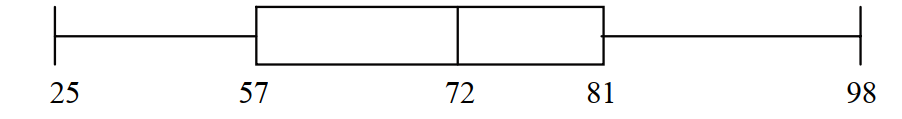
The weights (in pounds) of 30 newborn babies are listed below. Construct a boxplot for the data set.
A)

B)

C)
D)

A)
B)
C)
D)
سؤال
سؤال
سؤال
The weights (in ounces) of 21 cookies are shown. Find the median weight. 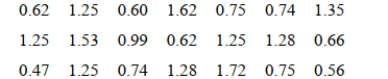
سؤال
سؤال
سؤال
سؤال
سؤال
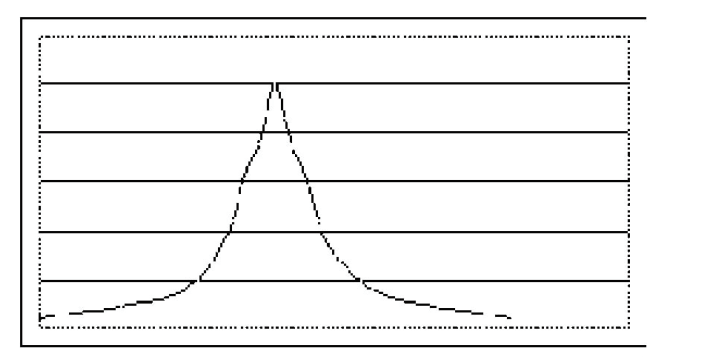
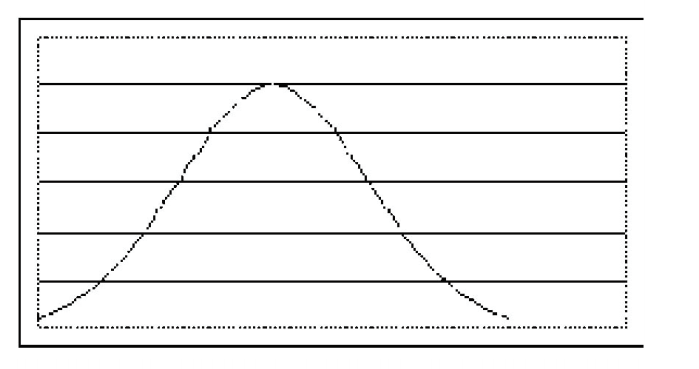
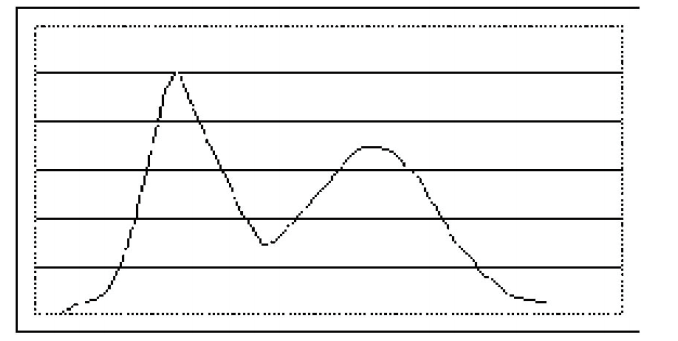
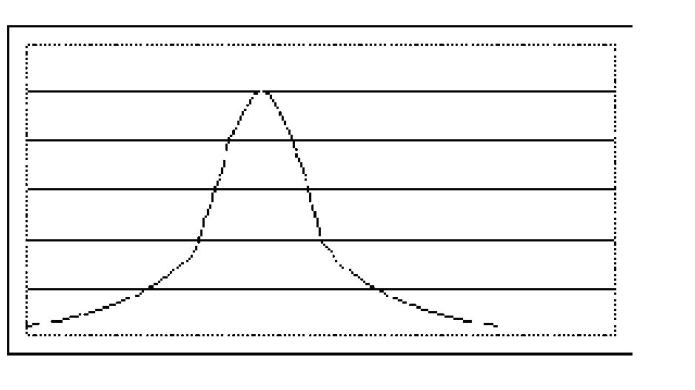
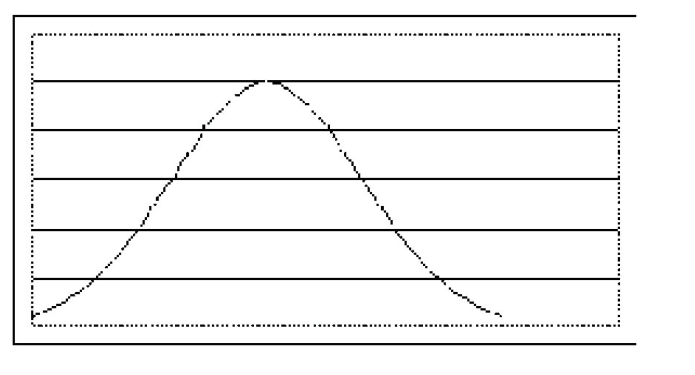
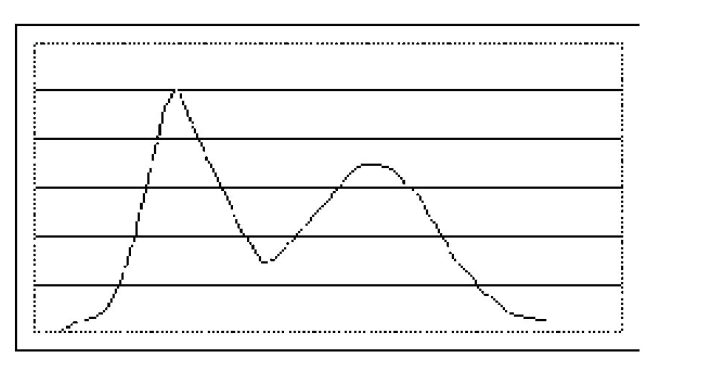
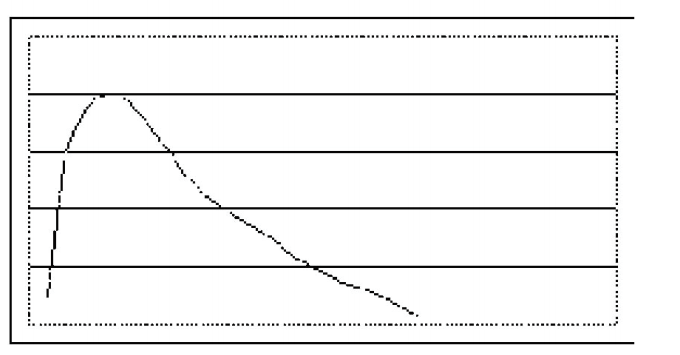
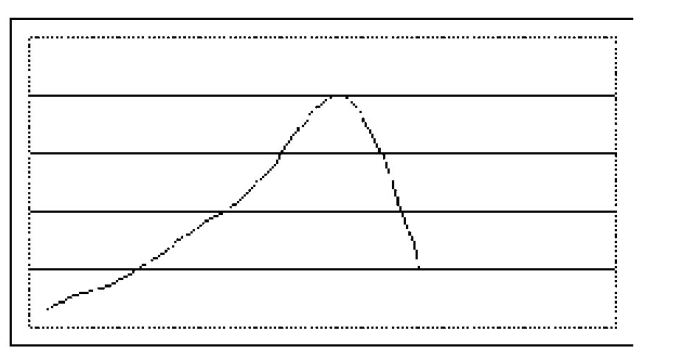
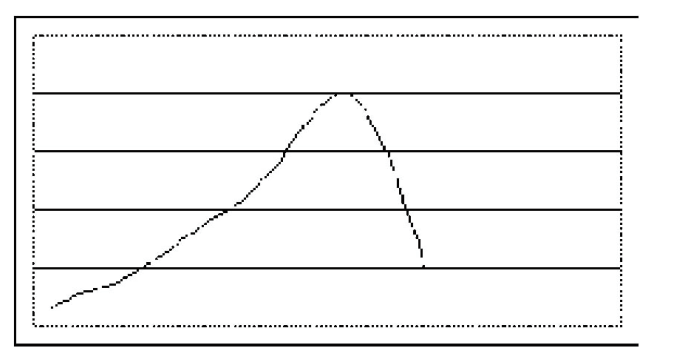
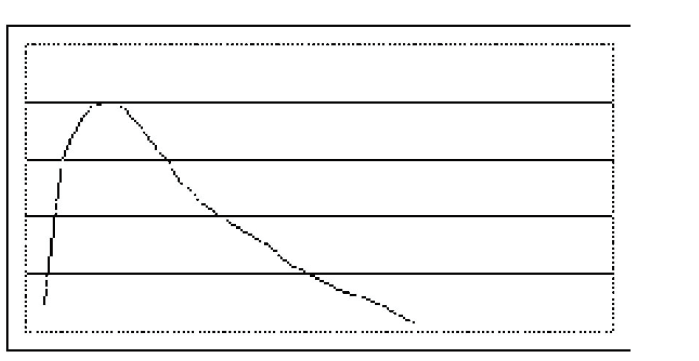
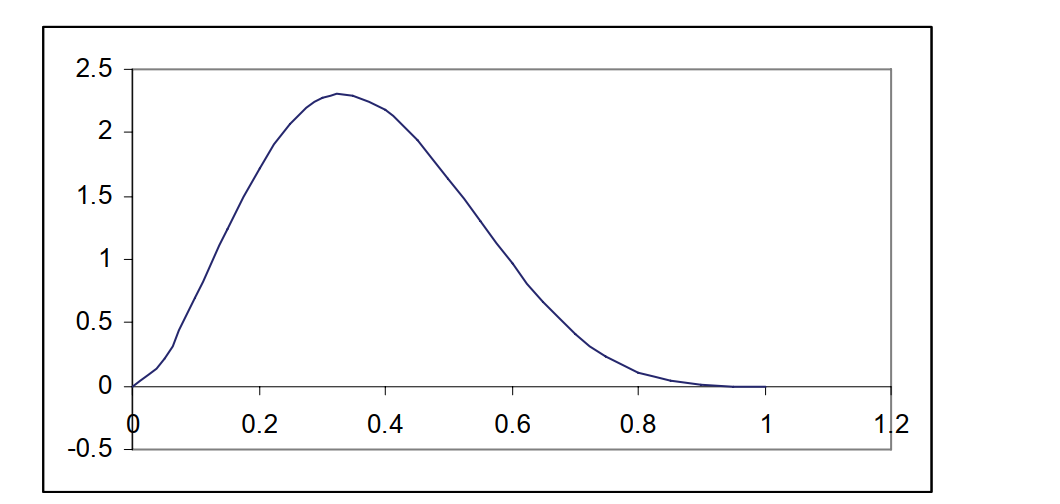
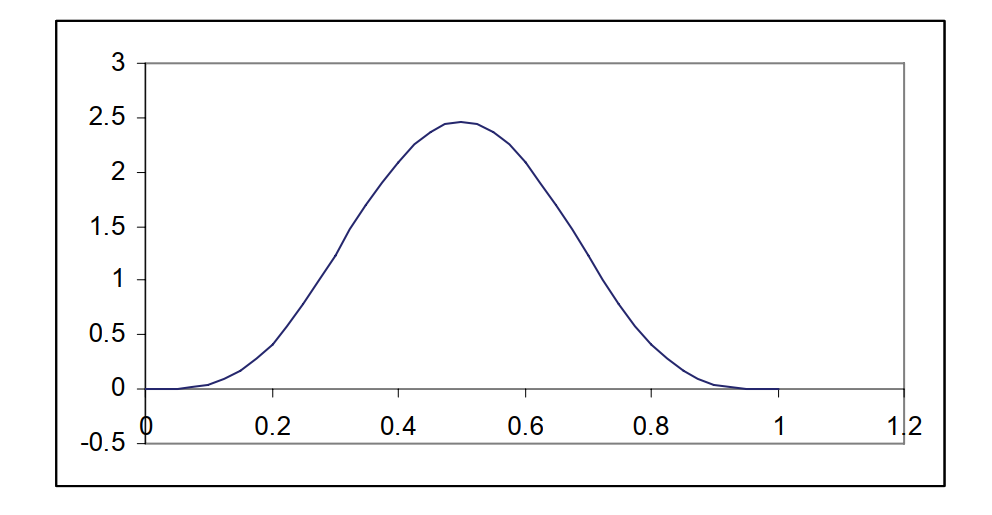
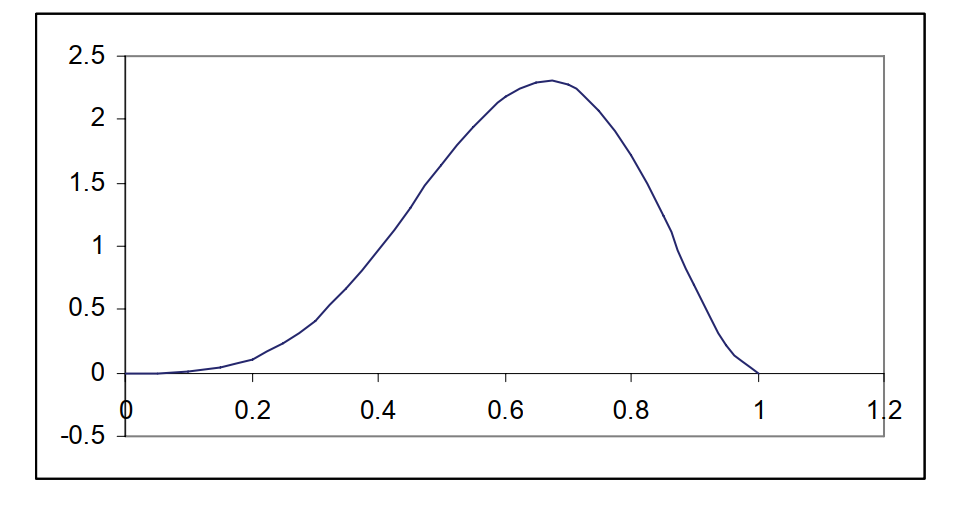
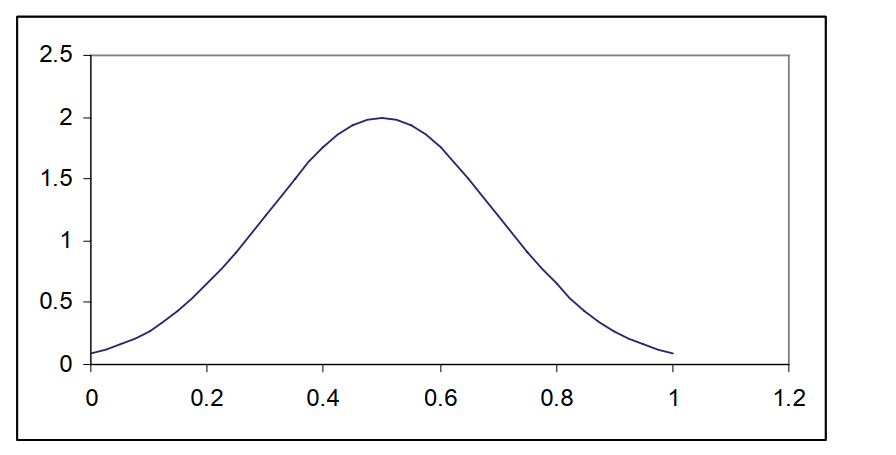
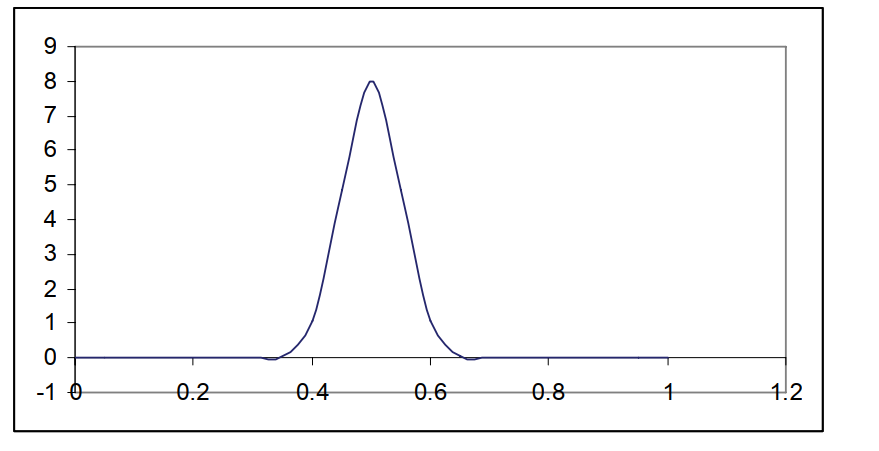
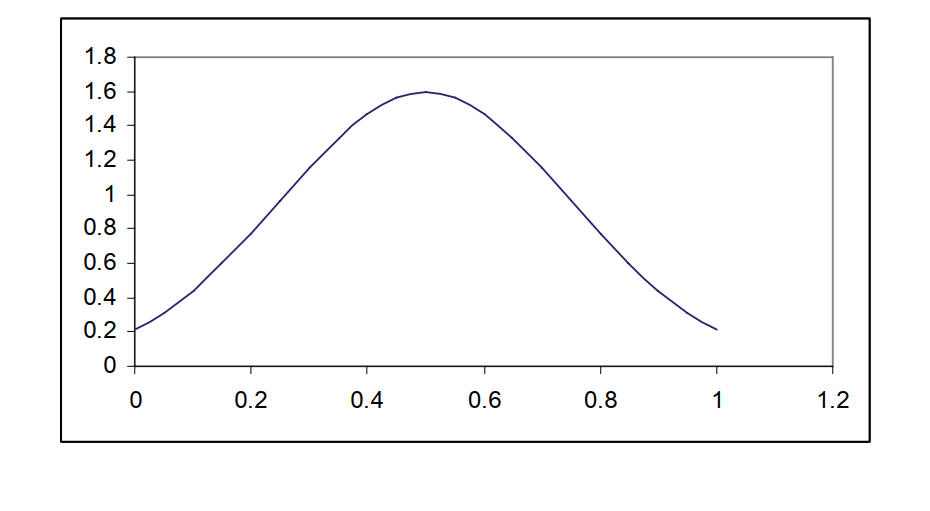
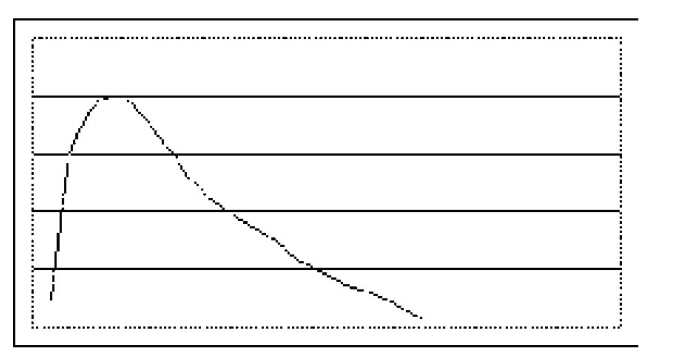
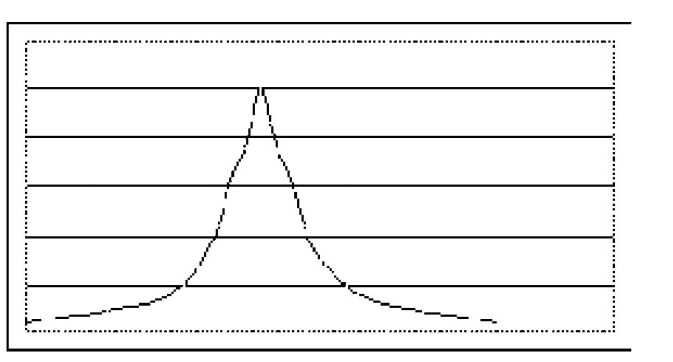
Which of the distributions has the greatest variation?
A)
B)
C)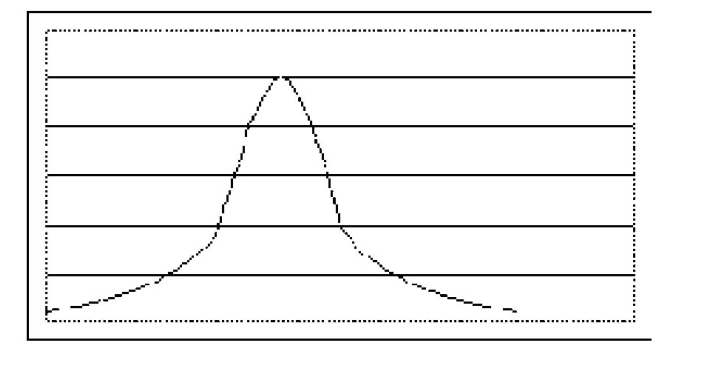
A)
B)
C)
سؤال
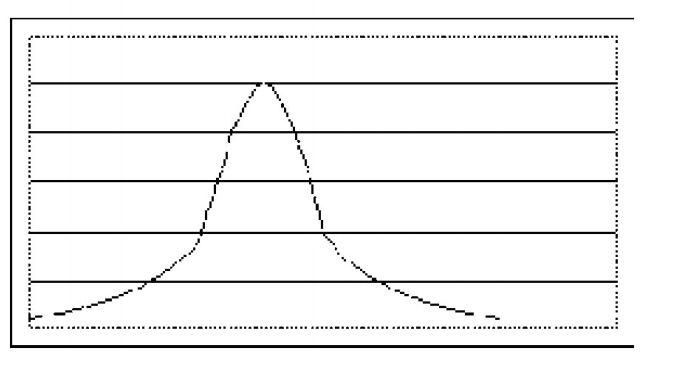
Which of the distributions is symmetric?
A)
B)
C)
D)
A)
B)
C)
D)
سؤال
سؤال
سؤال
سؤال
The blood types for 30 people who agreed to participate in a medical study were as follows. 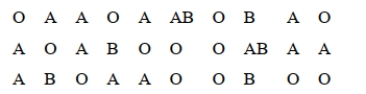 Find the mode(s) of the blood types.
Find the mode(s) of the blood types. سؤال
سؤال
Which of the distributions has the greatest variation?
A)
B)
C)
A)
B)
C)
سؤال
سؤال
The following data set is the GPAs of the students in a statistics class. 
What percentile is a GPA of 2.34?
A) About the 6th
B) About the 15th
C) About the 30th
D) About the 60th
What percentile is a GPA of 2.34?
A) About the 6th
B) About the 15th
C) About the 30th
D) About the 60th
سؤال
سؤال
سؤال
سؤال
سؤال
سؤال
Al and Joe are two county sheriff's deputies assigned to watch for traffic violations. Their
arrest and conviction records for May and June are shown below.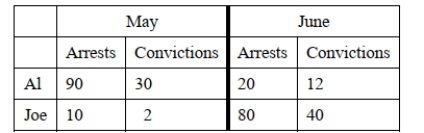 Who had the best conviction percentage in May?
Who had the best conviction percentage in June?
Who had the best conviction percentage overall?
arrest and conviction records for May and June are shown below.
Who had the best conviction percentage in May?Who had the best conviction percentage in June?
Who had the best conviction percentage overall?
سؤال
سؤال
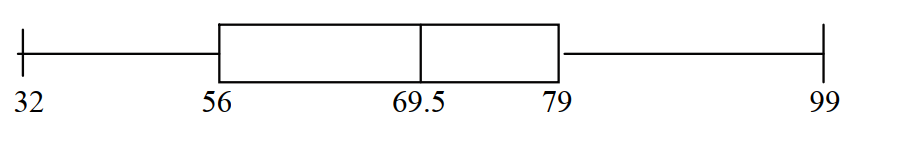
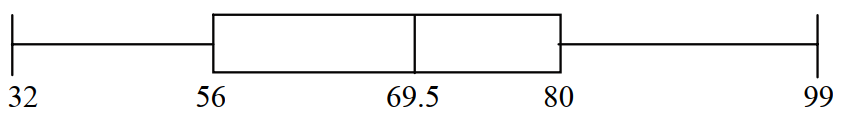
The test scores of 32 students are listed below. Construct a boxplot for the data set.
A)
B)
C)
D)
A)
B)
C)
D)
سؤال
سؤال
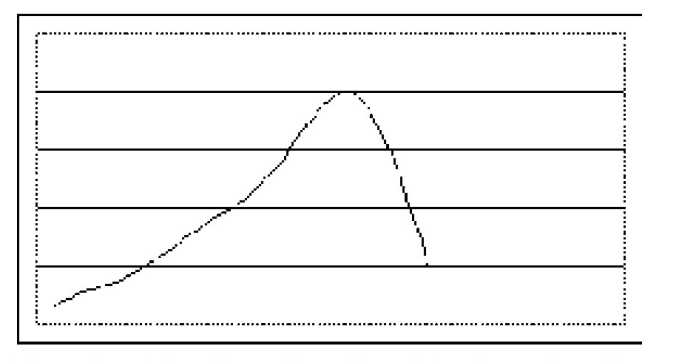
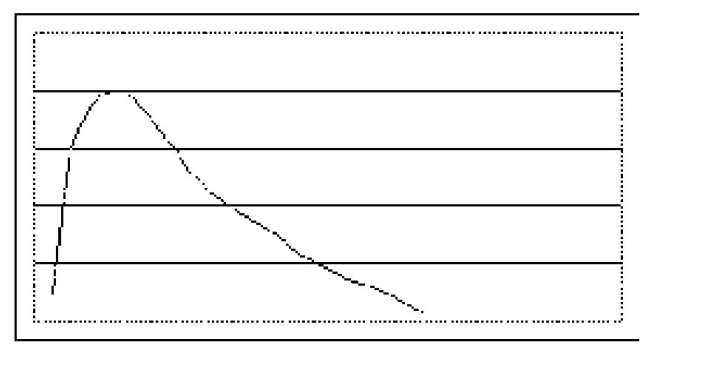
Which of the distributions is skewed to the right?
A)
B)
C)
A)
B)
C)
سؤال
سؤال
سؤال
سؤال
سؤال
سؤال
سؤال
سؤال
سؤال
سؤال
Which of the distributions is skewed to the right?
A)
B)
C)
A)
B)
C)
سؤال
Which one of the distributions shown below is left skewed?
A)
B)
C)
A)
B)
C)
سؤال
Which one of distributions shown below has the least variation?
A)
B)
C)
A)
B)
C)
سؤال
سؤال
سؤال
سؤال
The test scores of 40 students are listed below. Construct a boxplot for the data set.
A)
B)
C)
D)
A)
B)
C)
D)
سؤال
سؤال
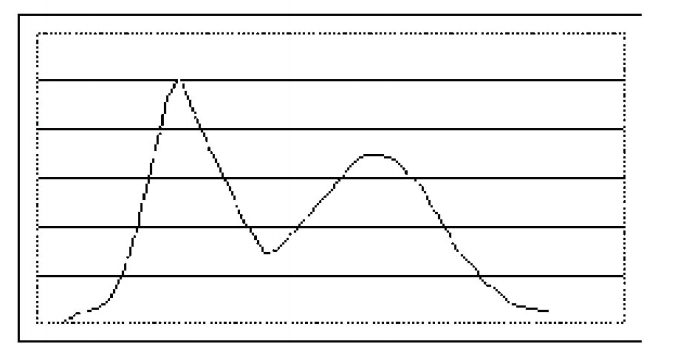
Which of the distributions is multimodal?
A)
B)
C)
A)
B)
C)
سؤال
سؤال
سؤال
سؤال
سؤال
سؤال
سؤال
سؤال
سؤال
سؤال
سؤال
سؤال

فتح الحزمة
قم بالتسجيل لفتح البطاقات في هذه المجموعة!
Unlock Deck
Unlock Deck
1/64
العب
ملء الشاشة (f)
Deck 4: Describing Data
1
Find the mode(s) for the given sample data.
20, 49, 46, 43, 49, 43, 49, 20, 22
20, 49, 46, 43, 49, 43, 49, 20, 22
49
2
Use the range rule of thumb to approximate the standard deviation. 15, 42, 63, 7, 9, 12, 14, 28, 47
A) 8.0
B) 29.1
C) 15.8
D) 14.0
A) 8.0
B) 29.1
C) 15.8
D) 14.0
D
3
Last year, a road construction firm hired 11 new employees. Their ages at hiring are listed below. Find the mean hiring age to one decimal place.
29.0
4
The number of vehicles passing through a pharmacy drive-up line with two windows during each 15-minute period was recorded. The results are shown below. Find the median number of vehicles going through the line in a fifteen-minute period.
فتح الحزمة
افتح القفل للوصول البطاقات البالغ عددها 64 في هذه المجموعة.
فتح الحزمة
k this deck
5
Al and Joe are two county sheriff's deputies assigned to watch for traffic violations. Their arrest and conviction records for May and June are shown below. Who had the best conviction percentage in May?
Who had the best conviction percentage in June?
Who had the best conviction percentage overall?
Who had the best conviction percentage in June?
Who had the best conviction percentage overall?
فتح الحزمة
افتح القفل للوصول البطاقات البالغ عددها 64 في هذه المجموعة.
فتح الحزمة
k this deck
6
The salaries of ten randomly selected doctors are shown below.
Find the median salary.
Find the median salary.
فتح الحزمة
افتح القفل للوصول البطاقات البالغ عددها 64 في هذه المجموعة.
فتح الحزمة
k this deck
7
The weights (in pounds) of 30 newborn babies are listed below. Construct a boxplot for the data set.
A)
B)
C)
D)
A)
B)
C)
D)
فتح الحزمة
افتح القفل للوصول البطاقات البالغ عددها 64 في هذه المجموعة.
فتح الحزمة
k this deck
8
Suppose that there are 400 students in your school class. What class rank is the 20th percentile?
A) 80
B) 40
C) 20
D) None of the above
A) 80
B) 40
C) 20
D) None of the above
فتح الحزمة
افتح القفل للوصول البطاقات البالغ عددها 64 في هذه المجموعة.
فتح الحزمة
k this deck
9
The distances traveled (in miles) to 8 different swim meets are given below:
73, 24, 46, 34, 61, 10, 86, 52
Find the median distance traveled.
73, 24, 46, 34, 61, 10, 86, 52
Find the median distance traveled.
فتح الحزمة
افتح القفل للوصول البطاقات البالغ عددها 64 في هذه المجموعة.
فتح الحزمة
k this deck
10
The weights (in ounces) of 21 cookies are shown. Find the median weight.
فتح الحزمة
افتح القفل للوصول البطاقات البالغ عددها 64 في هذه المجموعة.
فتح الحزمة
k this deck
11
The federal government requires a car manufacturer to have a minimum miles per gallon (mpg) average over the cars it makes. Suppose that the models and mpg's for a manufacturer are Corsair (31 mpg), Futura (30 mpg), Retro (37 mpg), and Envy (44 mpg). Twenty percent of the cars sold are Corsairs, 30% are Futuras, 40% are Retros, and 10% are Envys. Find the average mpg for this manufacturer.
A) 35.5 mpg
B) 34.0 mpg
C) 34.4 mpg
D) None of the above
A) 35.5 mpg
B) 34.0 mpg
C) 34.4 mpg
D) None of the above
فتح الحزمة
افتح القفل للوصول البطاقات البالغ عددها 64 في هذه المجموعة.
فتح الحزمة
k this deck
12
The federal government requires a car manufacturer to have a minimum miles per gallon (mpg) average over the models it makes. Suppose that the mpg's for the five models of a manufacturer are 19, 21, 22, 28, and 18, and the government requirement is 27 mpg. The last of the models is to be redesigned to meet the government requirement. What must the new mpg of this model be to meet the requirement?
A) 27 mpg
B) 29 mpg
C) 30 mpg
D) 54 mpg
A) 27 mpg
B) 29 mpg
C) 30 mpg
D) 54 mpg
فتح الحزمة
افتح القفل للوصول البطاقات البالغ عددها 64 في هذه المجموعة.
فتح الحزمة
k this deck
13
Consider the distribution of weights of all the Juniors at Bloomington High School. How many peaks would you expect in the graph of the distribution?
A) 3
B) 0
C) 2
D) 1
A) 3
B) 0
C) 2
D) 1
فتح الحزمة
افتح القفل للوصول البطاقات البالغ عددها 64 في هذه المجموعة.
فتح الحزمة
k this deck
14
Find the mode(s) for the given sample data.
7.29, 7.41, 7.56, 7.29, 7.88, 7.99, 7.62
A) 7.56
B) 7.29
C) 7.577
D) 7.41
7.29, 7.41, 7.56, 7.29, 7.88, 7.99, 7.62
A) 7.56
B) 7.29
C) 7.577
D) 7.41
فتح الحزمة
افتح القفل للوصول البطاقات البالغ عددها 64 في هذه المجموعة.
فتح الحزمة
k this deck
15
Which of the distributions has the greatest variation?
A)
B)
C)
A)
B)
C)
فتح الحزمة
افتح القفل للوصول البطاقات البالغ عددها 64 في هذه المجموعة.
فتح الحزمة
k this deck
16
Which of the distributions is symmetric?
A)
B)
C)
D)
A)
B)
C)
D)
فتح الحزمة
افتح القفل للوصول البطاقات البالغ عددها 64 في هذه المجموعة.
فتح الحزمة
k this deck
17
Find the standard deviation for the given data. Round your answer to one more decimal place than the original data.
2, 6, 15, 9, 11, 22, 1, 4, 8, 19
A) 2.1
B) 6.3
C) 6.8
D) 7.1
2, 6, 15, 9, 11, 22, 1, 4, 8, 19
A) 2.1
B) 6.3
C) 6.8
D) 7.1
فتح الحزمة
افتح القفل للوصول البطاقات البالغ عددها 64 في هذه المجموعة.
فتح الحزمة
k this deck
18
The students in Hugh Logan's math class took the Scholastic Aptitude Test. Their math scores are shown below. Find the mean score.
فتح الحزمة
افتح القفل للوصول البطاقات البالغ عددها 64 في هذه المجموعة.
فتح الحزمة
k this deck
19
The mathematics SAT scores of the seven students in a mathematics seminar are 533, 553, 578, 586, 619, 626, and 633. Suppose that the student with the score 533 drops the seminar and is replaced by a student with a score of 765. What will happen to the mean and the median scores of the class?
A) The mean will increase; the median will be unchanged.
B) The median will increase; the mean will be unchanged.
C) Neither the mean nor the median will change.
D) Both the median and the mean will increase.
A) The mean will increase; the median will be unchanged.
B) The median will increase; the mean will be unchanged.
C) Neither the mean nor the median will change.
D) Both the median and the mean will increase.
فتح الحزمة
افتح القفل للوصول البطاقات البالغ عددها 64 في هذه المجموعة.
فتح الحزمة
k this deck
20
The blood types for 30 people who agreed to participate in a medical study were as follows. Find the mode(s) of the blood types.
Find the mode(s) of the blood types. فتح الحزمة
افتح القفل للوصول البطاقات البالغ عددها 64 في هذه المجموعة.
فتح الحزمة
k this deck
21
Use the range rule of thumb to approximate the standard deviation. 22, 29, 21, 24, 27, 28, 25, 38
A) 3.50
B) 4.0
C) 4.25
D) 2.8
A) 3.50
B) 4.0
C) 4.25
D) 2.8
فتح الحزمة
افتح القفل للوصول البطاقات البالغ عددها 64 في هذه المجموعة.
فتح الحزمة
k this deck
22
Which of the distributions has the greatest variation?
A)
B)
C)
A)
B)
C)
فتح الحزمة
افتح القفل للوصول البطاقات البالغ عددها 64 في هذه المجموعة.
فتح الحزمة
k this deck
23
The mathematics SAT scores of the seven students in a mathematics seminar are 533, 553, 578, 586, 619, 626, and 633. Suppose that the student with the score 533 drops the seminar and is replaced by a student with a score of 585. What will happen to the mean and the median scores of the class?
A) Neither the mean nor the median will change.
B) Both the median and the mean will increase.
C) The median will increase; the mean will be unchanged.
D) The mean will increase; the median will be unchanged.
A) Neither the mean nor the median will change.
B) Both the median and the mean will increase.
C) The median will increase; the mean will be unchanged.
D) The mean will increase; the median will be unchanged.
فتح الحزمة
افتح القفل للوصول البطاقات البالغ عددها 64 في هذه المجموعة.
فتح الحزمة
k this deck
24
The following data set is the GPAs of the students in a statistics class.
What percentile is a GPA of 2.34?
A) About the 6th
B) About the 15th
C) About the 30th
D) About the 60th
What percentile is a GPA of 2.34?
A) About the 6th
B) About the 15th
C) About the 30th
D) About the 60th
فتح الحزمة
افتح القفل للوصول البطاقات البالغ عددها 64 في هذه المجموعة.
فتح الحزمة
k this deck
25
A softball player has a batting average of exactly .300 and no more than 60 times at bat. Suppose this player gets 5 hits in her next 6 times at bat. What is the highest possible average she could now have?
A) .500
B) .833
C) .348
D) There is insufficient information to answer the question.
A) .500
B) .833
C) .348
D) There is insufficient information to answer the question.
فتح الحزمة
افتح القفل للوصول البطاقات البالغ عددها 64 في هذه المجموعة.
فتح الحزمة
k this deck
26
The batting averages of the first three batters in the Eureka College women's softball team lineup are .310, .301, and .277. If the first three batters are considered as the "lead-off group", What is the batting average of the group?
A) .301
B) .296
C) There is insufficient information to answer the question.
D) None of the above
A) .301
B) .296
C) There is insufficient information to answer the question.
D) None of the above
فتح الحزمة
افتح القفل للوصول البطاقات البالغ عددها 64 في هذه المجموعة.
فتح الحزمة
k this deck
27
The grocery expenses for six families were $80.86, $47.74, $57.92, $81.08, $75.18, and $88.08. Compute the mean grocery bill. Round your answer to the nearest cent.
فتح الحزمة
افتح القفل للوصول البطاقات البالغ عددها 64 في هذه المجموعة.
فتح الحزمة
k this deck
28
The federal government requires a car manufacturer to have a minimum miles per gallon (mpg) average over the models it makes. Suppose that the mpg's for four of the five models of a manufacturer are 19, 22, 28, and 26, and the manufacturer just meets the government standard of 31 mpg. Find the mileage for the fifth model.
A) 60 mpg
B) 31 mpg
C) 24 mpg
D) 19 mpg
A) 60 mpg
B) 31 mpg
C) 24 mpg
D) 19 mpg
فتح الحزمة
افتح القفل للوصول البطاقات البالغ عددها 64 في هذه المجموعة.
فتح الحزمة
k this deck
29
Find the standard deviation for the given data. Round your answer to one more decimal place than the original data.
15, 42, 53, 7, 9, 12, 14, 28, 47
A) 29.1
B) 16.6
C) 17.8
D) 15.8
15, 42, 53, 7, 9, 12, 14, 28, 47
A) 29.1
B) 16.6
C) 17.8
D) 15.8
فتح الحزمة
افتح القفل للوصول البطاقات البالغ عددها 64 في هذه المجموعة.
فتح الحزمة
k this deck
30
Al and Joe are two county sheriff's deputies assigned to watch for traffic violations. Their
arrest and conviction records for May and June are shown below. Who had the best conviction percentage in May?
Who had the best conviction percentage in June?
Who had the best conviction percentage overall?
arrest and conviction records for May and June are shown below.
Who had the best conviction percentage in May?Who had the best conviction percentage in June?
Who had the best conviction percentage overall?
فتح الحزمة
افتح القفل للوصول البطاقات البالغ عددها 64 في هذه المجموعة.
فتح الحزمة
k this deck
31
The table shows the country represented by the winner of the 10,000 meter run in the Summer Olympic Games in various years.
Find the mode of the country data.
Find the mode of the country data.
فتح الحزمة
افتح القفل للوصول البطاقات البالغ عددها 64 في هذه المجموعة.
فتح الحزمة
k this deck
32
The test scores of 32 students are listed below. Construct a boxplot for the data set.
A)
B)
C)
D)
A)
B)
C)
D)
فتح الحزمة
افتح القفل للوصول البطاقات البالغ عددها 64 في هذه المجموعة.
فتح الحزمة
k this deck
33
The federal government requires a car manufacturer to have a minimum miles per gallon (mpg) average over the models it makes. Suppose that the average mpg for the four models manufactured is 24 mpg and the government standard is 31 mpg. The manufacturer will add a model. What mileage must the new model get so that the manufacturer meets the government
Requirement?
A) 32 mpg
B) 38 mpg
C)59 mpg
D) None of the above
Requirement?
A) 32 mpg
B) 38 mpg
C)59 mpg
D) None of the above
فتح الحزمة
افتح القفل للوصول البطاقات البالغ عددها 64 في هذه المجموعة.
فتح الحزمة
k this deck
34
Which of the distributions is skewed to the right?
A)
B)
C)
A)
B)
C)
فتح الحزمة
افتح القفل للوصول البطاقات البالغ عددها 64 في هذه المجموعة.
فتح الحزمة
k this deck
35
Consider the distribution of heights of all the players in the national Basketball Association. What would you expect the shape of the distribution to be?
A) Skewed right
B) Skewed left
C) Symmetric
A) Skewed right
B) Skewed left
C) Symmetric
فتح الحزمة
افتح القفل للوصول البطاقات البالغ عددها 64 في هذه المجموعة.
فتح الحزمة
k this deck
36
The normal monthly precipitation (in inches) for August is listed for 20 different U.S. cities. Find the median of the data.
فتح الحزمة
افتح القفل للوصول البطاقات البالغ عددها 64 في هذه المجموعة.
فتح الحزمة
k this deck
37
The mathematics SAT scores of the seven students in a mathematics seminar are 538, 550, 570, 593, 610, 622, and 634. Suppose the student with the score 634 drops the seminar and is replaced by a student with a score of 600. What will happen to the mean and the median scores of the class?
A) Neither mean nor median will change.
B) The median will decrease, the mean will not change.
C) The median will not change, the mean will decrease.
D) Both mean and median will decrease.
A) Neither mean nor median will change.
B) The median will decrease, the mean will not change.
C) The median will not change, the mean will decrease.
D) Both mean and median will decrease.
فتح الحزمة
افتح القفل للوصول البطاقات البالغ عددها 64 في هذه المجموعة.
فتح الحزمة
k this deck
38
Find the mode(s) for the given sample data.
66, 25, 66, 13, 25, 29, 56, 66
66, 25, 66, 13, 25, 29, 56, 66
فتح الحزمة
افتح القفل للوصول البطاقات البالغ عددها 64 في هذه المجموعة.
فتح الحزمة
k this deck
39
The host of a dinner party purchases wine based on the weighted average of clarity (10%), bouquet (5%), friendliness to the palate (5%), storage ability of opened bottles (40%), and price (40%). Suppose that Bone Ranch Wave has scores in these categories of 4, 5, 3, 8, and 9, respectively. What is its rating?
A) 5.80
B) 5.00
C) 7.60
D) None of the previous
A) 5.80
B) 5.00
C) 7.60
D) None of the previous
فتح الحزمة
افتح القفل للوصول البطاقات البالغ عددها 64 في هذه المجموعة.
فتح الحزمة
k this deck
40
A store manager kept track of the number of newspapers sold each week over a seven-week period. The results are shown below.
88, 84, 209, 151, 271, 242, 234
Find the median number of newspapers sold.
88, 84, 209, 151, 271, 242, 234
Find the median number of newspapers sold.
فتح الحزمة
افتح القفل للوصول البطاقات البالغ عددها 64 في هذه المجموعة.
فتح الحزمة
k this deck
41
Find the standard deviation for the given data. Round your answer to one more decimal place than the original data.
22, 29, 21, 24, 27, 28, 25, 36
A) 4.8
B) 4.2
C) 2.8
D) 1.6
22, 29, 21, 24, 27, 28, 25, 36
A) 4.8
B) 4.2
C) 2.8
D) 1.6
فتح الحزمة
افتح القفل للوصول البطاقات البالغ عددها 64 في هذه المجموعة.
فتح الحزمة
k this deck
42
Six football players, all defensive linemen, decide that they will gain an average of 10 pounds over the summer. At the start of the season, only five showed up for the weigh-in. They had gained 9, 13, 11, 6, and 7 pounds. How many pounds does the last person have to gain in order that the group can attain its goal?
فتح الحزمة
افتح القفل للوصول البطاقات البالغ عددها 64 في هذه المجموعة.
فتح الحزمة
k this deck
43
In a basketball player's first three seasons in the NBA, his field goal percentage is .340, .450, and .480. In those three seasons, the number of field goals he attempted was 80, 400, and 520 respectively. What is his career field goal percentage after three years?
فتح الحزمة
افتح القفل للوصول البطاقات البالغ عددها 64 في هذه المجموعة.
فتح الحزمة
k this deck
44
Which of the distributions is skewed to the right?
A)
B)
C)
A)
B)
C)
فتح الحزمة
افتح القفل للوصول البطاقات البالغ عددها 64 في هذه المجموعة.
فتح الحزمة
k this deck
45
Which one of the distributions shown below is left skewed?
A)
B)
C)
A)
B)
C)
فتح الحزمة
افتح القفل للوصول البطاقات البالغ عددها 64 في هذه المجموعة.
فتح الحزمة
k this deck
46
Which one of distributions shown below has the least variation?
A)
B)
C)
A)
B)
C)
فتح الحزمة
افتح القفل للوصول البطاقات البالغ عددها 64 في هذه المجموعة.
فتح الحزمة
k this deck
47
Consider the distribution of mathematics SAT scores of students in honors calculus at a liberal arts college. What would you expect the shape and variation of the distribution to be?
A) Symmetric with little variation
B) Symmetric with large variation
C) Skewed right with large variation
D) Skewed left with little variation
A) Symmetric with little variation
B) Symmetric with large variation
C) Skewed right with large variation
D) Skewed left with little variation
فتح الحزمة
افتح القفل للوصول البطاقات البالغ عددها 64 في هذه المجموعة.
فتح الحزمة
k this deck
48
Alex is 80th in his class of 320 students. What is his percentile rank in class?
فتح الحزمة
افتح القفل للوصول البطاقات البالغ عددها 64 في هذه المجموعة.
فتح الحزمة
k this deck
49
Use the range rule of thumb to approximate the standard deviation. 496, 598, 503, 528, 565, 601, 576, 543
A) 170.2
B) 60.6
C) 26.25
D) 18.75
A) 170.2
B) 60.6
C) 26.25
D) 18.75
فتح الحزمة
افتح القفل للوصول البطاقات البالغ عددها 64 في هذه المجموعة.
فتح الحزمة
k this deck
50
The test scores of 40 students are listed below. Construct a boxplot for the data set.
A)
B)
C)
D)
A)
B)
C)
D)
فتح الحزمة
افتح القفل للوصول البطاقات البالغ عددها 64 في هذه المجموعة.
فتح الحزمة
k this deck
51
The number of people waiting in the cash register lines at a local supermarket were 4, 3, 5, 4, 3, 2, 3
Find the mode(s) of these data.
Find the mode(s) of these data.
فتح الحزمة
افتح القفل للوصول البطاقات البالغ عددها 64 في هذه المجموعة.
فتح الحزمة
k this deck
52
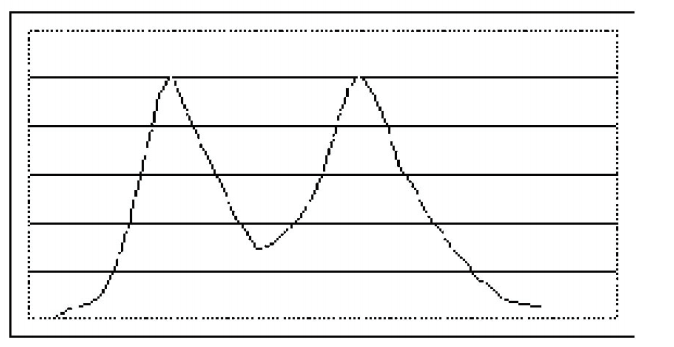
Which of the distributions is multimodal?
A)
B)
C)
A)
B)
C)
فتح الحزمة
افتح القفل للوصول البطاقات البالغ عددها 64 في هذه المجموعة.
فتح الحزمة
k this deck
53
In testing a new light bulb design, 6 bulbs were left on until they burned out or 2000 hours whichever came first. One bulb had not burned out by the end of the test, so 2000 hours was Recorded for that bulb. If the testers had waited for that bulb to burn out, what would have Happened to the mean and median lives of the bulbs?
A) Neither mean nor median would have changed.
B) Both mean and median would increase.
C) The mean would increase, but the median would not change.
D) The median would increase, but the mean would not change.
A) Neither mean nor median would have changed.
B) Both mean and median would increase.
C) The mean would increase, but the median would not change.
D) The median would increase, but the mean would not change.
فتح الحزمة
افتح القفل للوصول البطاقات البالغ عددها 64 في هذه المجموعة.
فتح الحزمة
k this deck
54
Amtrak trains from Chicago to Portland arrived at Havre, MT, where they make a crew change, the following numbers of minutes late.
26, 17, 245, 19, 38, 42, 11, 0, 14, 44
Find the mean number of minutes late at Havre (to one decimal place).
26, 17, 245, 19, 38, 42, 11, 0, 14, 44
Find the mean number of minutes late at Havre (to one decimal place).
فتح الحزمة
افتح القفل للوصول البطاقات البالغ عددها 64 في هذه المجموعة.
فتح الحزمة
k this deck
55
Randomly selected voters leaving the polls identified themselves as Republican (R), Democrat (D), or Independent (I). The data were
R R I D D D I R D D I R R D D
D D I I R I R I D D R I R D I
What is the mode of these data?
R R I D D D I R D D I R R D D
D D I I R I R I D D R I R D I
What is the mode of these data?
فتح الحزمة
افتح القفل للوصول البطاقات البالغ عددها 64 في هذه المجموعة.
فتح الحزمة
k this deck
56
Al and Joe are two county sheriff's deputies assigned to watch for traffic violations. Their arrest and conviction records for May and June are shown below.
Who had the best conviction percentage in May?
Who had the best conviction percentage in June?
Who had the best conviction percentage overall?
Who had the best conviction percentage in May?
Who had the best conviction percentage in June?
Who had the best conviction percentage overall?
فتح الحزمة
افتح القفل للوصول البطاقات البالغ عددها 64 في هذه المجموعة.
فتح الحزمة
k this deck
57
The salaries of randomly selected bank employees were
Find the median salary of these employees.
Find the median salary of these employees.
فتح الحزمة
افتح القفل للوصول البطاقات البالغ عددها 64 في هذه المجموعة.
فتح الحزمة
k this deck
58
Randomly selected high school seniors had the following numbers of one-dollar bills in their wallets.
2, 4, 3, 7, 5, 4, 5, 2, 9, 17, 0, 4, 7, 6, 8
Find the median number of one-dollar bills.
2, 4, 3, 7, 5, 4, 5, 2, 9, 17, 0, 4, 7, 6, 8
Find the median number of one-dollar bills.
فتح الحزمة
افتح القفل للوصول البطاقات البالغ عددها 64 في هذه المجموعة.
فتح الحزمة
k this deck
59
A trout hatchery had more 4 year-old fish than they could use one year, so they held about 1000 of them over until the next year. The hatchery routinely moved fish from one pond to the next each year and 10,000 three-year old fish were placed in the pond with the leftover four-year old fish. When the fish were finally taken out of the pond for releasing into streams, what would the distribution of the weights of the released fish look like? Describe the
distribution as well as you can and draw a picture.
distribution as well as you can and draw a picture.
فتح الحزمة
افتح القفل للوصول البطاقات البالغ عددها 64 في هذه المجموعة.
فتح الحزمة
k this deck
60
Suppose that your income is at the 81st percentile of wage earners in the United States. What percent of wage earners make more than you do?
A) 19%
B) 81%
C) Cannot be calculated from the information given
D) None of the above
A) 19%
B) 81%
C) Cannot be calculated from the information given
D) None of the above
فتح الحزمة
افتح القفل للوصول البطاقات البالغ عددها 64 في هذه المجموعة.
فتح الحزمة
k this deck
61
The lengths of 25 "4-inch" bolts, measured with a micrometer are (in inches)
Construct a box plot for these data.
Construct a box plot for these data.
فتح الحزمة
افتح القفل للوصول البطاقات البالغ عددها 64 في هذه المجموعة.
فتح الحزمة
k this deck
62
Use the range rule of thumb to approximate the standard deviation for the data in Problem 14 to 2 decimal places.
فتح الحزمة
افتح القفل للوصول البطاقات البالغ عددها 64 في هذه المجموعة.
فتح الحزمة
k this deck
63
The heights of 10 randomly selected fourth grade boys are (in inches) are
Find the sample standard deviation s to 2 decimal places.
Find the sample standard deviation s to 2 decimal places.
فتح الحزمة
افتح القفل للوصول البطاقات البالغ عددها 64 في هذه المجموعة.
فتح الحزمة
k this deck
64
A graduate school accepted candidates as shown in the table below.
Explain why this table is an illustration of Simpson's paradox. Compare admission rates for White vs Non-white.
Explain why this table is an illustration of Simpson's paradox. Compare admission rates for White vs Non-white.
فتح الحزمة
افتح القفل للوصول البطاقات البالغ عددها 64 في هذه المجموعة.
فتح الحزمة
k this deck
فتح الحزمة
افتح القفل للوصول البطاقات البالغ عددها 64 في هذه المجموعة.


