Deck 7: Estimates and Sample Size
ملء الشاشة (f)
سؤال
سؤال
سؤال
سؤال
سؤال
سؤال
سؤال
سؤال
سؤال
سؤال
Complete the table to compare z and t distributions. 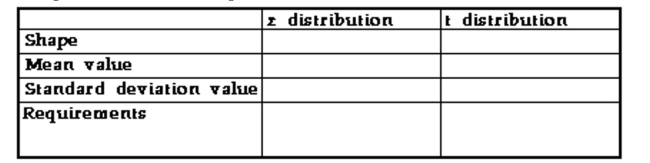
سؤال
سؤال
سؤال
سؤال
سؤال
سؤال
سؤال
سؤال
سؤال
سؤال
سؤال
سؤال
سؤال
سؤال
سؤال
سؤال
سؤال
سؤال
سؤال
سؤال
سؤال
سؤال
سؤال
سؤال
Define a point estimate. What is the best point estimate for  ?
?
? سؤال
سؤال
سؤال
سؤال
سؤال
سؤال
سؤال
سؤال
سؤال
سؤال
سؤال
سؤال
سؤال
سؤال
سؤال
سؤال
سؤال
سؤال
سؤال
سؤال
سؤال
سؤال
سؤال
سؤال
سؤال
سؤال
سؤال
سؤال
سؤال
سؤال
سؤال
سؤال
سؤال
سؤال
سؤال
سؤال
سؤال
سؤال
سؤال
سؤال
سؤال
سؤال
سؤال
سؤال
سؤال
سؤال

فتح الحزمة
قم بالتسجيل لفتح البطاقات في هذه المجموعة!
Unlock Deck
Unlock Deck
1/141
العب
ملء الشاشة (f)
Deck 7: Estimates and Sample Size
1
Bert constructed a confidence interval to estimate the mean weight of students in his class.
The population was very small - only 30. Ruth constructed a confidence interval for the mean weight of all adult males in the city. She based her confidence interval on a very small sample of only 5. Which confidence interval is likely to give a better estimate of the mean it is estimating? Which is likely to be more of a problem, a small sample or a small population?
The population was very small - only 30. Ruth constructed a confidence interval for the mean weight of all adult males in the city. She based her confidence interval on a very small sample of only 5. Which confidence interval is likely to give a better estimate of the mean it is estimating? Which is likely to be more of a problem, a small sample or a small population?
Bert's confidence interval is likely to give a better estimate. A small sample is more likely to be a problem than a small population.
2
When determining the sample size for a desired margin of error, the formula is . Based on this formula, discuss the fact that sample size is not dependent on the population size; that is, it is not necessary to sample a particular percent of the population.
As shown in the formula, the appropriate sample size is dependent on the appropriate z score, the sample proportion, and the margin of error, not on N, the population size.
3
Describe the process for finding the confidence interval for a population proportion.
1) Find the summary statistics and
2) Compute E using the z distribution and the formula
3) Find the interval by adding to and then subtracting from .
4) Interpret the interval.
2) Compute E using the z distribution and the formula
3) Find the interval by adding to and then subtracting from .
4) Interpret the interval.
4
Why would manufacturers and businesses be interested in constructing a confidence interval for the population variance? Would manufacturers and businesses want large or small variances?
فتح الحزمة
افتح القفل للوصول البطاقات البالغ عددها 141 في هذه المجموعة.
فتح الحزمة
k this deck
5
When determining the sample size needed to achieve a particular error estimate you need to know ?. What are two methods of estimating ? if ? is unknown?
فتح الحزمة
افتح القفل للوصول البطاقات البالغ عددها 141 في هذه المجموعة.
فتح الحزمة
k this deck
6
فتح الحزمة
افتح القفل للوصول البطاقات البالغ عددها 141 في هذه المجموعة.
فتح الحزمة
k this deck
7
Hannah selected a simple random sample of all adults in her town and, based on this sample, constructed a confidence interval for the mean salary of all adults in the town.
However, the distribution of salaries in the town is not exactly normal. Will the confidence interval still give a good estimate of the mean salary?
However, the distribution of salaries in the town is not exactly normal. Will the confidence interval still give a good estimate of the mean salary?
فتح الحزمة
افتح القفل للوصول البطاقات البالغ عددها 141 في هذه المجموعة.
فتح الحزمة
k this deck
8
How do you determine whether to use the z or t distribution in computing the margin of
فتح الحزمة
افتح القفل للوصول البطاقات البالغ عددها 141 في هذه المجموعة.
فتح الحزمة
k this deck
9
Describe the steps for finding a confidence interval.
فتح الحزمة
افتح القفل للوصول البطاقات البالغ عددها 141 في هذه المجموعة.
فتح الحزمة
k this deck
10
Complete the table to compare z and t distributions.
فتح الحزمة
افتح القفل للوصول البطاقات البالغ عددها 141 في هذه المجموعة.
فتح الحزمة
k this deck
11
Interpret the following 95% confidence interval for mean weekly salaries of shift managers at Guiseppe's Pizza and Pasta. 325.80 < µ < 472.30
فتح الحزمة
افتح القفل للوصول البطاقات البالغ عددها 141 في هذه المجموعة.
فتح الحزمة
k this deck
12
Under what circumstances can you replace ? with s in the formula
فتح الحزمة
افتح القفل للوصول البطاقات البالغ عددها 141 في هذه المجموعة.
فتح الحزمة
k this deck
13
A researcher is interested in estimating the proportion of voters who favor a tax on e-commerce. Based on a sample of 250 people, she obtains the following 99% confidence interval for the population proportion, Which of the statements below is a valid interpretation
Of this confidence interval?
A) If 100 different samples of size 250 were selected and, based on each sample, a confidence interval were constructed, exactly 99 of these confidence intervals would contain the true value of p.
B) If many different samples of size 250 were selected and, based on each sample, a confidence interval were constructed, 99% of the time the true value of p would lie between 0.113 and 0.171.
C) There is a 99% chance that the true value of p lies between 0.113 and 0.171.
D) If many different samples of size 250 were selected and, based on each sample, a confidence interval were constructed, in the long run 99% of the confidence intervals would contain the true value of p.
فتح الحزمة
افتح القفل للوصول البطاقات البالغ عددها 141 في هذه المجموعة.
فتح الحزمة
k this deck
14
What assumption about the parent population is needed to use the t distribution to compute the margin of error?
فتح الحزمة
افتح القفل للوصول البطاقات البالغ عددها 141 في هذه المجموعة.
فتح الحزمة
k this deck
15
Based on a simple random sample of students from her school, Sally obtained a point estimate of the mean weight of students at her school. What additional information would be provided by a confidence interval estimate of the mean weight?
فتح الحزمة
افتح القفل للوصول البطاقات البالغ عددها 141 في هذه المجموعة.
فتح الحزمة
k this deck
16
What is the best point estimate for the population proportion? Explain why that point estimate is best.
فتح الحزمة
افتح القفل للوصول البطاقات البالغ عددها 141 في هذه المجموعة.
فتح الحزمة
k this deck
17
Explain how confidence intervals might be used to make decisions. Give an example to clarify your explanation.
فتح الحزمة
افتح القفل للوصول البطاقات البالغ عددها 141 في هذه المجموعة.
فتح الحزمة
k this deck
18
When determining sample size we need to know . If we have no prior information, what are two methods that can be used?
فتح الحزمة
افتح القفل للوصول البطاقات البالغ عددها 141 في هذه المجموعة.
فتح الحزمة
k this deck
19
فتح الحزمة
افتح القفل للوصول البطاقات البالغ عددها 141 في هذه المجموعة.
فتح الحزمة
k this deck
20
Explain the difference between descriptive and inferential statistics.
فتح الحزمة
افتح القفل للوصول البطاقات البالغ عددها 141 في هذه المجموعة.
فتح الحزمة
k this deck
21
50 people are selected randomly from a certain population and it is found that 18 people in the sample are over 6 feet tall. What is the point estimate of the proportion of people in the population who are over 6 feet tall?
A) 0.50
B) 0.36
C) 0.64
D) 0.23
A) 0.50
B) 0.36
C) 0.64
D) 0.23
فتح الحزمة
افتح القفل للوصول البطاقات البالغ عددها 141 في هذه المجموعة.
فتح الحزمة
k this deck
22
A confidence interval (in inches) for the mean height of a population is . This result is based on a sample of size 144 . Construct the confidence interval. (Hint: you will first need to find the sample mean and sample standard deviation).
A) in in.
B) in in.
C) in in.
D) in .
A) in in.
B) in in.
C) in in.
D) in .
فتح الحزمة
افتح القفل للوصول البطاقات البالغ عددها 141 في هذه المجموعة.
فتح الحزمة
k this deck
23
Use the given degree of confidence and sample data to construct a confidence interval for the population mean µ. Assume that the population has a normal distribution.
-A sociologist develops a test to measure attitudes towards public transportation, and 27 randomly selected subjects are given the test. Their mean score is 76.2 and their standard deviation is 21.4.
Construct the 95% confidence interval for the mean score of all such subjects.
A)
B)
C)
D)
-A sociologist develops a test to measure attitudes towards public transportation, and 27 randomly selected subjects are given the test. Their mean score is 76.2 and their standard deviation is 21.4.
Construct the 95% confidence interval for the mean score of all such subjects.
A)
B)
C)
D)
فتح الحزمة
افتح القفل للوصول البطاقات البالغ عددها 141 في هذه المجموعة.
فتح الحزمة
k this deck
24
Use the confidence level and sample data to find a confidence interval for estimating the population µ. Round your answer to the same number of decimal places as the sample mean.
-Test scores: confidence
A)
B)
C)
D)
-Test scores: confidence
A)
B)
C)
D)
فتح الحزمة
افتح القفل للوصول البطاقات البالغ عددها 141 في هذه المجموعة.
فتح الحزمة
k this deck
25
The Bide-a-While efficiency hotel, which caters to business workers who stay for extended periods of time (weeks or months), offers room service. In a small study of 35 randomly selected room service orders, the 95% confidence interval for mean delivery time for room service is minutes. The marketing director is trying to determine if she can advertise "room service in under 30 minutes, or the order is free." How would you advise her?
فتح الحزمة
افتح القفل للوصول البطاقات البالغ عددها 141 في هذه المجموعة.
فتح الحزمة
k this deck
26
Use the confidence level and sample data to find a confidence interval for estimating the population µ. Round your answer to the same number of decimal places as the sample mean.
-A group of 64 randomly selected students have a mean score of with a standard deviation of on a placement test. What is the confidence interval for the mean score, , of all students taking the test?
A)
B)
C)
D)
-A group of 64 randomly selected students have a mean score of with a standard deviation of on a placement test. What is the confidence interval for the mean score, , of all students taking the test?
A)
B)
C)
D)
فتح الحزمة
افتح القفل للوصول البطاقات البالغ عددها 141 في هذه المجموعة.
فتح الحزمة
k this deck
27
Under what three conditions is it appropriate to use the t distribution in place of the standard normal distribution?
فتح الحزمة
افتح القفل للوصول البطاقات البالغ عددها 141 في هذه المجموعة.
فتح الحزمة
k this deck
28
Use the given data to find the minimum sample size required to estimate the population proportion.
-Margin of error: 0.018; confidence level:
A) 4966
B) 4114
C) 7116
D) 5117
-Margin of error: 0.018; confidence level:
A) 4966
B) 4114
C) 7116
D) 5117
فتح الحزمة
افتح القفل للوصول البطاقات البالغ عددها 141 في هذه المجموعة.
فتح الحزمة
k this deck
29
Use the given degree of confidence and sample data to construct a confidence interval for the population proportion p.
- confidence
A)
B)
C)
D)
- confidence
A)
B)
C)
D)
فتح الحزمة
افتح القفل للوصول البطاقات البالغ عددها 141 في هذه المجموعة.
فتح الحزمة
k this deck
30
In constructing a confidence interval for or , a table is used to find the critical values and for values of . For larger values of and can be approximated by using the following formula: where is the number of degrees of freedom and is the critical z score. Construct the confidence interval for using the following sample data: a sample of size yields a mean weight of and a standard deviation of . Round the confidence interval limits to the nearest hundredth.
A)
B)
C)
D)
A)
B)
C)
D)
فتح الحزمة
افتح القفل للوصول البطاقات البالغ عددها 141 في هذه المجموعة.
فتح الحزمة
k this deck
31
A radio show host asked people to call in and say whether they support new legislation to promote cleaner sources of energy. Based on this sample, she constructed a confidence interval to estimate the proportion of all listeners to her show who support the legislation.
Is the confidence interval likely to give a good estimate of the proportion of her listeners who support the legislation?
Is the confidence interval likely to give a good estimate of the proportion of her listeners who support the legislation?
فتح الحزمة
افتح القفل للوصول البطاقات البالغ عددها 141 في هذه المجموعة.
فتح الحزمة
k this deck
32
A paper published the results of a poll. It stated that, based on a sample of 1000 married men, 51% of married men say that they would marry the same woman again. The margin of error was given as ±3 percentage points and the confidence level was given as 95%.
What does it mean that the margin of error was ±3 percentage points?
What does it mean that the margin of error was ±3 percentage points?
فتح الحزمة
افتح القفل للوصول البطاقات البالغ عددها 141 في هذه المجموعة.
فتح الحزمة
k this deck
33
Use the given data to find the minimum sample size required to estimate the population proportion.
-Margin of error: 0.008; confidence level: 99%; from a prior study, is estimated by 0.208.
A) 9889
B) 15,361
C) 137
D) 17,068
-Margin of error: 0.008; confidence level: 99%; from a prior study, is estimated by 0.208.
A) 9889
B) 15,361
C) 137
D) 17,068
فتح الحزمة
افتح القفل للوصول البطاقات البالغ عددها 141 في هذه المجموعة.
فتح الحزمة
k this deck
34
Define a point estimate. What is the best point estimate for ?
? فتح الحزمة
افتح القفل للوصول البطاقات البالغ عددها 141 في هذه المجموعة.
فتح الحزمة
k this deck
35
Mark wanted to estimate the mean number of years of education of adults in his city. He waited outside a public library and interviewed every tenth adult leaving. Based on this sample, he constructed a confidence interval for the mean number of years of education of adults in the city. Do you think this confidence interval will give a good estimate? Why or why not?
فتح الحزمة
افتح القفل للوصول البطاقات البالغ عددها 141 في هذه المجموعة.
فتح الحزمة
k this deck
36
Draw a diagram of the chi-square distribution. Discuss its shape and values.
فتح الحزمة
افتح القفل للوصول البطاقات البالغ عددها 141 في هذه المجموعة.
فتح الحزمة
k this deck
37
Define confidence interval and degree of confidence. Make up an example of a confidence interval and interpret the result.
فتح الحزمة
افتح القفل للوصول البطاقات البالغ عددها 141 في هذه المجموعة.
فتح الحزمة
k this deck
38
Of 366 randomly selected medical students, 27 said that they planned to work in a rural community. Find a 95% confidence interval for the true proportion of all medical students who plan to work in a rural community.
A)
B)
C)
D)
A)
B)
C)
D)
فتح الحزمة
افتح القفل للوصول البطاقات البالغ عددها 141 في هذه المجموعة.
فتح الحزمة
k this deck
39
Use the given data to find the minimum sample size required to estimate the population proportion.
-Margin of error: ; confidence level: and unknown
A) 2223
B) 1116
C) 2115
D) 1939
-Margin of error: ; confidence level: and unknown
A) 2223
B) 1116
C) 2115
D) 1939
فتح الحزمة
افتح القفل للوصول البطاقات البالغ عددها 141 في هذه المجموعة.
فتح الحزمة
k this deck
40
Identify the correct distribution (z, t, or neither) for each of the following.
فتح الحزمة
افتح القفل للوصول البطاقات البالغ عددها 141 في هذه المجموعة.
فتح الحزمة
k this deck
41
Assume that a sample is used to estimate a population proportion p. Find the margin of error E that corresponds to the given statistics and confidence level. Round the margin of error to four decimal places.
-
A) 0.0386
B) 0.0368
C) 0.0331
D) 0.0309
-
A) 0.0386
B) 0.0368
C) 0.0331
D) 0.0309
فتح الحزمة
افتح القفل للوصول البطاقات البالغ عددها 141 في هذه المجموعة.
فتح الحزمة
k this deck
42
A newspaper article about the results of a poll states: "In theory, the results of such a poll, in 99 cases out of 100 should differ by no more than 2 percentage points in either direction from what would have been obtained by interviewing all voters in the United States." Find the sample size suggested by this statement.
A) 2402
B) 4145
C) 165
D) 3394
A) 2402
B) 4145
C) 165
D) 3394
فتح الحزمة
افتح القفل للوصول البطاقات البالغ عددها 141 في هذه المجموعة.
فتح الحزمة
k this deck
43
Do one of the following, as appropriate: (a) Find the critical value z?/2, (b) find the critical value t?/2, (c) state that neither the normal nor the t distribution applies.
- is unknown; population appears to be normally distributed.
A)
B)
C)
D)
- is unknown; population appears to be normally distributed.
A)
B)
C)
D)
فتح الحزمة
افتح القفل للوصول البطاقات البالغ عددها 141 في هذه المجموعة.
فتح الحزمة
k this deck
44
In a clinical test with 8900 subjects, 4450 showed improvement from the treatment. Find the margin of error for the 99% confidence interval used to estimate the population proportion.
A) 0.00780
B) 0.0137
C) 0.0120
D) 0.0104
A) 0.00780
B) 0.0137
C) 0.0120
D) 0.0104
فتح الحزمة
افتح القفل للوصول البطاقات البالغ عددها 141 في هذه المجموعة.
فتح الحزمة
k this deck
45
Use the given information to find the minimum sample size required to estimate an unknown population mean µ.
-
A) 71
B) 62
C) 50
D) 100
-
A) 71
B) 62
C) 50
D) 100
فتح الحزمة
افتح القفل للوصول البطاقات البالغ عددها 141 في هذه المجموعة.
فتح الحزمة
k this deck
46
Use the given data to find the minimum sample size required to estimate the population proportion.
-
A) 25,901
B) 15,900
C) 26,024
D) 25,894
-
A) 25,901
B) 15,900
C) 26,024
D) 25,894
فتح الحزمة
افتح القفل للوصول البطاقات البالغ عددها 141 في هذه المجموعة.
فتح الحزمة
k this deck
47
Use the given degree of confidence and sample data to find a confidence interval for the population standard deviation ?.
Assume that the population has a normal distribution. Round the confidence interval limits to the same number of decimal places as the sample standard deviation.
-Weights of men: confidence;
A)
B)
C)
D)
Assume that the population has a normal distribution. Round the confidence interval limits to the same number of decimal places as the sample standard deviation.
-Weights of men: confidence;
A)
B)
C)
D)
فتح الحزمة
افتح القفل للوصول البطاقات البالغ عددها 141 في هذه المجموعة.
فتح الحزمة
k this deck
48
Use the given degree of confidence and sample data to construct a confidence interval for the population mean µ. Assume that the population has a normal distribution.
-The principal randomly selected six students to take an aptitude test. Their scores were:
Determine a confidence interval for the mean score for all students.
A)
B)
C)
D)
-The principal randomly selected six students to take an aptitude test. Their scores were:
Determine a confidence interval for the mean score for all students.
A)
B)
C)
D)
فتح الحزمة
افتح القفل للوصول البطاقات البالغ عددها 141 في هذه المجموعة.
فتح الحزمة
k this deck
49
Solve the problem. Round the point estimate to the nearest thousandth.
364 randomly selected light bulbs were tested in a laboratory, 124 lasted more than 500 hours. Find a point estimate of the proportion of all light bulbs that last more than 500 hours.
A) 0.254
B) 0.659
C) 0.338
D) 0.341
364 randomly selected light bulbs were tested in a laboratory, 124 lasted more than 500 hours. Find a point estimate of the proportion of all light bulbs that last more than 500 hours.
A) 0.254
B) 0.659
C) 0.338
D) 0.341
فتح الحزمة
افتح القفل للوصول البطاقات البالغ عددها 141 في هذه المجموعة.
فتح الحزمة
k this deck
50
Use the given degree of confidence and sample data to find a confidence interval for the population standard deviation ?.
Assume that the population has a normal distribution. Round the confidence interval limits to one more decimal place than is used for the original set of data.
-The football coach randomly selected ten players and timed how long each player took to perform a certain drill. The times (in minutes) were:
Find a confidence interval for the population standard deviation .
A)
B)
C)
D)
فتح الحزمة
افتح القفل للوصول البطاقات البالغ عددها 141 في هذه المجموعة.
فتح الحزمة
k this deck
51
Use the given data to find the minimum sample size required to estimate the population proportion.
-Margin of error: ; confidence level: ; from a prior study, is estimated by the decima equivalent of .
A) 5
B) 48
C) 54
D) 162
-Margin of error: ; confidence level: ; from a prior study, is estimated by the decima equivalent of .
A) 5
B) 48
C) 54
D) 162
فتح الحزمة
افتح القفل للوصول البطاقات البالغ عددها 141 في هذه المجموعة.
فتح الحزمة
k this deck
52
Find the critical value corresponding to a sample size of 19 and a confidence level of 99 percent.
A)
B)
C)
D)
A)
B)
C)
D)
فتح الحزمة
افتح القفل للوصول البطاقات البالغ عددها 141 في هذه المجموعة.
فتح الحزمة
k this deck
53
Use the given information to find the minimum sample size required to estimate an unknown population mean µ.
-How many students must be randomly selected to estimate the mean weekly earnings of students at one college? We want 95% confidence that the sample mean is within $2 of the population mean, and the population standard deviation is known to be $10.
A) 136
B) 97
C) 68
D) 85
-How many students must be randomly selected to estimate the mean weekly earnings of students at one college? We want 95% confidence that the sample mean is within $2 of the population mean, and the population standard deviation is known to be $10.
A) 136
B) 97
C) 68
D) 85
فتح الحزمة
افتح القفل للوصول البطاقات البالغ عددها 141 في هذه المجموعة.
فتح الحزمة
k this deck
54
Use the given degree of confidence and sample data to construct a confidence interval for the population proportion p.
- confidence
A)
B)
C)
D)
- confidence
A)
B)
C)
D)
فتح الحزمة
افتح القفل للوصول البطاقات البالغ عددها 141 في هذه المجموعة.
فتح الحزمة
k this deck
55
Use the given information to find the minimum sample size required to estimate an unknown population mean µ.
-
A) 62
B) 123
C) 50
D) 71
-
A) 62
B) 123
C) 50
D) 71
فتح الحزمة
افتح القفل للوصول البطاقات البالغ عددها 141 في هذه المجموعة.
فتح الحزمة
k this deck
56
Use the given degree of confidence and sample data to construct a confidence interval for the population mean µ. Assume that the population has a normal distribution.
-A savings and loan association needs information concerning the checking account balances of its local customers. A random sample of 14 accounts was checked and yielded a mean balance of $664.14 and a standard deviation of $297.29. Find a 98% confidence interval for the true mean checking account balance for local customers.
A)
B)
C)
D)
فتح الحزمة
افتح القفل للوصول البطاقات البالغ عددها 141 في هذه المجموعة.
فتح الحزمة
k this deck
57
Use the given data to find the minimum sample size required to estimate the population proportion.
-
A) 20,465
B) 21,442
C) 9642
D) 19,566
-
A) 20,465
B) 21,442
C) 9642
D) 19,566
فتح الحزمة
افتح القفل للوصول البطاقات البالغ عددها 141 في هذه المجموعة.
فتح الحزمة
k this deck
58
Assume that a sample is used to estimate a population proportion p. Find the margin of error E that corresponds to the given statistics and confidence level. Round the margin of error to four decimal places.
-90% confidence; the sample size is 1410, of which 40% are successes
A) 0.0167
B) 0.0267
C) 0.0256
D) 0.0215
-90% confidence; the sample size is 1410, of which 40% are successes
A) 0.0167
B) 0.0267
C) 0.0256
D) 0.0215
فتح الحزمة
افتح القفل للوصول البطاقات البالغ عددها 141 في هذه المجموعة.
فتح الحزمة
k this deck
59
Assume that a sample is used to estimate a population proportion p. Find the margin of error E that corresponds to the given statistics and confidence level. Round the margin of error to four decimal places.
-95% confidence; the sample size is 6100, of which 40% are successes
A) 0.00923
B) 0.0141
C) 0.0123
D) 0.0162
-95% confidence; the sample size is 6100, of which 40% are successes
A) 0.00923
B) 0.0141
C) 0.0123
D) 0.0162
فتح الحزمة
افتح القفل للوصول البطاقات البالغ عددها 141 في هذه المجموعة.
فتح الحزمة
k this deck
60
Assume that a sample is used to estimate a population proportion p. Find the margin of error E that corresponds to the given statistics and confidence level. Round the margin of error to four decimal places.
-
A) 0.0251
B) 0.0335
C) 0.0293
D) 0.0279
-
A) 0.0251
B) 0.0335
C) 0.0293
D) 0.0279
فتح الحزمة
افتح القفل للوصول البطاقات البالغ عددها 141 في هذه المجموعة.
فتح الحزمة
k this deck
61
Use the given degree of confidence and sample data to construct a confidence interval for the population proportion p.
-Of 80 adults selected randomly from one town, 67 have health insurance. Find a 90% confidence interval for the true proportion of all adults in the town who have health insurance.
A)
B)
C)
D)
-Of 80 adults selected randomly from one town, 67 have health insurance. Find a 90% confidence interval for the true proportion of all adults in the town who have health insurance.
A)
B)
C)
D)
فتح الحزمة
افتح القفل للوصول البطاقات البالغ عددها 141 في هذه المجموعة.
فتح الحزمة
k this deck
62
Use the confidence level and sample data to find a confidence interval for estimating the population µ. Round your answer to the same number of decimal places as the sample mean.
-A random sample of 108 light bulbs had a mean life of hours with a standard deviation of hours. Construct a confidence interval for the mean life, , of all light bulbs of this type.
A)
B)
C)
D)
-A random sample of 108 light bulbs had a mean life of hours with a standard deviation of hours. Construct a confidence interval for the mean life, , of all light bulbs of this type.
A)
B)
C)
D)
فتح الحزمة
افتح القفل للوصول البطاقات البالغ عددها 141 في هذه المجموعة.
فتح الحزمة
k this deck
63
Use the given information to find the minimum sample size required to estimate an unknown population mean µ.
-How many women must be randomly selected to estimate the mean weight of women in one age group. We want 90% confidence that the sample mean is within 2.8 lb of the population mean, and the population standard deviation is known to be 27 lb.
A) 358
B) 253
C) 252
D) 250
-How many women must be randomly selected to estimate the mean weight of women in one age group. We want 90% confidence that the sample mean is within 2.8 lb of the population mean, and the population standard deviation is known to be 27 lb.
A) 358
B) 253
C) 252
D) 250
فتح الحزمة
افتح القفل للوصول البطاقات البالغ عددها 141 في هذه المجموعة.
فتح الحزمة
k this deck
64
Use the given degree of confidence and sample data to construct a confidence interval for the population mean µ. Assume that the population has a normal distribution.
-Thirty randomly selected students took the calculus final. If the sample mean was 75 and the standard deviation was 13.2, construct a 99% confidence interval for the mean score of all students.
A)
B)
C)
D)
-Thirty randomly selected students took the calculus final. If the sample mean was 75 and the standard deviation was 13.2, construct a 99% confidence interval for the mean score of all students.
A)
B)
C)
D)
فتح الحزمة
افتح القفل للوصول البطاقات البالغ عددها 141 في هذه المجموعة.
فتح الحزمة
k this deck
65
The amounts (in ounces) of juice in eight randomly selected juice bottles are:
Construct a confidence interval for the mean amount of juice in all such bottle
A)
B)
C)
D)
Construct a confidence interval for the mean amount of juice in all such bottle
A)
B)
C)
D)
فتح الحزمة
افتح القفل للوصول البطاقات البالغ عددها 141 في هذه المجموعة.
فتح الحزمة
k this deck
66
Use the given degree of confidence and sample data to find a confidence interval for the population standard deviation ?.
Assume that the population has a normal distribution. Round the confidence interval limits to the same number of decimal places as the sample standard deviation.
-A sociologist develops a test to measure attitudes about public transportation, and 27 randomly selected subjects are given the test. Their mean score is 76.2 and their standard deviation is 21.4.
Construct the 95% confidence interval for the standard deviation, ?, of the scores of all subjects.
A)
B)
C)
D)
فتح الحزمة
افتح القفل للوصول البطاقات البالغ عددها 141 في هذه المجموعة.
فتح الحزمة
k this deck
67
Use the given data to find the minimum sample size required to estimate the population proportion.
-Margin of error: 0.04; confidence level: 99%; from a prior study, is estimated by 0.14.
A) 499
B) 20
C) 289
D) 599
-Margin of error: 0.04; confidence level: 99%; from a prior study, is estimated by 0.14.
A) 499
B) 20
C) 289
D) 599
فتح الحزمة
افتح القفل للوصول البطاقات البالغ عددها 141 في هذه المجموعة.
فتح الحزمة
k this deck
68
Express the confidence interval using the indicated format.
-Express the confidence interval in the form of .
A)
B)
C)
D)
-Express the confidence interval in the form of .
A)
B)
C)
D)
فتح الحزمة
افتح القفل للوصول البطاقات البالغ عددها 141 في هذه المجموعة.
فتح الحزمة
k this deck
69
Find the critical value that corresponds to a 98% confidence level.
A) 2.575
B) 2.33
C) 2.05
D) 1.75
A) 2.575
B) 2.33
C) 2.05
D) 1.75
فتح الحزمة
افتح القفل للوصول البطاقات البالغ عددها 141 في هذه المجموعة.
فتح الحزمة
k this deck
70
Assume that a sample is used to estimate a population proportion p. Find the margin of error E that corresponds to the given statistics and confidence level. Round the margin of error to four decimal places.
-99% confidence; the sample size is 1180, of which 45% are successes
A) 0.0297
B) 0.0284
C) 0.0337
D) 0.0373
-99% confidence; the sample size is 1180, of which 45% are successes
A) 0.0297
B) 0.0284
C) 0.0337
D) 0.0373
فتح الحزمة
افتح القفل للوصول البطاقات البالغ عددها 141 في هذه المجموعة.
فتح الحزمة
k this deck
71
Find the critical value corresponding to a sample size of 7 and a confidence level of 90 percent.
A) 1.635
B) 12.592
C) 18.548
D) 16.812
A) 1.635
B) 12.592
C) 18.548
D) 16.812
فتح الحزمة
افتح القفل للوصول البطاقات البالغ عددها 141 في هذه المجموعة.
فتح الحزمة
k this deck
72
Express the confidence interval using the indicated format.
-Express the confidence interval in the form of .
A)
B)
C)
D)
-Express the confidence interval in the form of .
A)
B)
C)
D)
فتح الحزمة
افتح القفل للوصول البطاقات البالغ عددها 141 في هذه المجموعة.
فتح الحزمة
k this deck
73
A) 1.88
B) 1.555
C) 1.96
D) 2.75
فتح الحزمة
افتح القفل للوصول البطاقات البالغ عددها 141 في هذه المجموعة.
فتح الحزمة
k this deck
74
Use the confidence level and sample data to find a confidence interval for estimating the population µ. Round your answer to the same number of decimal places as the sample mean.
-Test scores: confidence
A)
B)
C)
D)
-Test scores: confidence
A)
B)
C)
D)
فتح الحزمة
افتح القفل للوصول البطاقات البالغ عددها 141 في هذه المجموعة.
فتح الحزمة
k this deck
75
The following confidence interval is obtained for a population proportion, . Use these confidence interval limits to find the point estimate, .
A) 0.699
B) 0.704
C) 0.686
D) 0.694
A) 0.699
B) 0.704
C) 0.686
D) 0.694
فتح الحزمة
افتح القفل للوصول البطاقات البالغ عددها 141 في هذه المجموعة.
فتح الحزمة
k this deck
76
Use the given degree of confidence and sample data to construct a confidence interval for the population mean µ. Assume that the population has a normal distribution.
- confidence
A)
B)
C)
D)
- confidence
A)
B)
C)
D)
فتح الحزمة
افتح القفل للوصول البطاقات البالغ عددها 141 في هذه المجموعة.
فتح الحزمة
k this deck
77
confidence
A)
B)
C)
D)
A)
B)
C)
D)
فتح الحزمة
افتح القفل للوصول البطاقات البالغ عددها 141 في هذه المجموعة.
فتح الحزمة
k this deck
78
Use the given degree of confidence and sample data to construct a confidence interval for the population mean µ. Assume that the population has a normal distribution.
-A laboratory tested twelve chicken eggs and found that the mean amount of cholesterol was 198 milligrams with milligrams. Construct a confidence interval for the true mean cholesterol content of all such eggs.
A)
B)
C)
D)
-A laboratory tested twelve chicken eggs and found that the mean amount of cholesterol was 198 milligrams with milligrams. Construct a confidence interval for the true mean cholesterol content of all such eggs.
A)
B)
C)
D)
فتح الحزمة
افتح القفل للوصول البطاقات البالغ عددها 141 في هذه المجموعة.
فتح الحزمة
k this deck
79
Use the given data to find the minimum sample size required to estimate the population proportion.
-Margin of error: 0.008; confidence level
A) 15,007
B) 15,098
C) 14,488
D) 5045
-Margin of error: 0.008; confidence level
A) 15,007
B) 15,098
C) 14,488
D) 5045
فتح الحزمة
افتح القفل للوصول البطاقات البالغ عددها 141 في هذه المجموعة.
فتح الحزمة
k this deck
80
Find the chi-square value corresponding to a sample size of 4 and a confidence level of 98 percent.
A) 0.216
B) 9.348
C) 0.115
D) 11.345
A) 0.216
B) 9.348
C) 0.115
D) 11.345
فتح الحزمة
افتح القفل للوصول البطاقات البالغ عددها 141 في هذه المجموعة.
فتح الحزمة
k this deck
فتح الحزمة
افتح القفل للوصول البطاقات البالغ عددها 141 في هذه المجموعة.


