Deck 6: Accessing Associations Between Variables
ملء الشاشة (f)
سؤال
Based on data from two very large independent samples, two students tested a hypothesis about
Equality of population means using
2) One student used a one-tail test and rejected the null
Hypothesis, but the other used a two-tail test and failed to reject the null. Which of these might
Have been their calculated value of t?
A) 2.22
B) 1.88
C) 1.22
D) 2.66
E) 1.55
Equality of population means using
2) One student used a one-tail test and rejected the null
Hypothesis, but the other used a two-tail test and failed to reject the null. Which of these might
Have been their calculated value of t?
A) 2.22
B) 1.88
C) 1.22
D) 2.66
E) 1.55
سؤال
سؤال
سؤال
At one SAT test site students taking the test for a second time volunteered to inhale supplemental
Oxygen for 10 minutes before the test. In fact, some received oxygen, but others (randomly
Assigned) were given just normal air. Test results showed that 42 of 66 students who breathed
Oxygen improved their SAT scores, compared to only 35 of 63 students who did not get the oxygen.
Which procedure should we use to see if there is evidence that breathing extra oxygen can help
Test-takers think more clearly?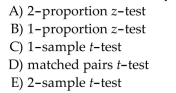
سؤال
سؤال
A professor was curious about her students' grade point averages (GPAs). She took a random
Sample of 15 students and found a mean GPA of 3.01 with a standard deviation of 0.534. Which of
The following formulas gives a 99% confidence interval for the mean GPA of the professor's
Students?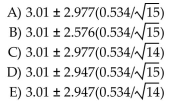
Sample of 15 students and found a mean GPA of 3.01 with a standard deviation of 0.534. Which of
The following formulas gives a 99% confidence interval for the mean GPA of the professor's
Students?
سؤال
سؤال
سؤال
Absorption rates into the body are important considerations when manufacturing a generic version
Of a brand-name drug. A pharmacist read that the absorption rate into the body of a new generic
Drug (G) is the same as its brand-name counterpart (B). She has a researcher friend of hers run a
Small experiment to test
0) Which of the
Following would be a Type I error?
A) Deciding that the absorption rates are the same, when in fact they are not.
B) Deciding that the absorption rates are different, when in fact they are not.
C) The researcher cannot make a Type I error, since he has run an experiment.
D) Deciding that the absorption rates are different, when in fact they are.
E) Deciding that the absorption rates are the same, when in fact they are.
سؤال
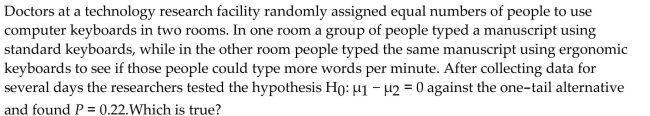
A) There's a 22% chance another experiment will give these same results.
B) none of these
C) The people using ergonomic keyboards type 22% more words per minute.
D) There's a 22% chance that there's really no difference in typing speed.
E) There's a 22% chance that people using ergonomic keyboards type more words per minute.
سؤال
سؤال
سؤال
سؤال
The two samples whose statistics are given in the table thought to come from populations with
Equal variances. What is the pooled estimate of the population standard deviation?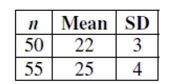
A) 3.50
B) 1.87
C) 5.00
D) 3.56
E) 3.52
Equal variances. What is the pooled estimate of the population standard deviation?
A) 3.50
B) 1.87
C) 5.00
D) 3.56
E) 3.52
سؤال
A contact lens wearer read that the producer of a new contact lens boasts that their lenses are
Cheaper than contact lenses from another popular company. She collected some data, then tested
The null hypothesis
0) Which of the
Following would be a Type II error?
A) Deciding that the new lenses are cheaper, when in fact they really are.
B) Deciding that the new lenses are not really cheaper, when in fact they are not.
C) Deciding that the new lenses are cheaper, when in fact they are not.
D) Applying these results to all contact lenses, old and new.
E) Deciding that the new lenses are not really cheaper, when in fact they are.
سؤال
A) There is a 99.7% chance that another sample will give these same results.
B) There is a 0.3% chance that the mean ages for the men and women are different.
C) There is a 0.3% chance that the mean ages for the men and women are equal.
D) It is very unlikely that the professor would see results like these if the mean age of men was equal to the mean age of women.
E) There is a 0.3% chance that another sample will give these same results.
سؤال
A contact lens wearer read that the producer of a new contact lens boasts that their lenses are
Cheaper than contact lenses from another popular company. She collected some data, then tested
The null hypothesis
0) Which of the
Following would be a Type II error?
A) Deciding that the new lenses are cheaper, when in fact they are not.
B) Deciding that the new lenses are not really cheaper, when in fact they are not.
C) Deciding that the new lenses are cheaper, when in fact they really are.
D) Applying these results to all contact lenses, old and new.
E) Deciding that the new lenses are not really cheaper, when in fact they are.
سؤال
The two samples whose statistics are given in the table thought to come from populations with
Equal variances. What is the pooled estimate of the population standard deviation?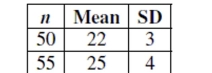
A) 3.50
B) 3.56
C) 1.87
D) 5.00
E) 3.52
Equal variances. What is the pooled estimate of the population standard deviation?
A) 3.50
B) 3.56
C) 1.87
D) 5.00
E) 3.52
سؤال
Based on data from two very large independent samples, two students tested a hypothesis about
Equality of population means using
5) One student used a one-tail test and rejected the null
Hypothesis, but the other used a two-tail test and failed to reject the null. Which of these might
Have been their calculated value of t?
A) 1.55
B) 1.88
C) 1.22
D) 2.22
E) 2.66
Equality of population means using
5) One student used a one-tail test and rejected the null
Hypothesis, but the other used a two-tail test and failed to reject the null. Which of these might
Have been their calculated value of t?
A) 1.55
B) 1.88
C) 1.22
D) 2.22
E) 2.66
سؤال
A coffee house owner knows that customers pour different amounts of coffee into their cups. She
Samples cups from 10 costumers she believes to be representative of the customers and weighs the
Cups, finding a mean of 12.5 ounces and standard deviation of 0.5 ounces. Assuming these cups of
Coffee can be considered a random sample of all cups of coffee which of the following formulas
Gives a 95% confidence interval for the mean weight of all cups of coffee?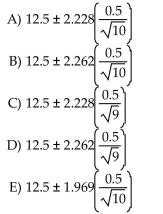
سؤال
A wildlife biologist wants to determine the mean weight of adult red squirrels. She captures 10
Squirrels she believes to be representative of the species and weighs them, finding a mean of 12.32
Grams and standard deviation of 1.88 gm. Assuming these squirrels can be considered a random
Sample of all red squirrels which of the following formulas gives a 95% confidence interval for the
Mean weight of all squirrels?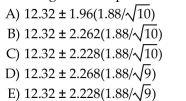
سؤال
The two samples whose statistics are given in the table are thought to come from populations with
Equal variances. What is the pooled estimate of the population standard deviation?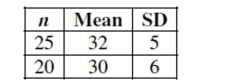
A) 5.46
B) 1.64
C) 5.50
D) 5.59
E) 3.32
Equal variances. What is the pooled estimate of the population standard deviation?
A) 5.46
B) 1.64
C) 5.50
D) 5.59
E) 3.32
سؤال
سؤال
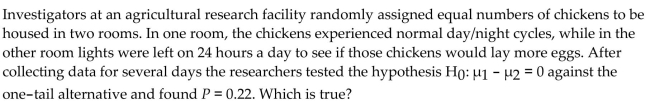
A) The chickens in the lighted room averaged 0.22 more eggs per day
B) There's a 22% chance that there's really no difference in egg production.
C) There's a 22% chance another experiment will give these same results.
D) There's a 22% chance that chickens housed in a lighted room produce more eggs.
E) none of these
سؤال
The two samples whose statistics are given in the table are thought to come from populations with
Equal variances. What is the pooled estimate of the population standard deviation?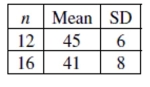
A) 7.22
B) 7.14
C) 7
D) 2.65
E) 10
Equal variances. What is the pooled estimate of the population standard deviation?
A) 7.22
B) 7.14
C) 7
D) 2.65
E) 10
سؤال
سؤال
سؤال
سؤال
سؤال
سؤال
سؤال
سؤال
سؤال
Based on data from two very large independent samples, two students tested a hypothesis about
Equality of population means using
2) One student used a one-tail test and rejected the null
Hypothesis, but the other used a two-tail test and failed to reject the null. Which of these might
Have been their calculated value of t?
A) 1.22
B) 2.66
C) 1.55
D) 1.88
E) 2.22
Equality of population means using
2) One student used a one-tail test and rejected the null
Hypothesis, but the other used a two-tail test and failed to reject the null. Which of these might
Have been their calculated value of t?
A) 1.22
B) 2.66
C) 1.55
D) 1.88
E) 2.22
سؤال
سؤال
A coffee house owner knows that customers pour different amounts of coffee into their cups. She
Samples cups from 10 costumers she believes to be representative of the customers and weighs the
Cups, finding a mean of 12.5 ounces and standard deviation of 0.5 ounces. Assuming these cups of
Coffee can be considered a random sample of all cups of coffee which of the following formulas
Gives a 95% confidence interval for the mean weight of all cups of coffee?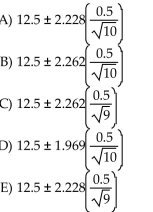
Samples cups from 10 costumers she believes to be representative of the customers and weighs the
Cups, finding a mean of 12.5 ounces and standard deviation of 0.5 ounces. Assuming these cups of
Coffee can be considered a random sample of all cups of coffee which of the following formulas
Gives a 95% confidence interval for the mean weight of all cups of coffee?
سؤال
سؤال
سؤال
سؤال
سؤال
سؤال
سؤال
A manufacturing plant for recreational vehicles receives shipments from three different
parts vendors. There has been a defect issue with some of the electrical wiring in the
recreational vehicles manufactured at the plant. The plant manager wonders if all of the
vendors might be contributing equally to the defect issue. The plant manager reviews three
samples of quality assurance inspections from the last six months, one from each of the
vendors. The data are shown in the table below.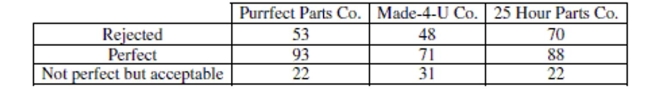
Test an appropriate hypothesis to decide if the plant manager is correct. Give statistical
evidence to support your conclusion.
سؤال
Gas mileage Hoping to improve the gas mileage of their cars, a car company has made an
adjustment in the manufacturing process. Random samples of automobiles coming off the
assembly line have been measured each week that the plant has been in operation. The
data from before and after the manufacturing adjustments were made are in the table. It is
believed that measurements of gas mileage are normally distributed. Write a complete
conclusion about the manufacturing adjustments based on the statistical software printout
shown below.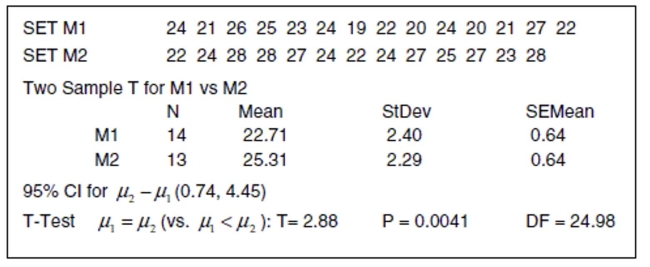
سؤال
Flight costs Every year Educational Services (ETS) selects readers for the Advanced
Placement Exams. Recently the AP Statistics exam has been graded in Lincoln, Nebraska.
One objective of ETS is to achieve equity in grading by inviting teachers to be readers from
all parts of the nation. However budgets are a consideration also. The accountants at ETS
wonder if the flights from cities west of Lincoln are the same as flight costs from cities east
of Lincoln. A random sample of the expense vouchers from last year was reviewed for the
cost of airline tickets. Costs (in dollars) are shown in the table.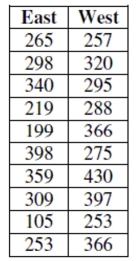
Indicate what inference procedure you would use to see if there is a significant difference
in the costs of airline flights between the west and east coasts to Lincoln, Nebraska, then
decide if it is okay to actually perform that inference procedure. (Check the appropriate
assumptions and conditions and indicate whether you could or could not proceed. You do
not have to do the actual test.)
سؤال
Packing Line A packing company investigates hiring a national training consultant to
improve productivity on their packing line. The consultant is very expensive, so they will
only hire him if they are very sure that productivity will rise. The company hires the
consultant for a one-week trial to work with 18 employees before making a final decision
about the training program. The training program will be implemented if the average units
packed per employee increases by more than 10 cases per day. The company manager will
test a hypothesis using
a. Write appropriate hypotheses (in words and in symbols).
b. In this context, which do you consider to be more serious - a Type I or a Type II error?
Explain briefly.
c. After this trial produced inconclusive results the manager decided to test the training
program again with another group of employees. Describe two changes he could make in
the trial to increase the power of the test, and explain the disadvantages of each.
سؤال
A high school counselor was interested in finding out how well student grade point averages (GPA) predict ACT scores. A
sample of the senior class data was reviewed to obtain GPA and ACT scores. The data are shown in the table to the right.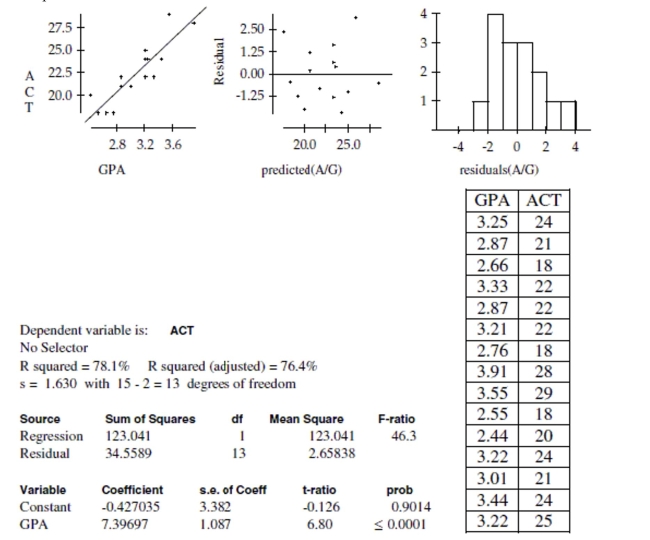
Create and interpret a 95% confidence interval for the slope of the regression line.
sample of the senior class data was reviewed to obtain GPA and ACT scores. The data are shown in the table to the right.
Create and interpret a 95% confidence interval for the slope of the regression line.
سؤال
A biology professor reports that historically grades in her introductory biology course have
been distributed as follows: 15% A's, 30% B's, 40% C's, 10% D's, and 5% F's. Grades in her
most recent course were distributed as follows: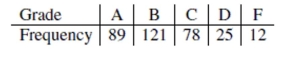
a. Test an appropriate hypothesis to decide if the professor's most recent grade distribution
matches the historical distribution. Give statistical evidence to support your conclusion.
b. Which grade impacted your decision the most? Explain what this means in the context of
the problem.
سؤال
As part of a survey, students in a large statistics class were asked whether or not they ate
breakfast that morning. The data appears in the following table: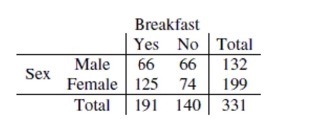
Is there evidence that eating breakfast is independent of the student's sex? Test an
appropriate hypothesis. Give statistical evidence to support your conclusion.
breakfast that morning. The data appears in the following table:
Is there evidence that eating breakfast is independent of the student's sex? Test an
appropriate hypothesis. Give statistical evidence to support your conclusion.
سؤال
Every year favorite songs compete to be on a Top 200 list based upon sales and rankings by the experts in the music industry.
These songs have many characteristics, such as song length and beats per minute, which vary from category to category in
the music industry. A disc jockey wondered if the number of beats per minute in songs classified as dance music were lower
than the beats per minute in the songs that are ranked on a Top 200 list from 2001. A random sample of songs from each
group was selected and the beats per minute are listed in the chart at the right. Does this sample indicate that songs classified
as dance music have lower beats per minute than the songs ranked on a Top 200 list?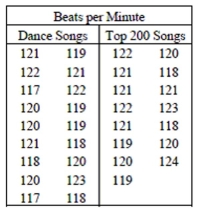
Test an appropriate hypothesis and state your conclusion.
سؤال
سؤال
سؤال
A high school counselor was interested in finding out how well student grade point averages (GPA) predict ACT scores. A
sample of the senior class data was reviewed to obtain GPA and ACT scores. The data are shown in the table to the right.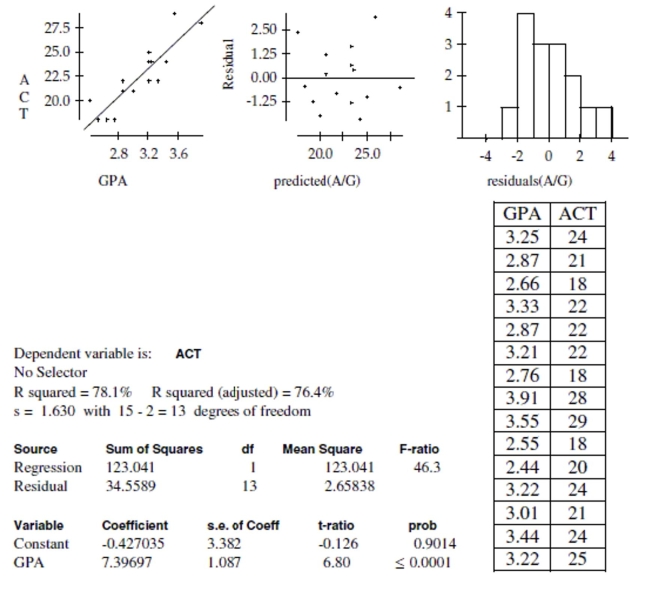
Is there evidence of an association between GPA and ACT score? Test an appropriate
hypothesis and state your conclusion in the proper context.
sample of the senior class data was reviewed to obtain GPA and ACT scores. The data are shown in the table to the right.
Is there evidence of an association between GPA and ACT score? Test an appropriate
hypothesis and state your conclusion in the proper context.
سؤال
A college admissions counselor was interested in finding out how well high school grade point averages (HS GPA) predict
first-year college GPAs (FY GPA). A random sample of data from first-year students was reviewed to obtain high school and
first-year college GPAs. The data are shown below: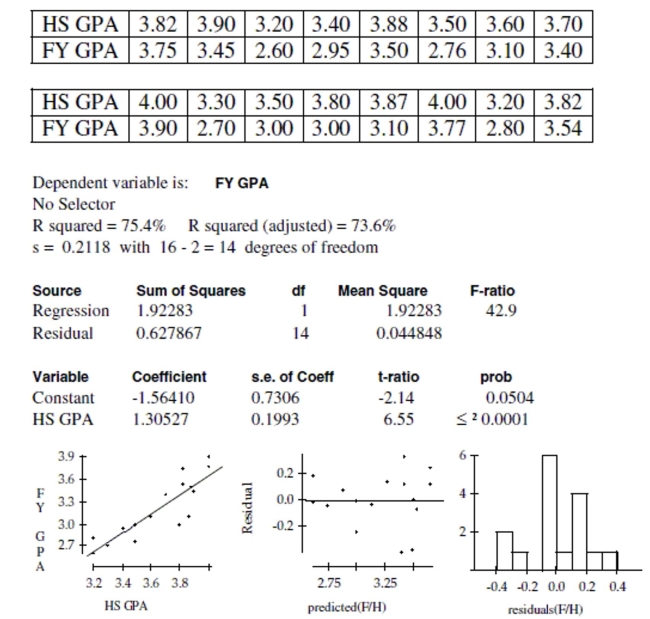
Create and interpret a 95% confidence interval for the slope of the regression line.
first-year college GPAs (FY GPA). A random sample of data from first-year students was reviewed to obtain high school and
first-year college GPAs. The data are shown below:
Create and interpret a 95% confidence interval for the slope of the regression line.
سؤال
A soft drink company is conducting research to select a new design for the can. A random
sample of participants has been selected. Instead of a typical taste test with two different
sodas, they actually give each participant the same soda twice. One drink is served in a
predominantly red can, the other in a predominantly blue can. The order is chosen
randomly. Participants are asked to rate each drink on a scale of 1 to 10. Thus, the company
wishes to test if the color of the can influences the rating. The ratings were recorded for
each participant. The data are shown in the table below. Does this sample indicate that
there is a difference in the ratings? Test an appropriate hypothesis and state your
conclusion.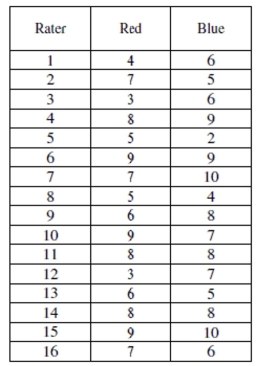
سؤال
Auto repairs An insurance company hopes to save money on repairs to autos involved in
accidents. Two body shops in town seem to do most of the repairs, and the company
wonders whether one of them is generally cheaper than the other. From their files of
payments made during the past year they select a random sample of ten bills they paid at
each repair shop. The data are shown in the table.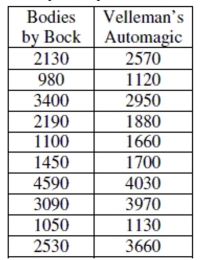
Indicate what inference procedure you would use to see if there is a significant difference
in the costs of repairs done at these two body shops, then decide if it is okay to actually
perform that inference procedure. (Check the appropriate assumptions and conditions and
indicate whether you could or could not proceed. You do not have to do the actual test.)
سؤال
Scrubbers A factory recently installed new pollution control equipment ("scrubbers") on its
smokestacks in hopes of reducing air pollution levels at a nearby national park. Randomly
timed measurements of sulfate levels (in micrograms per cubic meter) were taken before
(Set C1) and after (Set C2) the installation. We believe that measurements of sulfate levels
are normally distributed. Write a complete conclusion about the effectiveness of these
scrubbers based on the statistical software printout shown.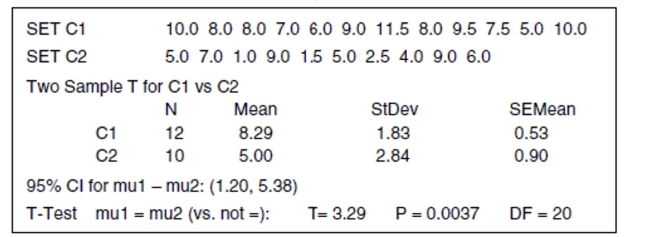
سؤال
In the study "The Role of Sports as a Social Determinant for Children," student respondents in
grades 4 through 6 were asked what they would most like to do at school: make good
grades, be popular or be good at sports. Results delineated by type of school district are
reported below.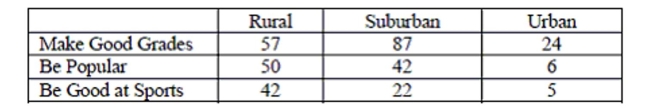
Source: Chase, M.A and Dummer, G.M. (1992), "The Role of Sports as a Social Determinant for
Children," Research Quarterly for Exercise and Sport, 63, 418-424.
Is there evidence that type of school district and personal school goals are independent?
Test an appropriate hypothesis. Give Statistical evidence to support your conclusion.
سؤال
Autos Hoping to improve the gas mileage of their cars, a car company has made an
adjustment in the manufacturing process. Random samples of automobiles coming off the
assembly line have been measured each week that the plant has been in operation. The
data from before and after the manufacturing adjustments were made are in the table. It is
believed that measurements of gas mileage are normally distributed. Write a complete
conclusion about the manufacturing adjustments based on the statistical software printout
shown below.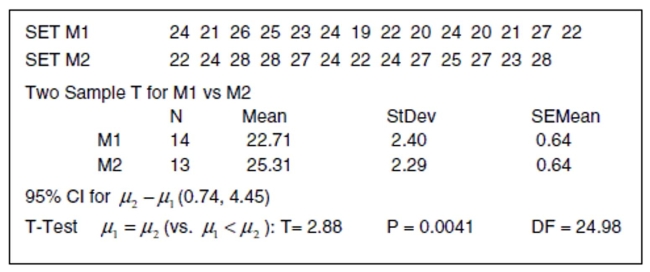
سؤال
AP Grading Every year Educational Testing Services (ETS) selects graders for the
Advanced Placement (AP) Exams. Recently the AP Statistics exam has been graded in
Lincoln, Nebraska. One objective of ETS is to have consistent grading by inviting graders
from all over the nation. However travel expenses are an issue. The accountants at ETS
wonder if the flight costs from cities west of Lincoln are the same as flight costs from cities
east of Lincoln. A random sample of the expense vouchers from last year was reviewed for
the cost of airline tickets. The data are shown in the table below. Indicate what inference
procedure you would use to see if there is a significant difference in the costs of airline
flights to Lincoln from the west and from the east, then decide if it is okay to actually
perform that inference procedure.
(Check the appropriate assumptions and conditions and indicate whether you could or
could not proceed. You do not have to do the actual test.)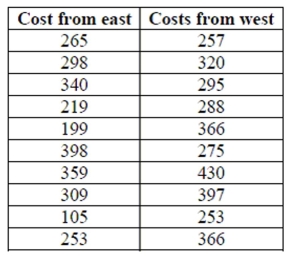
سؤال
In a local school, vending machines offer a range of drinks from juices to sports drinks. The
purchasing agent thinks each type of drink is equally favored among the students buying
drinks from the machines. The recent purchasing choices from the vending machines are
shown in the table.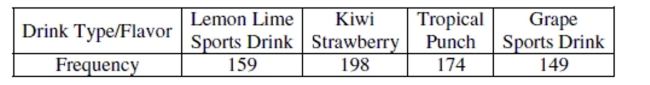
a. Test an appropriate hypothesis to decide if the purchasing agent is correct. Give
statistical evidence to support your conclusion.
b. Which type of drink impacted your decision the most? Explain what this means in the
context of the problem.
سؤال
Cloning A random sample of 800 adults was asked the following question: "Do you think
current laws concerning the use of cloning for medical research are too strict, too lenient, or about
right?" The pollsters also classified the respondents with respect to highest education level
attained: high school, 2- year college degree, 4-year degree, or advanced degree. We wish
to know if attitudes on cloning are related to education level. (All the conditions are
satisfied - don't worry about checking them.)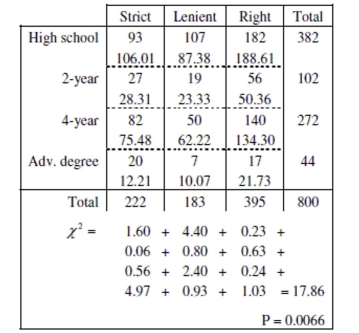
a. Write appropriate hypotheses.
b. Suppose the expected counts had not been given. Show how to calculate the expected
count in the first cell (106.01).
c. How many degrees of freedom? Explain.
d. State your complete conclusion in context.
سؤال
A sports analyst was interested in finding out how well a football team's winning
percentage (stated as a proportion) can be predicted based upon points scored and points
allowed. She selects a random sample of 15 football teams. Each team played 10 games.
She decided to use the point differential, points scored minus points allowed as the
predictor variable. The data are shown in the table and regression output given below.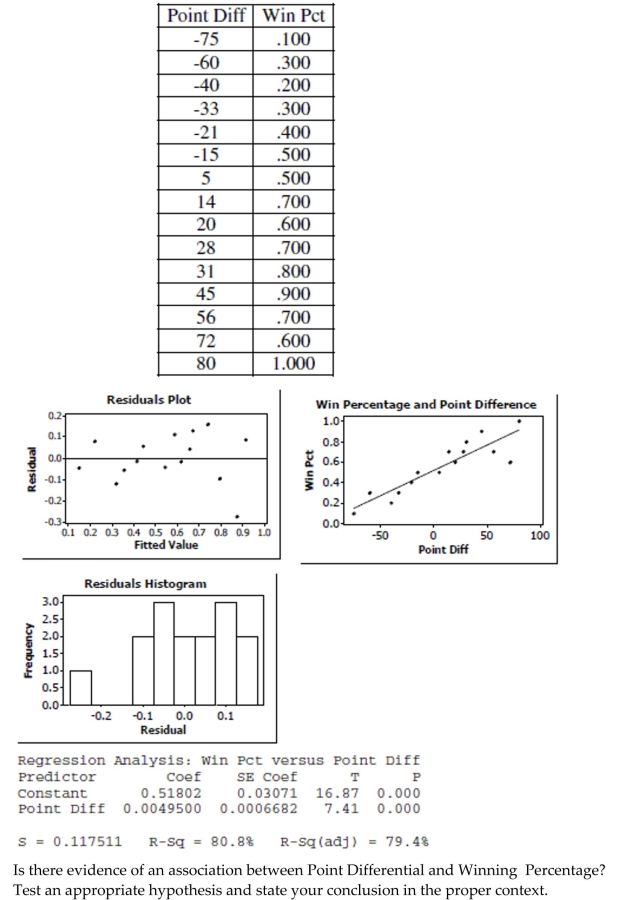
سؤال
When two competing teams are equally matched, the probability that each team wins any
game is 0.5. The NBA championship goes to the team that wins four games in a best-of
seven series. If the teams were equally matched, the probability that the final series ends
with one of the teams sweeping four straight games would be 2(0.5)4 = 0.125. Further
probability calculations indicate that 25% of these series should last five games, 31.25%
should last six games, and the other 31.25% should last the full seven games. The table
shows the number of games it took to decide each of the last 57 NBA champs. Do you think
the teams are usually equally matched? Give statistical evidence to support your
conclusion.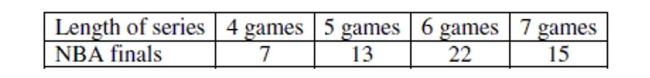
سؤال
Most people are definitely dominant on one side of their body - either right or left. For some sports being able to use both
sides is an advantage, such as batting in baseball or softball. In order to determine if there is a difference in strength between
the dominant and nondominant sides, a few switch-hitting members of some school baseball and softball teams were asked
to hit from both sides of the plate during batting practice. The longest hit (in feet) from each side was recorded for each
player. The data are shown in the table below.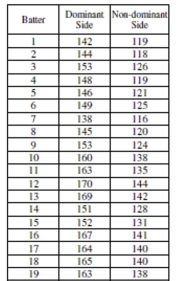
Create and interpret a 95% confidence interval.
سؤال
Most people are definitely dominant on one side of their body - either right or left. For some sports being able to use both
sides is an advantage, such as batting in baseball or softball. In order to determine if there is a difference in strength between
the dominant and nondominant sides, a few switch-hitting members of some school baseball and softball teams were asked
to hit from both sides of the plate during batting practice. The longest hit (in feet) from each side was recorded for each
player. The data are shown in the table below.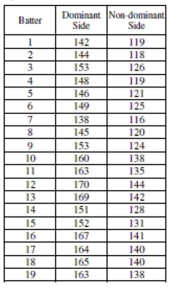
Does this sample indicate that there is a difference in the distance a ball is hit by batters
who are switch-hitters? Test an appropriate hypothesis and state your conclusion.
سؤال
Could eye color be a warning signal for hearing loss in patients suffering from meningitis?
British researcher Helen Cullington recorded the eye color of 130 deaf patients, and noted
whether the patient's deafness had developed following treatment for meningitis. Her data
are summarized in the table below. Test an appropriate hypothesis and state your
conclusion.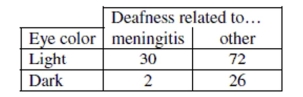
British researcher Helen Cullington recorded the eye color of 130 deaf patients, and noted
whether the patient's deafness had developed following treatment for meningitis. Her data
are summarized in the table below. Test an appropriate hypothesis and state your
conclusion.
سؤال
سؤال
Poverty In a study of how the burden of poverty varies among U. S. regions, a random
sample of 1000 individuals from each region of the United States recently yielded the
information on poverty (based on defining the poverty level as an income below $10,400
for a family of 4 people). The data and calculation of the test statistic is shown in the table
below. (All the conditions are satisfied - don'ft worry about checking them.)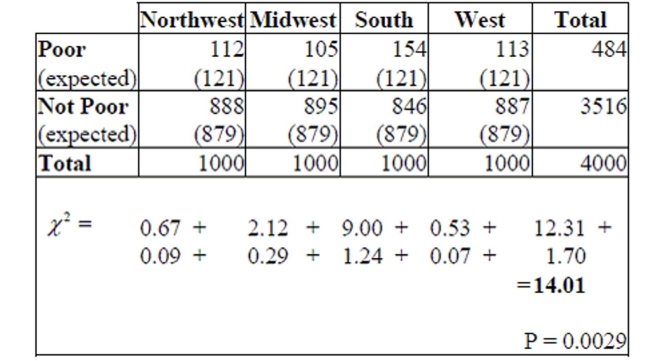
a. Write appropriate hypotheses.
b. Suppose the expected values had not been given. Show exactly how to calculate the
expected count in the first cell.
c. How many degrees of freedom are there?
d. State your complete conclusion in context.
سؤال
A San Jose State student collects data from 20 students. He compares the number of classes a student is enrolled in to their
GPA. Here are the results of the regression analysis. The conditions for inference are satisfied.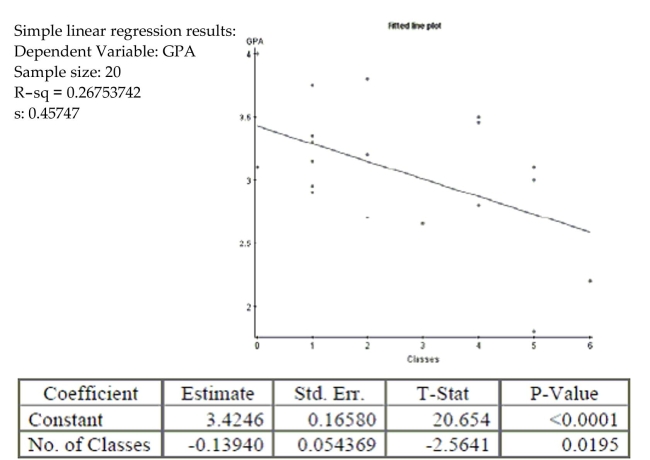
What is the correlation coefficient for this relationship? Interpret this result in context.
GPA. Here are the results of the regression analysis. The conditions for inference are satisfied.
What is the correlation coefficient for this relationship? Interpret this result in context.
سؤال
سؤال
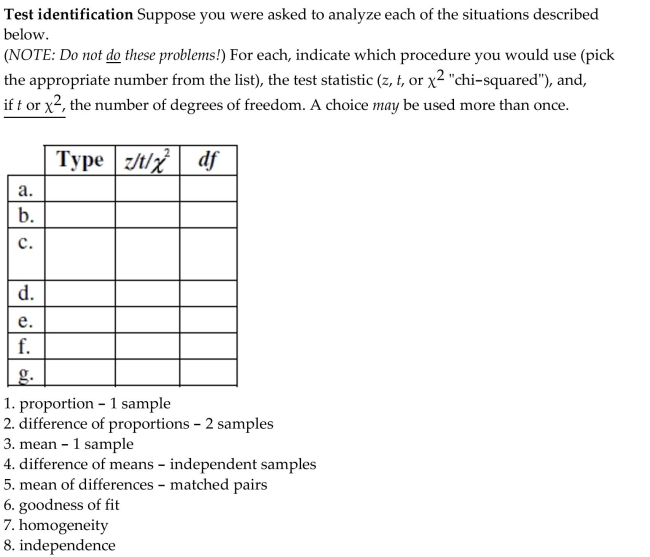
a. Which takes less time to travel to work-car or train? We select a random sample of 45
businessmen, observe them commuting using both methods, and compare their travel
times.
b. A college professor wonders if two versions (A and
B) of his exam are equally difficult.
He randomly mixes 20 Version A's and 20 Version B's together and passes them out to his
40 students. After grading the exams, he compares the scores for the two versions.
c. Forty people complaining of allergies take an antihistamine. They report that their
discomfort subsided in an average of 18 minutes; the standard deviation was 4 minutes.
The manufacturer wants a 95% confidence interval for the "relief time".
d. A health professional selected a random sample of 100 patients from each of four major
hospital emergency rooms to see if the major reasons for emergency room visits are similar
in all four major hospitals. The major reason categories are accident, illegal activity, illness,
or other.
e. A policeman believes that about 40% of older drivers speed on highways, but a
confidential survey found that 49 of 88 randomly selected older drivers admitted speeding
on highways at least once. Is this strong evidence that the policeman was wrong?
f. According to United Nations Population Division, the age distribution of the
Commonwealth of Australia is: 21% less than 15 years of age, 67% between 15 and 65 years
of age, and 12% are over 65 years old. A random sample of 210 residents of Canberra
revealed 40 were less than 15 years of age, 145 were between 15 and 65 years of age, and 25
were over 65 years old. Is Canberra unusual in any way?
g. Among a random sample of college-age students, 6% of the 473 men said they had been
adopted, compared to only 4% of the 552 women. Does this indicate a significant difference
between adoption rates of males and females in college-age students?
سؤال
One common method of evaluating the performance of a mutual fund is to compare its returns to those of a recognized
benchmark such as an index of the returns on all securities of the type that the fund accumulates. The Janus Worldwide Fund
considers its benchmark to be the MSCI World IndexSM. The table below depicts the annual returns (percent) for a recent
ten-year period. Is this fund a good investment? That is, does this fund significantly outperform its benchmark?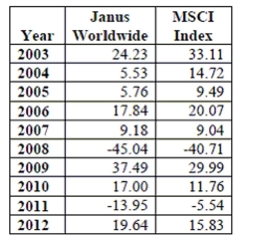 Source:
https://ww3.janus.com/advisor/Documents/Advisor%20Lit%20System/Fact%20Sheets/4Q12%20Fact%20Sheet%20(Janus%20Worldw
ide%20Fund-Class%20A)_exp%2004-15-13.pdf
Explain clearly whether this data should be analyzed using a 2-sample t test approach or a
match pairs t-test method.
benchmark such as an index of the returns on all securities of the type that the fund accumulates. The Janus Worldwide Fund
considers its benchmark to be the MSCI World IndexSM. The table below depicts the annual returns (percent) for a recent
ten-year period. Is this fund a good investment? That is, does this fund significantly outperform its benchmark?
Source:https://ww3.janus.com/advisor/Documents/Advisor%20Lit%20System/Fact%20Sheets/4Q12%20Fact%20Sheet%20(Janus%20Worldw
ide%20Fund-Class%20A)_exp%2004-15-13.pdf
Explain clearly whether this data should be analyzed using a 2-sample t test approach or a
match pairs t-test method.
سؤال
A San Jose State student collects data from 20 students. He compares the number of classes a student is enrolled in to their
GPA. Here are the results of the regression analysis. The conditions for inference are satisfied.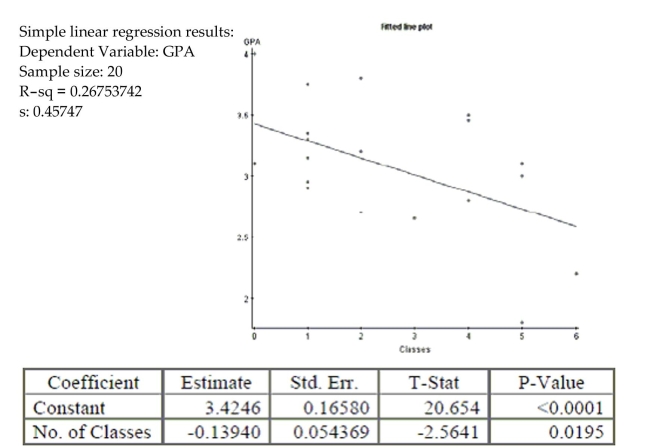
Find and interpret a 95% confidence interval for the slope of the regression equation.
GPA. Here are the results of the regression analysis. The conditions for inference are satisfied.
Find and interpret a 95% confidence interval for the slope of the regression equation.
سؤال
Haircuts You need to find a new hair stylist and know that there are two terrific salons in
your area, Hair by Charles and Curl Up & Dye. You want a really good haircut, but you do
not want to pay too much for the cut. A random sample of costs for 10 different stylists was
taken at each salon (each salon employs over 100 stylists).
a. Indicate what inference procedure you would use to see if there is a significant
difference in the costs for haircuts at each salon. Check the appropriate assumptions and
conditions and indicate whether you could or could nor proceed. (Do not do the actual
test.)
b. A friend tells you that he has heard that Curl Up & Dye is the more expensive salon.
i. Write hypotheses for your friend's claim.
ii. The following are computer outputs. Which output is the correct one to use for this
test? Explain.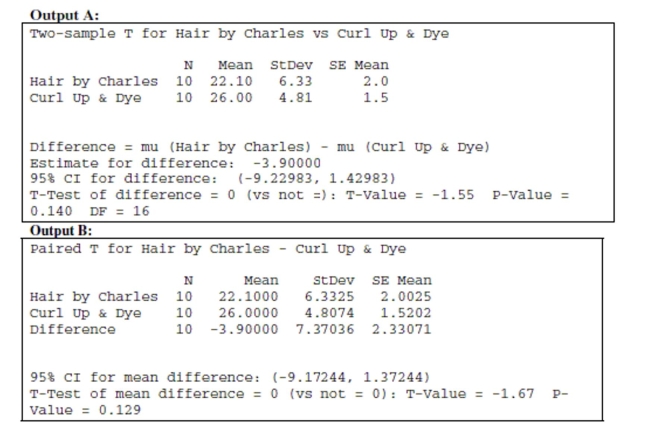
iii. Use the appropriate computer output to make a conclusion about the hypothesis
test based on the data. Make sure to state your conclusion in context.
سؤال
A total of 23 Gossett High School students were admitted to State University. Of those
students, 7 were offered athletic scholarships. The school's guidance counselor looked at their
composite ACT scores (shown in the tabl, wondering if State U. might admit people with
lower scores if they also were athletes. Assuming that this group of students is representative
of students throughout the state, what do you think?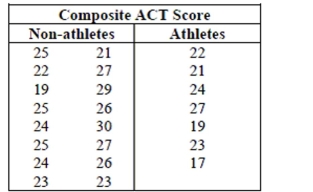
Create and interpret a 90% confidence interval.
سؤال
Blood pressure Researchers developing new drugs must be concerned about possible side
effects. They must check a new medication for arthritis to be sure that it does not cause an
unsafe increase in blood pressure. They measure the blood pressures of a group of 12
subjects, then administer the drug and recheck the blood pressures one hour later. The
drug will be approved for use unless there is evidence that blood pressure has increased an
average of more than 20 points. They will test a hypothesis using
a. Write appropriate hypotheses (in words and in symbols).
b. In this context, which do you consider to be more serious - a Type I or a Type II error?
Explain briefly.
c. After this experiment produced inconclusive results the researchers decided to test the
drug again another group of patients. Describe two changes they could make in their
experiment to increase the power of their test, and explain the disadvantages of each.
سؤال
سؤال
Before you took this course, you probably heard many stories about Statistics courses. Oftentimes parents of students have
had bad experiences with Statistics courses and pass on their anxieties to their children. To test whether actually taking
Statistics decreases students' anxieties about Statistics, a Statistics instructor gave a test to rate student anxiety at the
beginning and end of his course. Anxiety levels were measured on a scale of 0-10. Here are the data for 16 randomly chosen
students from a class of 180 students: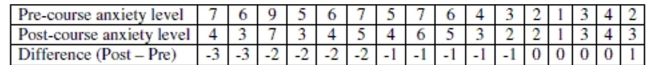
Create and interpret a 90% confidence interval.
سؤال
One common method of evaluating the performance of a mutual fund is to compare its returns to those of a recognized
benchmark such as an index of the returns on all securities of the type that the fund accumulates. The Janus Worldwide Fund
considers its benchmark to be the MSCI World IndexSM. The table below depicts the annual returns (percent) for a recent
ten-year period. Is this fund a good investment? That is, does this fund significantly outperform its benchmark?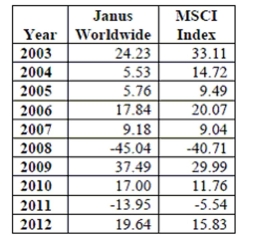 Source:
https://ww3.janus.com/advisor/Documents/Advisor%20Lit%20System/Fact%20Sheets/4Q12%20Fact%20Sheet%20(Janus%20Worldw
ide%20Fund-Class%20A)_exp%2004-15-13.pdf
Carry out the appropriate test and state your conclusion in context.
benchmark such as an index of the returns on all securities of the type that the fund accumulates. The Janus Worldwide Fund
considers its benchmark to be the MSCI World IndexSM. The table below depicts the annual returns (percent) for a recent
ten-year period. Is this fund a good investment? That is, does this fund significantly outperform its benchmark?
Source:https://ww3.janus.com/advisor/Documents/Advisor%20Lit%20System/Fact%20Sheets/4Q12%20Fact%20Sheet%20(Janus%20Worldw
ide%20Fund-Class%20A)_exp%2004-15-13.pdf
Carry out the appropriate test and state your conclusion in context.

فتح الحزمة
قم بالتسجيل لفتح البطاقات في هذه المجموعة!
Unlock Deck
Unlock Deck
1/93
العب
ملء الشاشة (f)
Deck 6: Accessing Associations Between Variables
1
Based on data from two very large independent samples, two students tested a hypothesis about
Equality of population means using
2) One student used a one-tail test and rejected the null
Hypothesis, but the other used a two-tail test and failed to reject the null. Which of these might
Have been their calculated value of t?
A) 2.22
B) 1.88
C) 1.22
D) 2.66
E) 1.55
Equality of population means using
2) One student used a one-tail test and rejected the null
Hypothesis, but the other used a two-tail test and failed to reject the null. Which of these might
Have been their calculated value of t?
A) 2.22
B) 1.88
C) 1.22
D) 2.66
E) 1.55
A
2
You could win a $1000 prize by tossing a coin in one of two games. To win Game A, you must get
Exactly 50% heads. To win Game B, you must get between 45% and 55% heads. Although which
Game you must play will be chosen randomly, then you may decide whether to toss the coin 20
Times or 50 times. How many tosses would you choose to make?
A) It does not matter.
B) 50 tosses for A, 20 tosses for B
C) 50 tosses for either game
D) 20 tosses for A, 50 tosses for B
E) 20 tosses for either game
D
3
An elementary school principal wants to know the mean number of children in families whose
Children attend this school. He checks all the families using the school's registration records, and we
Create a 95% confidence interval based on a t-distribution. This procedure was not appropriate.
Why?
A) At a given school families are not randomly selected.
B) The population standard deviation is known, so he should have used a z-model.
C) The entire population of families was gathered so there is no reason to do inference.
D) Since these families are from only one school, the family sizes may be skewed.
E) The recent record-setting family with twelve children is probably an outlier.
C
4
At one SAT test site students taking the test for a second time volunteered to inhale supplemental
Oxygen for 10 minutes before the test. In fact, some received oxygen, but others (randomly
Assigned) were given just normal air. Test results showed that 42 of 66 students who breathed
Oxygen improved their SAT scores, compared to only 35 of 63 students who did not get the oxygen.
Which procedure should we use to see if there is evidence that breathing extra oxygen can help
Test-takers think more clearly?
Oxygen for 10 minutes before the test. In fact, some received oxygen, but others (randomly
Assigned) were given just normal air. Test results showed that 42 of 66 students who breathed
Oxygen improved their SAT scores, compared to only 35 of 63 students who did not get the oxygen.
Which procedure should we use to see if there is evidence that breathing extra oxygen can help
Test-takers think more clearly?
فتح الحزمة
افتح القفل للوصول البطاقات البالغ عددها 93 في هذه المجموعة.
فتح الحزمة
k this deck
5
A marketing company reviewing the length of television commercials monitored a random sample
Of commercials over several days. They found that a 95% confidence interval for the mean length
(in seconds) of commercials aired daily was (23, 27). Which is true?
A) 95% of the commercials they checked were between 23 and 27 seconds long.
B) Commercials average between 23 and 27 seconds long on 95% of the days.
C) 95% of all the commercials aired were between 23 and 27 seconds a day.
D) 95% of all samples would show mean commercial length between 23 and 27 seconds.
E) We're 95% sure that the mean commercial length is between 23 and 27 seconds.
فتح الحزمة
افتح القفل للوصول البطاقات البالغ عددها 93 في هذه المجموعة.
فتح الحزمة
k this deck
6
A professor was curious about her students' grade point averages (GPAs). She took a random
Sample of 15 students and found a mean GPA of 3.01 with a standard deviation of 0.534. Which of
The following formulas gives a 99% confidence interval for the mean GPA of the professor's
Students?
Sample of 15 students and found a mean GPA of 3.01 with a standard deviation of 0.534. Which of
The following formulas gives a 99% confidence interval for the mean GPA of the professor's
Students?
فتح الحزمة
افتح القفل للوصول البطاقات البالغ عددها 93 في هذه المجموعة.
فتح الحزمة
k this deck
7
A survey asked people "On what percent of days do you get more than 30 minutes of vigorous
Exercise?" Using their responses we want to estimate the difference in exercise frequency between
Men and women. We should use a
A) matched pairs t-interval
B) 1-proportion z-interval
C) 2-sample t-interval
D) 1-sample t-interval
E) 2-proportion z-interval
Exercise?" Using their responses we want to estimate the difference in exercise frequency between
Men and women. We should use a
A) matched pairs t-interval
B) 1-proportion z-interval
C) 2-sample t-interval
D) 1-sample t-interval
E) 2-proportion z-interval
فتح الحزمة
افتح القفل للوصول البطاقات البالغ عددها 93 في هذه المجموعة.
فتح الحزمة
k this deck
8
We want to know the mean winning score at the US Open golf championship. An internet search
Gives us all the scores for the history of that tournament, and we create a 95% confidence interval
Based on a t-distribution. This procedure was not appropriate. Why?
A) The population standard deviation is known, so we should have used a z-model.
B) Since these are the best players in the world, the scores are probably skewed.
C) The entire population of scores was gathered so there is no reason to do inference.
D) In big golf tournaments the players are not randomly selected.
E) The recent record-setting score is probably an outlier.
فتح الحزمة
افتح القفل للوصول البطاقات البالغ عددها 93 في هذه المجموعة.
فتح الحزمة
k this deck
9
Absorption rates into the body are important considerations when manufacturing a generic version
Of a brand-name drug. A pharmacist read that the absorption rate into the body of a new generic
Drug (G) is the same as its brand-name counterpart (B). She has a researcher friend of hers run a
Small experiment to test
0) Which of the
Following would be a Type I error?
A) Deciding that the absorption rates are the same, when in fact they are not.
B) Deciding that the absorption rates are different, when in fact they are not.
C) The researcher cannot make a Type I error, since he has run an experiment.
D) Deciding that the absorption rates are different, when in fact they are.
E) Deciding that the absorption rates are the same, when in fact they are.
Of a brand-name drug. A pharmacist read that the absorption rate into the body of a new generic
Drug (G) is the same as its brand-name counterpart (B). She has a researcher friend of hers run a
Small experiment to test
0) Which of the
Following would be a Type I error?
A) Deciding that the absorption rates are the same, when in fact they are not.
B) Deciding that the absorption rates are different, when in fact they are not.
C) The researcher cannot make a Type I error, since he has run an experiment.
D) Deciding that the absorption rates are different, when in fact they are.
E) Deciding that the absorption rates are the same, when in fact they are.
فتح الحزمة
افتح القفل للوصول البطاقات البالغ عددها 93 في هذه المجموعة.
فتح الحزمة
k this deck
10
A) There's a 22% chance another experiment will give these same results.
B) none of these
C) The people using ergonomic keyboards type 22% more words per minute.
D) There's a 22% chance that there's really no difference in typing speed.
E) There's a 22% chance that people using ergonomic keyboards type more words per minute.
فتح الحزمة
افتح القفل للوصول البطاقات البالغ عددها 93 في هذه المجموعة.
فتح الحزمة
k this deck
11
A researcher found that a 98% confidence interval for the mean hours per week spent studying by
College students was (13, 17). Which is true?
I) There is a 98% chance that the mean hours per week spent studying by college students is
Between 13 and 17 hours.
II) 98% of college students study between 13 and 17 hours a week.
III) Students average between 13 and 17 hours per week studying on 98% of the weeks.
A) III only
B) I and III
C) none of these
D) II only
E) I only
فتح الحزمة
افتح القفل للوصول البطاقات البالغ عددها 93 في هذه المجموعة.
فتح الحزمة
k this deck
12
Food inspectors need to estimate the level of contaminants in food products packaged at a certain
Factory. Initial tests were based on a small sample but now the inspectors double the sample size for
A follow-up test. The main purpose of the larger sample is to…
A) reduce response bias.
B) decrease the standard deviation of the sampling model.
C) reduce non-response bias.
D) reduce confounding due to other variables.
E) decrease the variability in the population.
فتح الحزمة
افتح القفل للوصول البطاقات البالغ عددها 93 في هذه المجموعة.
فتح الحزمة
k this deck
13
An elementary school principal wants to know the mean number of children in families whose
Children attend this school. He checks all the families using the school's registration records, and we
Create a 95% confidence interval based on a t-distribution. This procedure was not appropriate.
Why?
A) Since these families are from only one school, the family sizes may be skewed.
B) At a given school families are not randomly selected.
C) The entire population of families was gathered so there is no reason to do inference.
D) The recent record-setting family with twelve children is probably an outlier.
E) The population standard deviation is known, so he should have used a z-model.
فتح الحزمة
افتح القفل للوصول البطاقات البالغ عددها 93 في هذه المجموعة.
فتح الحزمة
k this deck
14
The two samples whose statistics are given in the table thought to come from populations with
Equal variances. What is the pooled estimate of the population standard deviation?
A) 3.50
B) 1.87
C) 5.00
D) 3.56
E) 3.52
Equal variances. What is the pooled estimate of the population standard deviation?
A) 3.50
B) 1.87
C) 5.00
D) 3.56
E) 3.52
فتح الحزمة
افتح القفل للوصول البطاقات البالغ عددها 93 في هذه المجموعة.
فتح الحزمة
k this deck
15
A contact lens wearer read that the producer of a new contact lens boasts that their lenses are
Cheaper than contact lenses from another popular company. She collected some data, then tested
The null hypothesis
0) Which of the
Following would be a Type II error?
A) Deciding that the new lenses are cheaper, when in fact they really are.
B) Deciding that the new lenses are not really cheaper, when in fact they are not.
C) Deciding that the new lenses are cheaper, when in fact they are not.
D) Applying these results to all contact lenses, old and new.
E) Deciding that the new lenses are not really cheaper, when in fact they are.
فتح الحزمة
افتح القفل للوصول البطاقات البالغ عددها 93 في هذه المجموعة.
فتح الحزمة
k this deck
16
A) There is a 99.7% chance that another sample will give these same results.
B) There is a 0.3% chance that the mean ages for the men and women are different.
C) There is a 0.3% chance that the mean ages for the men and women are equal.
D) It is very unlikely that the professor would see results like these if the mean age of men was equal to the mean age of women.
E) There is a 0.3% chance that another sample will give these same results.
فتح الحزمة
افتح القفل للوصول البطاقات البالغ عددها 93 في هذه المجموعة.
فتح الحزمة
k this deck
17
A contact lens wearer read that the producer of a new contact lens boasts that their lenses are
Cheaper than contact lenses from another popular company. She collected some data, then tested
The null hypothesis
0) Which of the
Following would be a Type II error?
A) Deciding that the new lenses are cheaper, when in fact they are not.
B) Deciding that the new lenses are not really cheaper, when in fact they are not.
C) Deciding that the new lenses are cheaper, when in fact they really are.
D) Applying these results to all contact lenses, old and new.
E) Deciding that the new lenses are not really cheaper, when in fact they are.
فتح الحزمة
افتح القفل للوصول البطاقات البالغ عددها 93 في هذه المجموعة.
فتح الحزمة
k this deck
18
The two samples whose statistics are given in the table thought to come from populations with
Equal variances. What is the pooled estimate of the population standard deviation?
A) 3.50
B) 3.56
C) 1.87
D) 5.00
E) 3.52
Equal variances. What is the pooled estimate of the population standard deviation?
A) 3.50
B) 3.56
C) 1.87
D) 5.00
E) 3.52
فتح الحزمة
افتح القفل للوصول البطاقات البالغ عددها 93 في هذه المجموعة.
فتح الحزمة
k this deck
19
Based on data from two very large independent samples, two students tested a hypothesis about
Equality of population means using
5) One student used a one-tail test and rejected the null
Hypothesis, but the other used a two-tail test and failed to reject the null. Which of these might
Have been their calculated value of t?
A) 1.55
B) 1.88
C) 1.22
D) 2.22
E) 2.66
Equality of population means using
5) One student used a one-tail test and rejected the null
Hypothesis, but the other used a two-tail test and failed to reject the null. Which of these might
Have been their calculated value of t?
A) 1.55
B) 1.88
C) 1.22
D) 2.22
E) 2.66
فتح الحزمة
افتح القفل للوصول البطاقات البالغ عددها 93 في هذه المجموعة.
فتح الحزمة
k this deck
20
A coffee house owner knows that customers pour different amounts of coffee into their cups. She
Samples cups from 10 costumers she believes to be representative of the customers and weighs the
Cups, finding a mean of 12.5 ounces and standard deviation of 0.5 ounces. Assuming these cups of
Coffee can be considered a random sample of all cups of coffee which of the following formulas
Gives a 95% confidence interval for the mean weight of all cups of coffee?
Samples cups from 10 costumers she believes to be representative of the customers and weighs the
Cups, finding a mean of 12.5 ounces and standard deviation of 0.5 ounces. Assuming these cups of
Coffee can be considered a random sample of all cups of coffee which of the following formulas
Gives a 95% confidence interval for the mean weight of all cups of coffee?
فتح الحزمة
افتح القفل للوصول البطاقات البالغ عددها 93 في هذه المجموعة.
فتح الحزمة
k this deck
21
A wildlife biologist wants to determine the mean weight of adult red squirrels. She captures 10
Squirrels she believes to be representative of the species and weighs them, finding a mean of 12.32
Grams and standard deviation of 1.88 gm. Assuming these squirrels can be considered a random
Sample of all red squirrels which of the following formulas gives a 95% confidence interval for the
Mean weight of all squirrels?
Squirrels she believes to be representative of the species and weighs them, finding a mean of 12.32
Grams and standard deviation of 1.88 gm. Assuming these squirrels can be considered a random
Sample of all red squirrels which of the following formulas gives a 95% confidence interval for the
Mean weight of all squirrels?
فتح الحزمة
افتح القفل للوصول البطاقات البالغ عددها 93 في هذه المجموعة.
فتح الحزمة
k this deck
22
The two samples whose statistics are given in the table are thought to come from populations with
Equal variances. What is the pooled estimate of the population standard deviation?
A) 5.46
B) 1.64
C) 5.50
D) 5.59
E) 3.32
Equal variances. What is the pooled estimate of the population standard deviation?
A) 5.46
B) 1.64
C) 5.50
D) 5.59
E) 3.32
فتح الحزمة
افتح القفل للوصول البطاقات البالغ عددها 93 في هذه المجموعة.
فتح الحزمة
k this deck
23
A professor runs a regression to see how students' exam scores (Y) are related to their homework
Grades (X). The R2 of the regression is 21%. What does R2 tell us?
A) 21% of the variation in the exam scores is explained by the regression analysis.
B) 21% of students have their grades accurately predicted by the regression equation.
C) none of these
D) 21% of each student's exam grade will be determined by their homework grade.
E) Exam scores are not related to homework grades since 21% is greater than 5%.
فتح الحزمة
افتح القفل للوصول البطاقات البالغ عددها 93 في هذه المجموعة.
فتح الحزمة
k this deck
24
A) The chickens in the lighted room averaged 0.22 more eggs per day
B) There's a 22% chance that there's really no difference in egg production.
C) There's a 22% chance another experiment will give these same results.
D) There's a 22% chance that chickens housed in a lighted room produce more eggs.
E) none of these
فتح الحزمة
افتح القفل للوصول البطاقات البالغ عددها 93 في هذه المجموعة.
فتح الحزمة
k this deck
25
The two samples whose statistics are given in the table are thought to come from populations with
Equal variances. What is the pooled estimate of the population standard deviation?
A) 7.22
B) 7.14
C) 7
D) 2.65
E) 10
Equal variances. What is the pooled estimate of the population standard deviation?
A) 7.22
B) 7.14
C) 7
D) 2.65
E) 10
فتح الحزمة
افتح القفل للوصول البطاقات البالغ عددها 93 في هذه المجموعة.
فتح الحزمة
k this deck
26
At one vehicle inspection station, 13 of 52 trucks and 11 of 88 cars failed the emissions test.
Assuming these vehicles were representative of the cars and trucks in that area, what is the
Standard error of the difference in the percentages of all cars and trucks that are not in compliance
With air quality regulations?
A) 0.070
B) 0.032
C) 0.095
D) 0.049
E) 0.025
Assuming these vehicles were representative of the cars and trucks in that area, what is the
Standard error of the difference in the percentages of all cars and trucks that are not in compliance
With air quality regulations?
A) 0.070
B) 0.032
C) 0.095
D) 0.049
E) 0.025
فتح الحزمة
افتح القفل للوصول البطاقات البالغ عددها 93 في هذه المجموعة.
فتح الحزمة
k this deck
27
Trainers need to estimate the level of fat in athletes to ensure good health. Initial tests were based
On a small sample but now the trainers double the sample size for a followup test. The main
Purpose of the larger sample is to…
A) reduce confounding due to other variables.
B) reduce response bias.
C) decrease the standard deviation of the sampling model.
D) decrease the variability in the population.
E) reduce non-response bias.
فتح الحزمة
افتح القفل للوصول البطاقات البالغ عددها 93 في هذه المجموعة.
فتح الحزمة
k this deck
28
A marketing company reviewing the length of television commercials monitored a random sample
Of commercials over several days. They found that a 95% confidence interval for the mean length
(in seconds) of commercials aired daily was (23, 27). Which is true?
A) 95% of the commercials they checked were between 23 and 27 seconds long.
B) 95% of all the commercials aired were between 23 and 27 seconds a day.
C) We're 95% sure that the mean commercial length is between 23 and 27 seconds.
D) 95% of all samples would show mean commercial length between 23 and 27 seconds.
E) Commercials average between 23 and 27 seconds long on 95% of the days.
فتح الحزمة
افتح القفل للوصول البطاقات البالغ عددها 93 في هذه المجموعة.
فتح الحزمة
k this deck
29
Which statement correctly compares t-distributions to the normal distribution?
I) t distributions are also mound shaped and symmetric.
II) t distributions have less spread than the normal distribution.
III) As degrees of freedom increase, the variance of t distributions becomes smaller.
A) I, II, and III
B) I only
C) I and III only
D) I and II only
E) II only
I) t distributions are also mound shaped and symmetric.
II) t distributions have less spread than the normal distribution.
III) As degrees of freedom increase, the variance of t distributions becomes smaller.
A) I, II, and III
B) I only
C) I and III only
D) I and II only
E) II only
فتح الحزمة
افتح القفل للوصول البطاقات البالغ عددها 93 في هذه المجموعة.
فتح الحزمة
k this deck
30
Which statement correctly compares t-distributions to the normal distribution?
I) t distributions are also mound shaped and symmetric.
II) t distributions have less spread than the normal distribution.
III) As degrees of freedom increase, the variance of t distributions becomes smaller.
A) II only
B) I, II, and III
C) I and II only
D) I only
E) I and III only
I) t distributions are also mound shaped and symmetric.
II) t distributions have less spread than the normal distribution.
III) As degrees of freedom increase, the variance of t distributions becomes smaller.
A) II only
B) I, II, and III
C) I and II only
D) I only
E) I and III only
فتح الحزمة
افتح القفل للوصول البطاقات البالغ عددها 93 في هذه المجموعة.
فتح الحزمة
k this deck
31
A random sample of 120 classrooms at a large university found that 70% of them had been cleaned
Properly. What is the standard error of the sample proportion?
A) 0.042
B) 0.028
C) 0.046
D) 0.458
E) 0.082
Properly. What is the standard error of the sample proportion?
A) 0.042
B) 0.028
C) 0.046
D) 0.458
E) 0.082
فتح الحزمة
افتح القفل للوصول البطاقات البالغ عددها 93 في هذه المجموعة.
فتح الحزمة
k this deck
32
Which of the following is true about Student's t-models?
I) They are unimodal, symmetric, and bell-shaped.
II) They have fatter tails than the Normal model.
III) As the degrees of freedom increase, the t-models look more and more like the Normal.
A) I and III
B) I, II, and III
C) I only
D) II and III
E) I and II
I) They are unimodal, symmetric, and bell-shaped.
II) They have fatter tails than the Normal model.
III) As the degrees of freedom increase, the t-models look more and more like the Normal.
A) I and III
B) I, II, and III
C) I only
D) II and III
E) I and II
فتح الحزمة
افتح القفل للوصول البطاقات البالغ عددها 93 في هذه المجموعة.
فتح الحزمة
k this deck
33
The Y-variable in a regression analysis is also known as the...
A) response variable
B) predictor variable
C) independent variable
D) explanatory variable
E) none of these
A) response variable
B) predictor variable
C) independent variable
D) explanatory variable
E) none of these
فتح الحزمة
افتح القفل للوصول البطاقات البالغ عددها 93 في هذه المجموعة.
فتح الحزمة
k this deck
34
Based on data from two very large independent samples, two students tested a hypothesis about
Equality of population means using
2) One student used a one-tail test and rejected the null
Hypothesis, but the other used a two-tail test and failed to reject the null. Which of these might
Have been their calculated value of t?
A) 1.22
B) 2.66
C) 1.55
D) 1.88
E) 2.22
Equality of population means using
2) One student used a one-tail test and rejected the null
Hypothesis, but the other used a two-tail test and failed to reject the null. Which of these might
Have been their calculated value of t?
A) 1.22
B) 2.66
C) 1.55
D) 1.88
E) 2.22
فتح الحزمة
افتح القفل للوصول البطاقات البالغ عددها 93 في هذه المجموعة.
فتح الحزمة
k this deck
35
A company checking the productivity of its assembly line monitored a random sample of workers
For several days. They found that a 95% confidence interval for the mean number of items
Produced daily by each worker was (23,27). Which is true?
A) We're 95% sure that the mean daily worker output is between 23 and 27 items.
B) 95% of the workers sampled produced between 23 and 37 items a day.
C) 95% of samples would show mean production between 23 and 27 items a day.
D) 95% of all the workers average between 23 and 27 items a day.
E) Workers produce an average of 23 to 27 items on 95% of the days.
فتح الحزمة
افتح القفل للوصول البطاقات البالغ عددها 93 في هذه المجموعة.
فتح الحزمة
k this deck
36
A coffee house owner knows that customers pour different amounts of coffee into their cups. She
Samples cups from 10 costumers she believes to be representative of the customers and weighs the
Cups, finding a mean of 12.5 ounces and standard deviation of 0.5 ounces. Assuming these cups of
Coffee can be considered a random sample of all cups of coffee which of the following formulas
Gives a 95% confidence interval for the mean weight of all cups of coffee?
Samples cups from 10 costumers she believes to be representative of the customers and weighs the
Cups, finding a mean of 12.5 ounces and standard deviation of 0.5 ounces. Assuming these cups of
Coffee can be considered a random sample of all cups of coffee which of the following formulas
Gives a 95% confidence interval for the mean weight of all cups of coffee?
فتح الحزمة
افتح القفل للوصول البطاقات البالغ عددها 93 في هذه المجموعة.
فتح الحزمة
k this deck
37
A random sample of 120 college seniors found that 30% of them had been offered jobs. What is the
Standard error of the sample proportion?
A) 0.042
B) 0.028
C) 0.458
D) 0.082
E) 0.046
Standard error of the sample proportion?
A) 0.042
B) 0.028
C) 0.458
D) 0.082
E) 0.046
فتح الحزمة
افتح القفل للوصول البطاقات البالغ عددها 93 في هذه المجموعة.
فتح الحزمة
k this deck
38
Which statement correctly compares t-distributions to the Normal distribution?
I) t distributions are also mound shaped and symmetric.
II) t distributions are more spread out than the normal distribution.
III) As degrees of freedom increase, the variance of t distributions becomes larger.
A) II only
B) I, II, and III
C) I only
D) I and II only
E) I and III only
I) t distributions are also mound shaped and symmetric.
II) t distributions are more spread out than the normal distribution.
III) As degrees of freedom increase, the variance of t distributions becomes larger.
A) II only
B) I, II, and III
C) I only
D) I and II only
E) I and III only
فتح الحزمة
افتح القفل للوصول البطاقات البالغ عددها 93 في هذه المجموعة.
فتح الحزمة
k this deck
39
Which of the following statements is NOT an assumption of inference for a regression model?
A) The errors around the idealized regression line have equal variability.
B) The dependent variable is linearly related to the explanatory variables.
C) The errors around the idealized regression line are linearly related.
D) The errors around the idealized regression line are independent of each other.
E) The errors around the idealized regression line follow a Normal model.
فتح الحزمة
افتح القفل للوصول البطاقات البالغ عددها 93 في هذه المجموعة.
فتح الحزمة
k this deck
40
Trainers need to estimate the level of fat in athletes to ensure good health. Initial tests were based
On a small sample but now the trainers double the sample size for a followup test. The main
Purpose of the larger sample is to…
A) decrease the standard deviation of the sampling model.
B) reduce response bias.
C) reduce non-response bias.
D) reduce confounding due to other variables.
E) decrease the variability in the population.
فتح الحزمة
افتح القفل للوصول البطاقات البالغ عددها 93 في هذه المجموعة.
فتح الحزمة
k this deck
41
In 2010, the United Nations claimed that there was a higher rate of illiteracy in men than in women from the country of
Qatar. A humanitarian organization went to Qatar to conduct a random sample. The results revealed that 45 out of 234 men
and 42 out of 251 women were classified as illiterate on the same measurement test. Do these results indicate that the United
Nations findings were correct?
Test an appropriate hypothesis and state your conclusion.
فتح الحزمة
افتح القفل للوصول البطاقات البالغ عددها 93 في هذه المجموعة.
فتح الحزمة
k this deck
42
A random sample of 120 classrooms at a large university found that 70% of them had been cleaned
Properly. What is the standard error of the sample proportion?
A) 0.458
B) 0.082
C) 0.028
D) 0.042
E) 0.046
Properly. What is the standard error of the sample proportion?
A) 0.458
B) 0.082
C) 0.028
D) 0.042
E) 0.046
فتح الحزمة
افتح القفل للوصول البطاقات البالغ عددها 93 في هذه المجموعة.
فتح الحزمة
k this deck
43
A manufacturing plant for recreational vehicles receives shipments from three different
parts vendors. There has been a defect issue with some of the electrical wiring in the
recreational vehicles manufactured at the plant. The plant manager wonders if all of the
vendors might be contributing equally to the defect issue. The plant manager reviews three
samples of quality assurance inspections from the last six months, one from each of the
vendors. The data are shown in the table below.
Test an appropriate hypothesis to decide if the plant manager is correct. Give statistical
evidence to support your conclusion.
parts vendors. There has been a defect issue with some of the electrical wiring in the
recreational vehicles manufactured at the plant. The plant manager wonders if all of the
vendors might be contributing equally to the defect issue. The plant manager reviews three
samples of quality assurance inspections from the last six months, one from each of the
vendors. The data are shown in the table below.
Test an appropriate hypothesis to decide if the plant manager is correct. Give statistical
evidence to support your conclusion.
فتح الحزمة
افتح القفل للوصول البطاقات البالغ عددها 93 في هذه المجموعة.
فتح الحزمة
k this deck
44
Gas mileage Hoping to improve the gas mileage of their cars, a car company has made an
adjustment in the manufacturing process. Random samples of automobiles coming off the
assembly line have been measured each week that the plant has been in operation. The
data from before and after the manufacturing adjustments were made are in the table. It is
believed that measurements of gas mileage are normally distributed. Write a complete
conclusion about the manufacturing adjustments based on the statistical software printout
shown below.
adjustment in the manufacturing process. Random samples of automobiles coming off the
assembly line have been measured each week that the plant has been in operation. The
data from before and after the manufacturing adjustments were made are in the table. It is
believed that measurements of gas mileage are normally distributed. Write a complete
conclusion about the manufacturing adjustments based on the statistical software printout
shown below.
فتح الحزمة
افتح القفل للوصول البطاقات البالغ عددها 93 في هذه المجموعة.
فتح الحزمة
k this deck
45
Flight costs Every year Educational Services (ETS) selects readers for the Advanced
Placement Exams. Recently the AP Statistics exam has been graded in Lincoln, Nebraska.
One objective of ETS is to achieve equity in grading by inviting teachers to be readers from
all parts of the nation. However budgets are a consideration also. The accountants at ETS
wonder if the flights from cities west of Lincoln are the same as flight costs from cities east
of Lincoln. A random sample of the expense vouchers from last year was reviewed for the
cost of airline tickets. Costs (in dollars) are shown in the table.
Indicate what inference procedure you would use to see if there is a significant difference
in the costs of airline flights between the west and east coasts to Lincoln, Nebraska, then
decide if it is okay to actually perform that inference procedure. (Check the appropriate
assumptions and conditions and indicate whether you could or could not proceed. You do
not have to do the actual test.)
Placement Exams. Recently the AP Statistics exam has been graded in Lincoln, Nebraska.
One objective of ETS is to achieve equity in grading by inviting teachers to be readers from
all parts of the nation. However budgets are a consideration also. The accountants at ETS
wonder if the flights from cities west of Lincoln are the same as flight costs from cities east
of Lincoln. A random sample of the expense vouchers from last year was reviewed for the
cost of airline tickets. Costs (in dollars) are shown in the table.
Indicate what inference procedure you would use to see if there is a significant difference
in the costs of airline flights between the west and east coasts to Lincoln, Nebraska, then
decide if it is okay to actually perform that inference procedure. (Check the appropriate
assumptions and conditions and indicate whether you could or could not proceed. You do
not have to do the actual test.)
فتح الحزمة
افتح القفل للوصول البطاقات البالغ عددها 93 في هذه المجموعة.
فتح الحزمة
k this deck
46
Packing Line A packing company investigates hiring a national training consultant to
improve productivity on their packing line. The consultant is very expensive, so they will
only hire him if they are very sure that productivity will rise. The company hires the
consultant for a one-week trial to work with 18 employees before making a final decision
about the training program. The training program will be implemented if the average units
packed per employee increases by more than 10 cases per day. The company manager will
test a hypothesis using
a. Write appropriate hypotheses (in words and in symbols).
b. In this context, which do you consider to be more serious - a Type I or a Type II error?
Explain briefly.
c. After this trial produced inconclusive results the manager decided to test the training
program again with another group of employees. Describe two changes he could make in
the trial to increase the power of the test, and explain the disadvantages of each.
improve productivity on their packing line. The consultant is very expensive, so they will
only hire him if they are very sure that productivity will rise. The company hires the
consultant for a one-week trial to work with 18 employees before making a final decision
about the training program. The training program will be implemented if the average units
packed per employee increases by more than 10 cases per day. The company manager will
test a hypothesis using
a. Write appropriate hypotheses (in words and in symbols).
b. In this context, which do you consider to be more serious - a Type I or a Type II error?
Explain briefly.
c. After this trial produced inconclusive results the manager decided to test the training
program again with another group of employees. Describe two changes he could make in
the trial to increase the power of the test, and explain the disadvantages of each.
فتح الحزمة
افتح القفل للوصول البطاقات البالغ عددها 93 في هذه المجموعة.
فتح الحزمة
k this deck
47
A high school counselor was interested in finding out how well student grade point averages (GPA) predict ACT scores. A
sample of the senior class data was reviewed to obtain GPA and ACT scores. The data are shown in the table to the right.
Create and interpret a 95% confidence interval for the slope of the regression line.
sample of the senior class data was reviewed to obtain GPA and ACT scores. The data are shown in the table to the right.
Create and interpret a 95% confidence interval for the slope of the regression line.
فتح الحزمة
افتح القفل للوصول البطاقات البالغ عددها 93 في هذه المجموعة.
فتح الحزمة
k this deck
48
A biology professor reports that historically grades in her introductory biology course have
been distributed as follows: 15% A's, 30% B's, 40% C's, 10% D's, and 5% F's. Grades in her
most recent course were distributed as follows:
a. Test an appropriate hypothesis to decide if the professor's most recent grade distribution
matches the historical distribution. Give statistical evidence to support your conclusion.
b. Which grade impacted your decision the most? Explain what this means in the context of
the problem.
been distributed as follows: 15% A's, 30% B's, 40% C's, 10% D's, and 5% F's. Grades in her
most recent course were distributed as follows:
a. Test an appropriate hypothesis to decide if the professor's most recent grade distribution
matches the historical distribution. Give statistical evidence to support your conclusion.
b. Which grade impacted your decision the most? Explain what this means in the context of
the problem.
فتح الحزمة
افتح القفل للوصول البطاقات البالغ عددها 93 في هذه المجموعة.
فتح الحزمة
k this deck
49
As part of a survey, students in a large statistics class were asked whether or not they ate
breakfast that morning. The data appears in the following table:
Is there evidence that eating breakfast is independent of the student's sex? Test an
appropriate hypothesis. Give statistical evidence to support your conclusion.
breakfast that morning. The data appears in the following table:
Is there evidence that eating breakfast is independent of the student's sex? Test an
appropriate hypothesis. Give statistical evidence to support your conclusion.
فتح الحزمة
افتح القفل للوصول البطاقات البالغ عددها 93 في هذه المجموعة.
فتح الحزمة
k this deck
50
Every year favorite songs compete to be on a Top 200 list based upon sales and rankings by the experts in the music industry.
These songs have many characteristics, such as song length and beats per minute, which vary from category to category in
the music industry. A disc jockey wondered if the number of beats per minute in songs classified as dance music were lower
than the beats per minute in the songs that are ranked on a Top 200 list from 2001. A random sample of songs from each
group was selected and the beats per minute are listed in the chart at the right. Does this sample indicate that songs classified
as dance music have lower beats per minute than the songs ranked on a Top 200 list?
Test an appropriate hypothesis and state your conclusion.
These songs have many characteristics, such as song length and beats per minute, which vary from category to category in
the music industry. A disc jockey wondered if the number of beats per minute in songs classified as dance music were lower
than the beats per minute in the songs that are ranked on a Top 200 list from 2001. A random sample of songs from each
group was selected and the beats per minute are listed in the chart at the right. Does this sample indicate that songs classified
as dance music have lower beats per minute than the songs ranked on a Top 200 list?
Test an appropriate hypothesis and state your conclusion.
فتح الحزمة
افتح القفل للوصول البطاقات البالغ عددها 93 في هذه المجموعة.
فتح الحزمة
k this deck
51
Great Britain has a great literary tradition that spans centuries. One might assume, then, that Britons read more than citizens
of other countries. Some Canadians, however, feel that a higher percentage of Canadians than Britons read. A recent Gallup
Poll reported that 86% of 1004 randomly sampled Canadians read at least one book in the past year, compared to 81% of 1009
randomly sampled Britons. Do these results confirm a higher reading rate in Canada?
Test an appropriate hypothesis and state your conclusions.
فتح الحزمة
افتح القفل للوصول البطاقات البالغ عددها 93 في هذه المجموعة.
فتح الحزمة
k this deck
52
Peanut M&Ms According to the Mars Candy Company, peanut M&M's are 12% brown,
15% yellow, 12% red, 23% blue, 23% orange, and 15% green. On a Saturday when you have
run out of statistics homework, you decide to test this claim. You purchase a medium bag
of peanut M&M's and find 39 browns, 44 yellows, 36 red, 78 blue, 73 orange, and 48 greens.
Test an appropriate hypothesis and state your conclusion.
فتح الحزمة
افتح القفل للوصول البطاقات البالغ عددها 93 في هذه المجموعة.
فتح الحزمة
k this deck
53
A high school counselor was interested in finding out how well student grade point averages (GPA) predict ACT scores. A
sample of the senior class data was reviewed to obtain GPA and ACT scores. The data are shown in the table to the right.
Is there evidence of an association between GPA and ACT score? Test an appropriate
hypothesis and state your conclusion in the proper context.
sample of the senior class data was reviewed to obtain GPA and ACT scores. The data are shown in the table to the right.
Is there evidence of an association between GPA and ACT score? Test an appropriate
hypothesis and state your conclusion in the proper context.
فتح الحزمة
افتح القفل للوصول البطاقات البالغ عددها 93 في هذه المجموعة.
فتح الحزمة
k this deck
54
A college admissions counselor was interested in finding out how well high school grade point averages (HS GPA) predict
first-year college GPAs (FY GPA). A random sample of data from first-year students was reviewed to obtain high school and
first-year college GPAs. The data are shown below:
Create and interpret a 95% confidence interval for the slope of the regression line.
first-year college GPAs (FY GPA). A random sample of data from first-year students was reviewed to obtain high school and
first-year college GPAs. The data are shown below:
Create and interpret a 95% confidence interval for the slope of the regression line.
فتح الحزمة
افتح القفل للوصول البطاقات البالغ عددها 93 في هذه المجموعة.
فتح الحزمة
k this deck
55
A soft drink company is conducting research to select a new design for the can. A random
sample of participants has been selected. Instead of a typical taste test with two different
sodas, they actually give each participant the same soda twice. One drink is served in a
predominantly red can, the other in a predominantly blue can. The order is chosen
randomly. Participants are asked to rate each drink on a scale of 1 to 10. Thus, the company
wishes to test if the color of the can influences the rating. The ratings were recorded for
each participant. The data are shown in the table below. Does this sample indicate that
there is a difference in the ratings? Test an appropriate hypothesis and state your
conclusion.
sample of participants has been selected. Instead of a typical taste test with two different
sodas, they actually give each participant the same soda twice. One drink is served in a
predominantly red can, the other in a predominantly blue can. The order is chosen
randomly. Participants are asked to rate each drink on a scale of 1 to 10. Thus, the company
wishes to test if the color of the can influences the rating. The ratings were recorded for
each participant. The data are shown in the table below. Does this sample indicate that
there is a difference in the ratings? Test an appropriate hypothesis and state your
conclusion.
فتح الحزمة
افتح القفل للوصول البطاقات البالغ عددها 93 في هذه المجموعة.
فتح الحزمة
k this deck
56
Auto repairs An insurance company hopes to save money on repairs to autos involved in
accidents. Two body shops in town seem to do most of the repairs, and the company
wonders whether one of them is generally cheaper than the other. From their files of
payments made during the past year they select a random sample of ten bills they paid at
each repair shop. The data are shown in the table.
Indicate what inference procedure you would use to see if there is a significant difference
in the costs of repairs done at these two body shops, then decide if it is okay to actually
perform that inference procedure. (Check the appropriate assumptions and conditions and
indicate whether you could or could not proceed. You do not have to do the actual test.)
accidents. Two body shops in town seem to do most of the repairs, and the company
wonders whether one of them is generally cheaper than the other. From their files of
payments made during the past year they select a random sample of ten bills they paid at
each repair shop. The data are shown in the table.
Indicate what inference procedure you would use to see if there is a significant difference
in the costs of repairs done at these two body shops, then decide if it is okay to actually
perform that inference procedure. (Check the appropriate assumptions and conditions and
indicate whether you could or could not proceed. You do not have to do the actual test.)
فتح الحزمة
افتح القفل للوصول البطاقات البالغ عددها 93 في هذه المجموعة.
فتح الحزمة
k this deck
57
Scrubbers A factory recently installed new pollution control equipment ("scrubbers") on its
smokestacks in hopes of reducing air pollution levels at a nearby national park. Randomly
timed measurements of sulfate levels (in micrograms per cubic meter) were taken before
(Set C1) and after (Set C2) the installation. We believe that measurements of sulfate levels
are normally distributed. Write a complete conclusion about the effectiveness of these
scrubbers based on the statistical software printout shown.
smokestacks in hopes of reducing air pollution levels at a nearby national park. Randomly
timed measurements of sulfate levels (in micrograms per cubic meter) were taken before
(Set C1) and after (Set C2) the installation. We believe that measurements of sulfate levels
are normally distributed. Write a complete conclusion about the effectiveness of these
scrubbers based on the statistical software printout shown.
فتح الحزمة
افتح القفل للوصول البطاقات البالغ عددها 93 في هذه المجموعة.
فتح الحزمة
k this deck
58
In the study "The Role of Sports as a Social Determinant for Children," student respondents in
grades 4 through 6 were asked what they would most like to do at school: make good
grades, be popular or be good at sports. Results delineated by type of school district are
reported below.
Source: Chase, M.A and Dummer, G.M. (1992), "The Role of Sports as a Social Determinant for
Children," Research Quarterly for Exercise and Sport, 63, 418-424.
Is there evidence that type of school district and personal school goals are independent?
Test an appropriate hypothesis. Give Statistical evidence to support your conclusion.
grades 4 through 6 were asked what they would most like to do at school: make good
grades, be popular or be good at sports. Results delineated by type of school district are
reported below.
Source: Chase, M.A and Dummer, G.M. (1992), "The Role of Sports as a Social Determinant for
Children," Research Quarterly for Exercise and Sport, 63, 418-424.
Is there evidence that type of school district and personal school goals are independent?
Test an appropriate hypothesis. Give Statistical evidence to support your conclusion.
فتح الحزمة
افتح القفل للوصول البطاقات البالغ عددها 93 في هذه المجموعة.
فتح الحزمة
k this deck
59
Autos Hoping to improve the gas mileage of their cars, a car company has made an
adjustment in the manufacturing process. Random samples of automobiles coming off the
assembly line have been measured each week that the plant has been in operation. The
data from before and after the manufacturing adjustments were made are in the table. It is
believed that measurements of gas mileage are normally distributed. Write a complete
conclusion about the manufacturing adjustments based on the statistical software printout
shown below.
adjustment in the manufacturing process. Random samples of automobiles coming off the
assembly line have been measured each week that the plant has been in operation. The
data from before and after the manufacturing adjustments were made are in the table. It is
believed that measurements of gas mileage are normally distributed. Write a complete
conclusion about the manufacturing adjustments based on the statistical software printout
shown below.
فتح الحزمة
افتح القفل للوصول البطاقات البالغ عددها 93 في هذه المجموعة.
فتح الحزمة
k this deck
60
AP Grading Every year Educational Testing Services (ETS) selects graders for the
Advanced Placement (AP) Exams. Recently the AP Statistics exam has been graded in
Lincoln, Nebraska. One objective of ETS is to have consistent grading by inviting graders
from all over the nation. However travel expenses are an issue. The accountants at ETS
wonder if the flight costs from cities west of Lincoln are the same as flight costs from cities
east of Lincoln. A random sample of the expense vouchers from last year was reviewed for
the cost of airline tickets. The data are shown in the table below. Indicate what inference
procedure you would use to see if there is a significant difference in the costs of airline
flights to Lincoln from the west and from the east, then decide if it is okay to actually
perform that inference procedure.
(Check the appropriate assumptions and conditions and indicate whether you could or
could not proceed. You do not have to do the actual test.)
Advanced Placement (AP) Exams. Recently the AP Statistics exam has been graded in
Lincoln, Nebraska. One objective of ETS is to have consistent grading by inviting graders
from all over the nation. However travel expenses are an issue. The accountants at ETS
wonder if the flight costs from cities west of Lincoln are the same as flight costs from cities
east of Lincoln. A random sample of the expense vouchers from last year was reviewed for
the cost of airline tickets. The data are shown in the table below. Indicate what inference
procedure you would use to see if there is a significant difference in the costs of airline
flights to Lincoln from the west and from the east, then decide if it is okay to actually
perform that inference procedure.
(Check the appropriate assumptions and conditions and indicate whether you could or
could not proceed. You do not have to do the actual test.)
فتح الحزمة
افتح القفل للوصول البطاقات البالغ عددها 93 في هذه المجموعة.
فتح الحزمة
k this deck
61
In a local school, vending machines offer a range of drinks from juices to sports drinks. The
purchasing agent thinks each type of drink is equally favored among the students buying
drinks from the machines. The recent purchasing choices from the vending machines are
shown in the table.
a. Test an appropriate hypothesis to decide if the purchasing agent is correct. Give
statistical evidence to support your conclusion.
b. Which type of drink impacted your decision the most? Explain what this means in the
context of the problem.
purchasing agent thinks each type of drink is equally favored among the students buying
drinks from the machines. The recent purchasing choices from the vending machines are
shown in the table.
a. Test an appropriate hypothesis to decide if the purchasing agent is correct. Give
statistical evidence to support your conclusion.
b. Which type of drink impacted your decision the most? Explain what this means in the
context of the problem.
فتح الحزمة
افتح القفل للوصول البطاقات البالغ عددها 93 في هذه المجموعة.
فتح الحزمة
k this deck
62
Cloning A random sample of 800 adults was asked the following question: "Do you think
current laws concerning the use of cloning for medical research are too strict, too lenient, or about
right?" The pollsters also classified the respondents with respect to highest education level
attained: high school, 2- year college degree, 4-year degree, or advanced degree. We wish
to know if attitudes on cloning are related to education level. (All the conditions are
satisfied - don't worry about checking them.)
a. Write appropriate hypotheses.
b. Suppose the expected counts had not been given. Show how to calculate the expected
count in the first cell (106.01).
c. How many degrees of freedom? Explain.
d. State your complete conclusion in context.
current laws concerning the use of cloning for medical research are too strict, too lenient, or about
right?" The pollsters also classified the respondents with respect to highest education level
attained: high school, 2- year college degree, 4-year degree, or advanced degree. We wish
to know if attitudes on cloning are related to education level. (All the conditions are
satisfied - don't worry about checking them.)
a. Write appropriate hypotheses.
b. Suppose the expected counts had not been given. Show how to calculate the expected
count in the first cell (106.01).
c. How many degrees of freedom? Explain.
d. State your complete conclusion in context.
فتح الحزمة
افتح القفل للوصول البطاقات البالغ عددها 93 في هذه المجموعة.
فتح الحزمة
k this deck
63
A sports analyst was interested in finding out how well a football team's winning
percentage (stated as a proportion) can be predicted based upon points scored and points
allowed. She selects a random sample of 15 football teams. Each team played 10 games.
She decided to use the point differential, points scored minus points allowed as the
predictor variable. The data are shown in the table and regression output given below.
percentage (stated as a proportion) can be predicted based upon points scored and points
allowed. She selects a random sample of 15 football teams. Each team played 10 games.
She decided to use the point differential, points scored minus points allowed as the
predictor variable. The data are shown in the table and regression output given below.
فتح الحزمة
افتح القفل للوصول البطاقات البالغ عددها 93 في هذه المجموعة.
فتح الحزمة
k this deck
64
When two competing teams are equally matched, the probability that each team wins any
game is 0.5. The NBA championship goes to the team that wins four games in a best-of
seven series. If the teams were equally matched, the probability that the final series ends
with one of the teams sweeping four straight games would be 2(0.5)4 = 0.125. Further
probability calculations indicate that 25% of these series should last five games, 31.25%
should last six games, and the other 31.25% should last the full seven games. The table
shows the number of games it took to decide each of the last 57 NBA champs. Do you think
the teams are usually equally matched? Give statistical evidence to support your
conclusion.
game is 0.5. The NBA championship goes to the team that wins four games in a best-of
seven series. If the teams were equally matched, the probability that the final series ends
with one of the teams sweeping four straight games would be 2(0.5)4 = 0.125. Further
probability calculations indicate that 25% of these series should last five games, 31.25%
should last six games, and the other 31.25% should last the full seven games. The table
shows the number of games it took to decide each of the last 57 NBA champs. Do you think
the teams are usually equally matched? Give statistical evidence to support your
conclusion.
فتح الحزمة
افتح القفل للوصول البطاقات البالغ عددها 93 في هذه المجموعة.
فتح الحزمة
k this deck
65
Most people are definitely dominant on one side of their body - either right or left. For some sports being able to use both
sides is an advantage, such as batting in baseball or softball. In order to determine if there is a difference in strength between
the dominant and nondominant sides, a few switch-hitting members of some school baseball and softball teams were asked
to hit from both sides of the plate during batting practice. The longest hit (in feet) from each side was recorded for each
player. The data are shown in the table below.
Create and interpret a 95% confidence interval.
فتح الحزمة
افتح القفل للوصول البطاقات البالغ عددها 93 في هذه المجموعة.
فتح الحزمة
k this deck
66
Most people are definitely dominant on one side of their body - either right or left. For some sports being able to use both
sides is an advantage, such as batting in baseball or softball. In order to determine if there is a difference in strength between
the dominant and nondominant sides, a few switch-hitting members of some school baseball and softball teams were asked
to hit from both sides of the plate during batting practice. The longest hit (in feet) from each side was recorded for each
player. The data are shown in the table below.
Does this sample indicate that there is a difference in the distance a ball is hit by batters
who are switch-hitters? Test an appropriate hypothesis and state your conclusion.
فتح الحزمة
افتح القفل للوصول البطاقات البالغ عددها 93 في هذه المجموعة.
فتح الحزمة
k this deck
67
Could eye color be a warning signal for hearing loss in patients suffering from meningitis?
British researcher Helen Cullington recorded the eye color of 130 deaf patients, and noted
whether the patient's deafness had developed following treatment for meningitis. Her data
are summarized in the table below. Test an appropriate hypothesis and state your
conclusion.
British researcher Helen Cullington recorded the eye color of 130 deaf patients, and noted
whether the patient's deafness had developed following treatment for meningitis. Her data
are summarized in the table below. Test an appropriate hypothesis and state your
conclusion.
فتح الحزمة
افتح القفل للوصول البطاقات البالغ عددها 93 في هذه المجموعة.
فتح الحزمة
k this deck
68
Housing costs A government report on housing costs says that single-family home prices
nationwide are skewed to the right, with a mean of $235,700. We want to see how home
prices in Orange County, California compare with those nationwide.
a. We collect price data from a random sample of 50 homes in Orange County, California.
Why is it okay to use these data for inference even though the population is skewed?
b. The standard deviation of the 50 homes in our sample was $25,500. Specify the sampling
model for the mean price of such samples.
c. This sample of randomly chosen homes produced a 90% confidence interval for the
mean price in Orange County of ($233954, $246046). Does this interval provide evidence
that single-family home prices are unusually high in this county? Explain briefly.
d. Suppose we want to collect a new sample. How many homes must we survey to have
90% confidence of estimating the mean local price to within $2000?
فتح الحزمة
افتح القفل للوصول البطاقات البالغ عددها 93 في هذه المجموعة.
فتح الحزمة
k this deck
69
Poverty In a study of how the burden of poverty varies among U. S. regions, a random
sample of 1000 individuals from each region of the United States recently yielded the
information on poverty (based on defining the poverty level as an income below $10,400
for a family of 4 people). The data and calculation of the test statistic is shown in the table
below. (All the conditions are satisfied - don'ft worry about checking them.)
a. Write appropriate hypotheses.
b. Suppose the expected values had not been given. Show exactly how to calculate the
expected count in the first cell.
c. How many degrees of freedom are there?
d. State your complete conclusion in context.
sample of 1000 individuals from each region of the United States recently yielded the
information on poverty (based on defining the poverty level as an income below $10,400
for a family of 4 people). The data and calculation of the test statistic is shown in the table
below. (All the conditions are satisfied - don'ft worry about checking them.)
a. Write appropriate hypotheses.
b. Suppose the expected values had not been given. Show exactly how to calculate the
expected count in the first cell.
c. How many degrees of freedom are there?
d. State your complete conclusion in context.
فتح الحزمة
افتح القفل للوصول البطاقات البالغ عددها 93 في هذه المجموعة.
فتح الحزمة
k this deck
70
A San Jose State student collects data from 20 students. He compares the number of classes a student is enrolled in to their
GPA. Here are the results of the regression analysis. The conditions for inference are satisfied.
What is the correlation coefficient for this relationship? Interpret this result in context.
GPA. Here are the results of the regression analysis. The conditions for inference are satisfied.
What is the correlation coefficient for this relationship? Interpret this result in context.
فتح الحزمة
افتح القفل للوصول البطاقات البالغ عددها 93 في هذه المجموعة.
فتح الحزمة
k this deck
71
In 2010, the United Nations claimed that there was a higher rate of illiteracy in men than in women from the country of
Qatar. A humanitarian organization went to Qatar to conduct a random sample. The results revealed that 45 out of 234 men
and 42 out of 251 women were classified as illiterate on the same measurement test. Do these results indicate that the United
Nations findings were correct?
Find a 95% confidence level for the difference in the proportions of illiteracy in men and
women from Qatar. Interpret your interval.
فتح الحزمة
افتح القفل للوصول البطاقات البالغ عددها 93 في هذه المجموعة.
فتح الحزمة
k this deck
72
a. Which takes less time to travel to work-car or train? We select a random sample of 45
businessmen, observe them commuting using both methods, and compare their travel
times.
b. A college professor wonders if two versions (A and
B) of his exam are equally difficult.
He randomly mixes 20 Version A's and 20 Version B's together and passes them out to his
40 students. After grading the exams, he compares the scores for the two versions.
c. Forty people complaining of allergies take an antihistamine. They report that their
discomfort subsided in an average of 18 minutes; the standard deviation was 4 minutes.
The manufacturer wants a 95% confidence interval for the "relief time".
d. A health professional selected a random sample of 100 patients from each of four major
hospital emergency rooms to see if the major reasons for emergency room visits are similar
in all four major hospitals. The major reason categories are accident, illegal activity, illness,
or other.
e. A policeman believes that about 40% of older drivers speed on highways, but a
confidential survey found that 49 of 88 randomly selected older drivers admitted speeding
on highways at least once. Is this strong evidence that the policeman was wrong?
f. According to United Nations Population Division, the age distribution of the
Commonwealth of Australia is: 21% less than 15 years of age, 67% between 15 and 65 years
of age, and 12% are over 65 years old. A random sample of 210 residents of Canberra
revealed 40 were less than 15 years of age, 145 were between 15 and 65 years of age, and 25
were over 65 years old. Is Canberra unusual in any way?
g. Among a random sample of college-age students, 6% of the 473 men said they had been
adopted, compared to only 4% of the 552 women. Does this indicate a significant difference
between adoption rates of males and females in college-age students?
فتح الحزمة
افتح القفل للوصول البطاقات البالغ عددها 93 في هذه المجموعة.
فتح الحزمة
k this deck
73
One common method of evaluating the performance of a mutual fund is to compare its returns to those of a recognized
benchmark such as an index of the returns on all securities of the type that the fund accumulates. The Janus Worldwide Fund
considers its benchmark to be the MSCI World IndexSM. The table below depicts the annual returns (percent) for a recent
ten-year period. Is this fund a good investment? That is, does this fund significantly outperform its benchmark? Source:
https://ww3.janus.com/advisor/Documents/Advisor%20Lit%20System/Fact%20Sheets/4Q12%20Fact%20Sheet%20(Janus%20Worldw
ide%20Fund-Class%20A)_exp%2004-15-13.pdf
Explain clearly whether this data should be analyzed using a 2-sample t test approach or a
match pairs t-test method.
benchmark such as an index of the returns on all securities of the type that the fund accumulates. The Janus Worldwide Fund
considers its benchmark to be the MSCI World IndexSM. The table below depicts the annual returns (percent) for a recent
ten-year period. Is this fund a good investment? That is, does this fund significantly outperform its benchmark?
Source:https://ww3.janus.com/advisor/Documents/Advisor%20Lit%20System/Fact%20Sheets/4Q12%20Fact%20Sheet%20(Janus%20Worldw
ide%20Fund-Class%20A)_exp%2004-15-13.pdf
Explain clearly whether this data should be analyzed using a 2-sample t test approach or a
match pairs t-test method.
فتح الحزمة
افتح القفل للوصول البطاقات البالغ عددها 93 في هذه المجموعة.
فتح الحزمة
k this deck
74
A San Jose State student collects data from 20 students. He compares the number of classes a student is enrolled in to their
GPA. Here are the results of the regression analysis. The conditions for inference are satisfied.
Find and interpret a 95% confidence interval for the slope of the regression equation.
GPA. Here are the results of the regression analysis. The conditions for inference are satisfied.
Find and interpret a 95% confidence interval for the slope of the regression equation.
فتح الحزمة
افتح القفل للوصول البطاقات البالغ عددها 93 في هذه المجموعة.
فتح الحزمة
k this deck
75
Haircuts You need to find a new hair stylist and know that there are two terrific salons in
your area, Hair by Charles and Curl Up & Dye. You want a really good haircut, but you do
not want to pay too much for the cut. A random sample of costs for 10 different stylists was
taken at each salon (each salon employs over 100 stylists).
a. Indicate what inference procedure you would use to see if there is a significant
difference in the costs for haircuts at each salon. Check the appropriate assumptions and
conditions and indicate whether you could or could nor proceed. (Do not do the actual
test.)
b. A friend tells you that he has heard that Curl Up & Dye is the more expensive salon.
i. Write hypotheses for your friend's claim.
ii. The following are computer outputs. Which output is the correct one to use for this
test? Explain.
iii. Use the appropriate computer output to make a conclusion about the hypothesis
test based on the data. Make sure to state your conclusion in context.
your area, Hair by Charles and Curl Up & Dye. You want a really good haircut, but you do
not want to pay too much for the cut. A random sample of costs for 10 different stylists was
taken at each salon (each salon employs over 100 stylists).
a. Indicate what inference procedure you would use to see if there is a significant
difference in the costs for haircuts at each salon. Check the appropriate assumptions and
conditions and indicate whether you could or could nor proceed. (Do not do the actual
test.)
b. A friend tells you that he has heard that Curl Up & Dye is the more expensive salon.
i. Write hypotheses for your friend's claim.
ii. The following are computer outputs. Which output is the correct one to use for this
test? Explain.
iii. Use the appropriate computer output to make a conclusion about the hypothesis
test based on the data. Make sure to state your conclusion in context.
فتح الحزمة
افتح القفل للوصول البطاقات البالغ عددها 93 في هذه المجموعة.
فتح الحزمة
k this deck
76
A total of 23 Gossett High School students were admitted to State University. Of those
students, 7 were offered athletic scholarships. The school's guidance counselor looked at their
composite ACT scores (shown in the tabl, wondering if State U. might admit people with
lower scores if they also were athletes. Assuming that this group of students is representative
of students throughout the state, what do you think?
Create and interpret a 90% confidence interval.
students, 7 were offered athletic scholarships. The school's guidance counselor looked at their
composite ACT scores (shown in the tabl, wondering if State U. might admit people with
lower scores if they also were athletes. Assuming that this group of students is representative
of students throughout the state, what do you think?
Create and interpret a 90% confidence interval.
فتح الحزمة
افتح القفل للوصول البطاقات البالغ عددها 93 في هذه المجموعة.
فتح الحزمة
k this deck
77
Blood pressure Researchers developing new drugs must be concerned about possible side
effects. They must check a new medication for arthritis to be sure that it does not cause an
unsafe increase in blood pressure. They measure the blood pressures of a group of 12
subjects, then administer the drug and recheck the blood pressures one hour later. The
drug will be approved for use unless there is evidence that blood pressure has increased an
average of more than 20 points. They will test a hypothesis using
a. Write appropriate hypotheses (in words and in symbols).
b. In this context, which do you consider to be more serious - a Type I or a Type II error?
Explain briefly.
c. After this experiment produced inconclusive results the researchers decided to test the
drug again another group of patients. Describe two changes they could make in their
experiment to increase the power of their test, and explain the disadvantages of each.
effects. They must check a new medication for arthritis to be sure that it does not cause an
unsafe increase in blood pressure. They measure the blood pressures of a group of 12
subjects, then administer the drug and recheck the blood pressures one hour later. The
drug will be approved for use unless there is evidence that blood pressure has increased an
average of more than 20 points. They will test a hypothesis using
a. Write appropriate hypotheses (in words and in symbols).
b. In this context, which do you consider to be more serious - a Type I or a Type II error?
Explain briefly.
c. After this experiment produced inconclusive results the researchers decided to test the
drug again another group of patients. Describe two changes they could make in their
experiment to increase the power of their test, and explain the disadvantages of each.
فتح الحزمة
افتح القفل للوصول البطاقات البالغ عددها 93 في هذه المجموعة.
فتح الحزمة
k this deck
78
College admissions According to information from a college admissions office, 62% of the
students there attended public high schools, 26% attended private high schools, 2% were
home schooled, and the remaining students attended schools in other countries. Among
this college's Honors Graduates last year there were 47 who came from public schools, 29
from private schools, 4 who had been home schooled, and 4 students from abroad. Is there
any evidence that one type of high school might better equip students to attain high
academic honors at this college? Test an appropriate hypothesis and state your conclusion.
فتح الحزمة
افتح القفل للوصول البطاقات البالغ عددها 93 في هذه المجموعة.
فتح الحزمة
k this deck
79
Before you took this course, you probably heard many stories about Statistics courses. Oftentimes parents of students have
had bad experiences with Statistics courses and pass on their anxieties to their children. To test whether actually taking
Statistics decreases students' anxieties about Statistics, a Statistics instructor gave a test to rate student anxiety at the
beginning and end of his course. Anxiety levels were measured on a scale of 0-10. Here are the data for 16 randomly chosen
students from a class of 180 students:
Create and interpret a 90% confidence interval.
had bad experiences with Statistics courses and pass on their anxieties to their children. To test whether actually taking
Statistics decreases students' anxieties about Statistics, a Statistics instructor gave a test to rate student anxiety at the
beginning and end of his course. Anxiety levels were measured on a scale of 0-10. Here are the data for 16 randomly chosen
students from a class of 180 students:
Create and interpret a 90% confidence interval.
فتح الحزمة
افتح القفل للوصول البطاقات البالغ عددها 93 في هذه المجموعة.
فتح الحزمة
k this deck
80
One common method of evaluating the performance of a mutual fund is to compare its returns to those of a recognized
benchmark such as an index of the returns on all securities of the type that the fund accumulates. The Janus Worldwide Fund
considers its benchmark to be the MSCI World IndexSM. The table below depicts the annual returns (percent) for a recent
ten-year period. Is this fund a good investment? That is, does this fund significantly outperform its benchmark? Source:
https://ww3.janus.com/advisor/Documents/Advisor%20Lit%20System/Fact%20Sheets/4Q12%20Fact%20Sheet%20(Janus%20Worldw
ide%20Fund-Class%20A)_exp%2004-15-13.pdf
Carry out the appropriate test and state your conclusion in context.
benchmark such as an index of the returns on all securities of the type that the fund accumulates. The Janus Worldwide Fund
considers its benchmark to be the MSCI World IndexSM. The table below depicts the annual returns (percent) for a recent
ten-year period. Is this fund a good investment? That is, does this fund significantly outperform its benchmark?
Source:https://ww3.janus.com/advisor/Documents/Advisor%20Lit%20System/Fact%20Sheets/4Q12%20Fact%20Sheet%20(Janus%20Worldw
ide%20Fund-Class%20A)_exp%2004-15-13.pdf
Carry out the appropriate test and state your conclusion in context.
فتح الحزمة
افتح القفل للوصول البطاقات البالغ عددها 93 في هذه المجموعة.
فتح الحزمة
k this deck
فتح الحزمة
افتح القفل للوصول البطاقات البالغ عددها 93 في هذه المجموعة.


