Deck 9: Inferences From Two Samples
ملء الشاشة (f)
سؤال
سؤال
سؤال
سؤال
سؤال
سؤال
سؤال
سؤال
سؤال
سؤال
سؤال
سؤال
سؤال
Provide an appropriate response.
Complete the table to describe each symbol.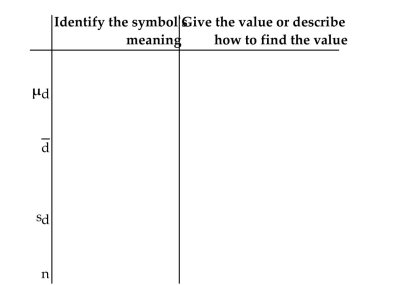
Complete the table to describe each symbol.
سؤال
سؤال
سؤال
سؤال
سؤال
سؤال
سؤال
سؤال
سؤال
سؤال
سؤال
سؤال
سؤال
سؤال
سؤال
سؤال
سؤال
سؤال
سؤال
سؤال
سؤال
سؤال
سؤال
سؤال
سؤال
سؤال
سؤال
سؤال
سؤال
سؤال
سؤال
سؤال
Solve the problem.
To test the null hypothesis that the difference between two population proportions is equal to a nonzero constant c, use the test statistic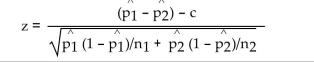
To test the null hypothesis that the difference between two population proportions is equal to a nonzero constant c, use the test statistic
سؤال
سؤال
سؤال
سؤال
سؤال
سؤال
سؤال
سؤال
سؤال
سؤال
سؤال
سؤال
سؤال
سؤال
سؤال
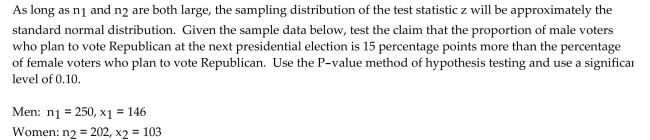
Solve the problem.
To test the null hypothesis that the difference between two population proportions is equal to a nonzero constant c, use the test statistic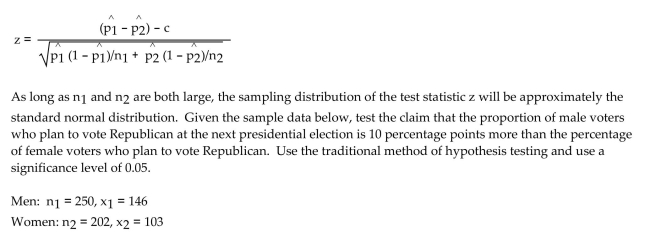
To test the null hypothesis that the difference between two population proportions is equal to a nonzero constant c, use the test statistic
سؤال
سؤال
سؤال
سؤال
سؤال
سؤال
سؤال
سؤال
سؤال
سؤال
سؤال
سؤال
سؤال
سؤال
Use the traditional method of hypothesis testing to test the given claim about the means of two populations. Assume that
two dependent samples have been randomly selected from normally distributed populations.
Five students took a math test before and after tutoring. Their scores were as follows.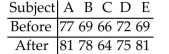 Using a 0.01 level of significance, test the claim that the tutoring has an effect on the math scores.
two dependent samples have been randomly selected from normally distributed populations.
Five students took a math test before and after tutoring. Their scores were as follows.
Using a 0.01 level of significance, test the claim that the tutoring has an effect on the math scores. سؤال
سؤال
سؤال
سؤال
سؤال
سؤال

فتح الحزمة
قم بالتسجيل لفتح البطاقات في هذه المجموعة!
Unlock Deck
Unlock Deck
1/105
العب
ملء الشاشة (f)
Deck 9: Inferences From Two Samples
1
Provide an appropriate response.
Discuss the assumptions for constructing confidence intervals or hypothesis testing for two means from dependent samples.
Discuss the assumptions for constructing confidence intervals or hypothesis testing for two means from dependent samples.
1)Two dependent samples must be selected randomly.
2)Each of the populations from which the samples are drawn must be normally distributed.
2)Each of the populations from which the samples are drawn must be normally distributed.
2
From the sample statistics, find the value of used to test the hypothesis that the population proportions are equal
-
A)
B)
C)
D)
-
A)
B)
C)
D)
3
Provide an appropriate response.
Describe the process for testing hypothesis about two means when the samples are dependent. Compare this process to the methods of hypothesis testing for one mean in Chapter 7.
Describe the process for testing hypothesis about two means when the samples are dependent. Compare this process to the methods of hypothesis testing for one mean in Chapter 7.
When the samples are dependent, the differences are computed for each pair of values. Then the mean
and standard deviation are computed. The process proceeds exactly like the process in Chapter 7 for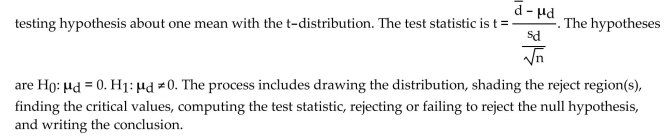
and standard deviation are computed. The process proceeds exactly like the process in Chapter 7 for
4
Provide an appropriate response.
-What is the effect on the P-value when a test is changed from two-tailed hypothesis with = and ? to one-tailed hypothesis such as and
-What is the effect on the P-value when a test is changed from two-tailed hypothesis with = and ? to one-tailed hypothesis such as and
فتح الحزمة
افتح القفل للوصول البطاقات البالغ عددها 105 في هذه المجموعة.
فتح الحزمة
k this deck
5
From the sample statistics, find the value of used to test the hypothesis that the population proportions are equal
-
A)
B)
C)
D)
-
A)
B)
C)
D)
فتح الحزمة
افتح القفل للوصول البطاقات البالغ عددها 105 في هذه المجموعة.
فتح الحزمة
k this deck
6
Provide an appropriate response.
Describe the process for testing hypothesis about two means when the samples are independent and large. Compare this process to the methods of hypothesis testing for one mean in Chapter 7.
Describe the process for testing hypothesis about two means when the samples are independent and large. Compare this process to the methods of hypothesis testing for one mean in Chapter 7.
فتح الحزمة
افتح القفل للوصول البطاقات البالغ عددها 105 في هذه المجموعة.
فتح الحزمة
k this deck
7
Compute the test statistic used to test the null hypothesis that p1 = p2
-In a vote on the Clean Water bill, 45% of the 205 Democrats voted for the bill while 52% of the 230 Republicans voted for it.
A)-1.604
B)-1.239
C)-0.875
D)-1.458
-In a vote on the Clean Water bill, 45% of the 205 Democrats voted for the bill while 52% of the 230 Republicans voted for it.
A)-1.604
B)-1.239
C)-0.875
D)-1.458
فتح الحزمة
افتح القفل للوصول البطاقات البالغ عددها 105 في هذه المجموعة.
فتح الحزمة
k this deck
8
Find the number of successes x suggested by the given statement.
A computer manufacturer randomly selects 2140 of its computers for quality assurance and finds that 2.76% of these computers are found to be defective.
A)57
B)62
C)64
D)59
A computer manufacturer randomly selects 2140 of its computers for quality assurance and finds that 2.76% of these computers are found to be defective.
A)57
B)62
C)64
D)59
فتح الحزمة
افتح القفل للوصول البطاقات البالغ عددها 105 في هذه المجموعة.
فتح الحزمة
k this deck
9
From the sample statistics, find the value of used to test the hypothesis that the population proportions are equal
-
A)0.125
B)0.395
C)0.312
D)0.156
-
A)0.125
B)0.395
C)0.312
D)0.156
فتح الحزمة
افتح القفل للوصول البطاقات البالغ عددها 105 في هذه المجموعة.
فتح الحزمة
k this deck
10
Find the number of successes x suggested by the given statement.
Among 900 people selected randomly from among the residents of one city, 14.33% were found to be living below the official poverty line.
A)126
B)129
C)132
D)130
Among 900 people selected randomly from among the residents of one city, 14.33% were found to be living below the official poverty line.
A)126
B)129
C)132
D)130
فتح الحزمة
افتح القفل للوصول البطاقات البالغ عددها 105 في هذه المجموعة.
فتح الحزمة
k this deck
11
Compute the test statistic used to test the null hypothesis that p1 = p2
-
A)4.086
B)0.159
C)2.200
D)0.364
-
A)4.086
B)0.159
C)2.200
D)0.364
فتح الحزمة
افتح القفل للوصول البطاقات البالغ عددها 105 في هذه المجموعة.
فتح الحزمة
k this deck
12
Provide an appropriate response.
-Compare the technique for decision making about populations using the hypothesis test method and the confidence interval method.
-Compare the technique for decision making about populations using the hypothesis test method and the confidence interval method.
فتح الحزمة
افتح القفل للوصول البطاقات البالغ عددها 105 في هذه المجموعة.
فتح الحزمة
k this deck
13
Provide an appropriate response.
Complete the table to describe each symbol.
Complete the table to describe each symbol.
فتح الحزمة
افتح القفل للوصول البطاقات البالغ عددها 105 في هذه المجموعة.
فتح الحزمة
k this deck
14
Provide an appropriate response.
- possibilities for this test statistic. Explain the circumstances under which the conclusion would be either that the variances are equal or that the variances are not equal.
- possibilities for this test statistic. Explain the circumstances under which the conclusion would be either that the variances are equal or that the variances are not equal.
فتح الحزمة
افتح القفل للوصول البطاقات البالغ عددها 105 في هذه المجموعة.
فتح الحزمة
k this deck
15
Find the number of successes x suggested by the given statement.
Among 1450 randomly selected car drivers in one city, 7.52% said that they had been involved in an accident during the past year.
A)110
B)108
C)109
D)107
Among 1450 randomly selected car drivers in one city, 7.52% said that they had been involved in an accident during the past year.
A)110
B)108
C)109
D)107
فتح الحزمة
افتح القفل للوصول البطاقات البالغ عددها 105 في هذه المجموعة.
فتح الحزمة
k this deck
16
Provide an appropriate response.
Define independent and dependent samples and give an example of each.
Define independent and dependent samples and give an example of each.
فتح الحزمة
افتح القفل للوصول البطاقات البالغ عددها 105 في هذه المجموعة.
فتح الحزمة
k this deck
17
Find the number of successes x suggested by the given statement.
Among 620 adults selected randomly from among the residents of one town, 25% said that they favor stronger gun-control laws.
A)153
B)154
C)156
D)155
Among 620 adults selected randomly from among the residents of one town, 25% said that they favor stronger gun-control laws.
A)153
B)154
C)156
D)155
فتح الحزمة
افتح القفل للوصول البطاقات البالغ عددها 105 في هذه المجموعة.
فتح الحزمة
k this deck
18
From the sample statistics, find the value of used to test the hypothesis that the population proportions are equal
-
A)0.467
B)0.156
C)0.390
D)0.312
-
A)0.467
B)0.156
C)0.390
D)0.312
فتح الحزمة
افتح القفل للوصول البطاقات البالغ عددها 105 في هذه المجموعة.
فتح الحزمة
k this deck
19
Provide an appropriate response.
-How does finding the error estimate and confidence intervals for dependent samples compare to the methods for one mean from Chapter 7?
-How does finding the error estimate and confidence intervals for dependent samples compare to the methods for one mean from Chapter 7?
فتح الحزمة
افتح القفل للوصول البطاقات البالغ عددها 105 في هذه المجموعة.
فتح الحزمة
k this deck
20
From the sample statistics, find the value of used to test the hypothesis that the population proportions are equal
-
A)
B)
C)
D)
-
A)
B)
C)
D)
فتح الحزمة
افتح القفل للوصول البطاقات البالغ عددها 105 في هذه المجموعة.
فتح الحزمة
k this deck
21
Use the traditional method to test the given hypothesis. Assume that the samples are independent and that they have been randomly selected
-7 of 8,500 people vaccinated against a certain disease later developed the disease. 18 of 10,000 people vaccinated with a placebo later developed the disease. Test the claim that the vaccine is effective in lowering the incidence of the disease. Use a significance level of 0.02.
-7 of 8,500 people vaccinated against a certain disease later developed the disease. 18 of 10,000 people vaccinated with a placebo later developed the disease. Test the claim that the vaccine is effective in lowering the incidence of the disease. Use a significance level of 0.02.
فتح الحزمة
افتح القفل للوصول البطاقات البالغ عددها 105 في هذه المجموعة.
فتح الحزمة
k this deck
22
Find the appropriate p-value to test the null hypothesis, H0: p1 = p2, using a significance level of 0.05.
-
A).1201
B).0072
C).1836
D).0613
-
A).1201
B).0072
C).1836
D).0613
فتح الحزمة
افتح القفل للوصول البطاقات البالغ عددها 105 في هذه المجموعة.
فتح الحزمة
k this deck
23
Construct the indicated confidence interval for the difference between population proportions p1 - p2. Assume that the samples are independent and that they have been randomly selected.
- and Construct a confidence interval for the difference between population proportions .
A)
B)
C)
D)
- and Construct a confidence interval for the difference between population proportions .
A)
B)
C)
D)
فتح الحزمة
افتح القفل للوصول البطاقات البالغ عددها 105 في هذه المجموعة.
فتح الحزمة
k this deck
24
Use the traditional method to test the given hypothesis. Assume that the samples are independent and that they have been randomly selected
-A marketing survey involves product recognition in New York and California. Of 558 New Yorkers surveyed, 193 knew the product while 196 out of 614 Californians knew the product. At the 0.05 significance level, test the claim that the recognition rates are the same in both states.
-A marketing survey involves product recognition in New York and California. Of 558 New Yorkers surveyed, 193 knew the product while 196 out of 614 Californians knew the product. At the 0.05 significance level, test the claim that the recognition rates are the same in both states.
فتح الحزمة
افتح القفل للوصول البطاقات البالغ عددها 105 في هذه المجموعة.
فتح الحزمة
k this deck
25
Use the traditional method to test the given hypothesis. Assume that the samples are independent and that they have been randomly selected
-In a random sample of 500 people aged 20-24, 22% were smokers. In a random sample of 450 people aged 25-29, 14% were smokers. Test the claim that the proportion of smokers in the two age groups is the same. Use a significance level of 0.01.
-In a random sample of 500 people aged 20-24, 22% were smokers. In a random sample of 450 people aged 25-29, 14% were smokers. Test the claim that the proportion of smokers in the two age groups is the same. Use a significance level of 0.01.
فتح الحزمة
افتح القفل للوصول البطاقات البالغ عددها 105 في هذه المجموعة.
فتح الحزمة
k this deck
26
Use the traditional method to test the given hypothesis. Assume that the samples are independent and that they have been randomly selected
-In a random sample of 360 women, 65% favored stricter gun control laws. In a random sample of 220 men, 60% favored stricter gun control laws. Test the claim that the proportion of women favoring stricter gun control is higher than the proportion of men favoring stricter gun control. Use a significance level of 0.05.
-In a random sample of 360 women, 65% favored stricter gun control laws. In a random sample of 220 men, 60% favored stricter gun control laws. Test the claim that the proportion of women favoring stricter gun control is higher than the proportion of men favoring stricter gun control. Use a significance level of 0.05.
فتح الحزمة
افتح القفل للوصول البطاقات البالغ عددها 105 في هذه المجموعة.
فتح الحزمة
k this deck
27
Find the appropriate p-value to test the null hypothesis, H0: p1 = p2, using a significance level of 0.05.
-
A).0512
B).0086
C).0021
D).4211
-
A).0512
B).0086
C).0021
D).4211
فتح الحزمة
افتح القفل للوصول البطاقات البالغ عددها 105 في هذه المجموعة.
فتح الحزمة
k this deck
28
Construct the indicated confidence interval for the difference between population proportions p1 - p2. Assume that the samples are independent and that they have been randomly selected.
-A marketing survey involves product recognition in New York and California. Of 558 New Yorkers surveyed, 193 knew the product while 196 out of 614 Californians knew the product. Construct a 99% confidence interval for the difference between the two population proportions.
A)
B)
C)
D)
-A marketing survey involves product recognition in New York and California. Of 558 New Yorkers surveyed, 193 knew the product while 196 out of 614 Californians knew the product. Construct a 99% confidence interval for the difference between the two population proportions.
A)
B)
C)
D)
فتح الحزمة
افتح القفل للوصول البطاقات البالغ عددها 105 في هذه المجموعة.
فتح الحزمة
k this deck
29
Construct the indicated confidence interval for the difference between population proportions p1 - p2. Assume that the samples are independent and that they have been randomly selected.
-x1=65,n1=90 and x2=79,n2=116,construct a 98% confidence interival for the difference berween
population proportions .
A)
B)
C)
D)
-x1=65,n1=90 and x2=79,n2=116,construct a 98% confidence interival for the difference berween
population proportions .
A)
B)
C)
D)
فتح الحزمة
افتح القفل للوصول البطاقات البالغ عددها 105 في هذه المجموعة.
فتح الحزمة
k this deck
30
Find the appropriate p-value to test the null hypothesis, H0: p1 = p2, using a significance level of 0.05.
-
A).2130
B).0412
C).7718
D).1610
-
A).2130
B).0412
C).7718
D).1610
فتح الحزمة
افتح القفل للوصول البطاقات البالغ عددها 105 في هذه المجموعة.
فتح الحزمة
k this deck
31
Construct the indicated confidence interval for the difference between population proportions p1 - p2. Assume that the samples are independent and that they have been randomly selected.
-In a random sample of 300 women, favored stricter gun control legislation. In a random sample of 200 men, favored stricter gun control legislation. Construct a confidence interval for the difference between the population proportions - .
A)
B)
C)
D)
-In a random sample of 300 women, favored stricter gun control legislation. In a random sample of 200 men, favored stricter gun control legislation. Construct a confidence interval for the difference between the population proportions - .
A)
B)
C)
D)
فتح الحزمة
افتح القفل للوصول البطاقات البالغ عددها 105 في هذه المجموعة.
فتح الحزمة
k this deck
32
Compute the test statistic used to test the null hypothesis that p1 = p2
-Information about movie ticket sales was printed in a movie magazine. Out of fifty PG-rated movies, 45% had ticket sales in excess of $3,000,000. Out of thirty-five R-rated movies, 27% grossed over $3,000,000.
A)3.372
B)2.698
C)5.227
D)1.686
-Information about movie ticket sales was printed in a movie magazine. Out of fifty PG-rated movies, 45% had ticket sales in excess of $3,000,000. Out of thirty-five R-rated movies, 27% grossed over $3,000,000.
A)3.372
B)2.698
C)5.227
D)1.686
فتح الحزمة
افتح القفل للوصول البطاقات البالغ عددها 105 في هذه المجموعة.
فتح الحزمة
k this deck
33
Compute the test statistic used to test the null hypothesis that p1 = p2
-A random sampling of sixty pitchers from the National League and fifty-two pitchers from the American League showed that 16 National and 11 American League pitchers had E.R.A's below 3.5.
A)123.710
B)0.680
C)10.184
D)0.884
-A random sampling of sixty pitchers from the National League and fifty-two pitchers from the American League showed that 16 National and 11 American League pitchers had E.R.A's below 3.5.
A)123.710
B)0.680
C)10.184
D)0.884
فتح الحزمة
افتح القفل للوصول البطاقات البالغ عددها 105 في هذه المجموعة.
فتح الحزمة
k this deck
34
Compute the test statistic used to test the null hypothesis that p1 = p2
-A report on the nightly news broadcast stated that 13 out of 111 households with pet dogs were burglarized and 23 out of 190 without pet dogs were burglarized.
A)0.000
B)-0.102
C)-0.041
D)-0.173
-A report on the nightly news broadcast stated that 13 out of 111 households with pet dogs were burglarized and 23 out of 190 without pet dogs were burglarized.
A)0.000
B)-0.102
C)-0.041
D)-0.173
فتح الحزمة
افتح القفل للوصول البطاقات البالغ عددها 105 في هذه المجموعة.
فتح الحزمة
k this deck
35
Use the traditional method to test the given hypothesis. Assume that the samples are independent and that they have been randomly selected
-A researcher finds that of 1,000 people who said that they attend a religious service at least once a week, 31 stopped to help a person with car trouble. Of 1,200 people interviewed who had not attended a religious service at least once a month, 22 stopped to help a person with car trouble. At the 0.05 significance level, test the claim that the two proportions are equal.
-A researcher finds that of 1,000 people who said that they attend a religious service at least once a week, 31 stopped to help a person with car trouble. Of 1,200 people interviewed who had not attended a religious service at least once a month, 22 stopped to help a person with car trouble. At the 0.05 significance level, test the claim that the two proportions are equal.
فتح الحزمة
افتح القفل للوصول البطاقات البالغ عددها 105 في هذه المجموعة.
فتح الحزمة
k this deck
36
Use the traditional method to test the given hypothesis. Assume that the samples are independent and that they have been randomly selected
-Use the given sample data to test the claim that p1 < p2. Use a significance level of 0.10.
-Use the given sample data to test the claim that p1 < p2. Use a significance level of 0.10.
فتح الحزمة
افتح القفل للوصول البطاقات البالغ عددها 105 في هذه المجموعة.
فتح الحزمة
k this deck
37
Use the traditional method to test the given hypothesis. Assume that the samples are independent and that they have been randomly selected
-
-
فتح الحزمة
افتح القفل للوصول البطاقات البالغ عددها 105 في هذه المجموعة.
فتح الحزمة
k this deck
38
Find the appropriate p-value to test the null hypothesis, H0: p1 = p2, using a significance level of 0.05.
-
A).0001
B).0146
C).0032
D).1201
-
A).0001
B).0146
C).0032
D).1201
فتح الحزمة
افتح القفل للوصول البطاقات البالغ عددها 105 في هذه المجموعة.
فتح الحزمة
k this deck
39
Find the appropriate p-value to test the null hypothesis, H0: p1 = p2, using a significance level of 0.05.
-
A).0201
B).1011
C).4010
D).0012
-
A).0201
B).1011
C).4010
D).0012
فتح الحزمة
افتح القفل للوصول البطاقات البالغ عددها 105 في هذه المجموعة.
فتح الحزمة
k this deck
40
Construct the indicated confidence interval for the difference between population proportions p1 - p2. Assume that the samples are independent and that they have been randomly selected.
- and Construct a confidence interval for the difference between population proportions .
A)
B)
C)
D)
- and Construct a confidence interval for the difference between population proportions .
A)
B)
C)
D)
فتح الحزمة
افتح القفل للوصول البطاقات البالغ عددها 105 في هذه المجموعة.
فتح الحزمة
k this deck
41
Test the indicated claim about the means of two populations. Assume that the two samples are independent and that they have been randomly selected.
-Two types of flares are tested for their burning times (in minutes)and sample results are given below. Refer to the sample data to test the claim that the two populations have equal means. Use a 0.05 significance level.
-Two types of flares are tested for their burning times (in minutes)and sample results are given below. Refer to the sample data to test the claim that the two populations have equal means. Use a 0.05 significance level.
فتح الحزمة
افتح القفل للوصول البطاقات البالغ عددها 105 في هذه المجموعة.
فتح الحزمة
k this deck
42
Use the computer display to solve the problem.
-When testing for a difference between the means of a treatment group and a placebo group, the computer display below is obtained. Using a 0.01 significance level, is there sufficient evidence to support the claim that the treatment group (variable 1)comes from a population with a mean that is greater than the mean for the placebo population? Explain.
-When testing for a difference between the means of a treatment group and a placebo group, the computer display below is obtained. Using a 0.01 significance level, is there sufficient evidence to support the claim that the treatment group (variable 1)comes from a population with a mean that is greater than the mean for the placebo population? Explain.
فتح الحزمة
افتح القفل للوصول البطاقات البالغ عددها 105 في هذه المجموعة.
فتح الحزمة
k this deck
43
Construct the indicated confidence interval for the difference between the two population means. Assume that the two samples are independent and that they have been randomly selected.
-Two types of flares are tested for their burning times (in minutes)and sample results are given below.
Construct a confidence interval for the differences based on the sample data.
A)
B)
C)
D)
-Two types of flares are tested for their burning times (in minutes)and sample results are given below.
Construct a confidence interval for the differences based on the sample data.
A)
B)
C)
D)
فتح الحزمة
افتح القفل للوصول البطاقات البالغ عددها 105 في هذه المجموعة.
فتح الحزمة
k this deck
44
Use the computer display to solve the problem.
-When testing for a difference between the means of a treatment group and a placebo group, the computer display below is obtained. Using a 0.05 significance level, is there sufficient evidence to support the claim that the treatment group (variable 1)comes from a population with a mean that is different from the mean for the placebo population? Explain.
-When testing for a difference between the means of a treatment group and a placebo group, the computer display below is obtained. Using a 0.05 significance level, is there sufficient evidence to support the claim that the treatment group (variable 1)comes from a population with a mean that is different from the mean for the placebo population? Explain.
فتح الحزمة
افتح القفل للوصول البطاقات البالغ عددها 105 في هذه المجموعة.
فتح الحزمة
k this deck
45
Solve the problem.
To test the null hypothesis that the difference between two population proportions is equal to a nonzero constant c, use the test statistic
To test the null hypothesis that the difference between two population proportions is equal to a nonzero constant c, use the test statistic
فتح الحزمة
افتح القفل للوصول البطاقات البالغ عددها 105 في هذه المجموعة.
فتح الحزمة
k this deck
46
Determine whether the samples are independent or consist of matched pairs.
-The effectiveness of a new headache medicine is tested by measuring the amount of time before the headache is cured for patients who use the medicine and another group of patients who use a placebo drug.
A)Matched pairs
B)Independent samples
-The effectiveness of a new headache medicine is tested by measuring the amount of time before the headache is cured for patients who use the medicine and another group of patients who use a placebo drug.
A)Matched pairs
B)Independent samples
فتح الحزمة
افتح القفل للوصول البطاقات البالغ عددها 105 في هذه المجموعة.
فتح الحزمة
k this deck
47
Construct the indicated confidence interval for the difference between the two population means. Assume that the two samples are independent and that they have been randomly selected.
-Independent samples from two different populations yield the following data. , s1 , s2 . The sample size is 177 for both samples. Find the 85 percent confidence interval for .
A)
B)
C)
D)
-Independent samples from two different populations yield the following data. , s1 , s2 . The sample size is 177 for both samples. Find the 85 percent confidence interval for .
A)
B)
C)
D)
فتح الحزمة
افتح القفل للوصول البطاقات البالغ عددها 105 في هذه المجموعة.
فتح الحزمة
k this deck
48
Determine whether the samples are independent or consist of matched pairs.
-The effect of caffeine as an ingredient is tested with a sample of regular soda and another sample with decaffeinated soda.
A)Matched pairs
B)Independent samples
-The effect of caffeine as an ingredient is tested with a sample of regular soda and another sample with decaffeinated soda.
A)Matched pairs
B)Independent samples
فتح الحزمة
افتح القفل للوصول البطاقات البالغ عددها 105 في هذه المجموعة.
فتح الحزمة
k this deck
49
Use the computer display to solve the problem.
-When testing for a difference between the means of a treatment group and a placebo group, the computer display below is obtained. Using a 0.05 significance level, is there sufficient evidence to support the claim that the treatment group (variable 1)comes from a population with a mean that is less than the mean for the placebo population? Explain.
-When testing for a difference between the means of a treatment group and a placebo group, the computer display below is obtained. Using a 0.05 significance level, is there sufficient evidence to support the claim that the treatment group (variable 1)comes from a population with a mean that is less than the mean for the placebo population? Explain.
فتح الحزمة
افتح القفل للوصول البطاقات البالغ عددها 105 في هذه المجموعة.
فتح الحزمة
k this deck
50
Use the computer display to solve the problem.
-When testing for a difference between the means of a treatment group and a placebo group, the computer display below is obtained. Using a 0.04 significance level, is there sufficient evidence to support the claim that the treatment group (variable 1)comes from a population with a mean that is different from the mean for the placebo population? Explain.
-When testing for a difference between the means of a treatment group and a placebo group, the computer display below is obtained. Using a 0.04 significance level, is there sufficient evidence to support the claim that the treatment group (variable 1)comes from a population with a mean that is different from the mean for the placebo population? Explain.
فتح الحزمة
افتح القفل للوصول البطاقات البالغ عددها 105 في هذه المجموعة.
فتح الحزمة
k this deck
51
Determine whether the following statement regarding the hypothesis test for two population proportions is true or false: However small the difference between two population proportions, for sufficiently large sample sizes, the null hypothesis of equal population proportions is likely to be rejected.
فتح الحزمة
افتح القفل للوصول البطاقات البالغ عددها 105 في هذه المجموعة.
فتح الحزمة
k this deck
52
Determine whether the samples are independent or consist of matched pairs.
-The effectiveness of a headache medicine is tested by measuring the intensity of a headache in patients before and after drug treatment. The data consist of before and after intensities for each patient.
A)Matched pairs
B)Independent samples
-The effectiveness of a headache medicine is tested by measuring the intensity of a headache in patients before and after drug treatment. The data consist of before and after intensities for each patient.
A)Matched pairs
B)Independent samples
فتح الحزمة
افتح القفل للوصول البطاقات البالغ عددها 105 في هذه المجموعة.
فتح الحزمة
k this deck
53
Determine whether the samples are independent or consist of matched pairs.
-The accuracy of verbal responses is tested in an experiment in which individuals report their heights and then are measured. The data consist of the reported height and measured height for each individual.
A)Independent samples
B)Matched pairs
-The accuracy of verbal responses is tested in an experiment in which individuals report their heights and then are measured. The data consist of the reported height and measured height for each individual.
A)Independent samples
B)Matched pairs
فتح الحزمة
افتح القفل للوصول البطاقات البالغ عددها 105 في هذه المجموعة.
فتح الحزمة
k this deck
54
Test the indicated claim about the means of two populations. Assume that the two samples are independent and that they have been randomly selected.
-A researcher wishes to determine whether people with high blood pressure can reduce their blood pressure by following a particular diet. Use the sample data below to test the claim that the treatment population mean µ1 is smaller than the control population mean µ2. Test the claim using a significance level of 0.01.
-A researcher wishes to determine whether people with high blood pressure can reduce their blood pressure by following a particular diet. Use the sample data below to test the claim that the treatment population mean µ1 is smaller than the control population mean µ2. Test the claim using a significance level of 0.01.
فتح الحزمة
افتح القفل للوصول البطاقات البالغ عددها 105 في هذه المجموعة.
فتح الحزمة
k this deck
55
Solve the problem.
-A researcher wished to perform a hypothesis test to test the claim that the rate of defectives among the computers of two different manufacturers are the same. She selects two independent random samples and obtains the following sample data. Manufacturer
A: , rate of defectives: Manufacturer
B: , rate of defectives:
Can the methods of this section be used to perform a hypothesis test to test for the equality of the two population proportions? Go through the steps of checking whether the conditions for the hypothesis test for two population proportions are satisfied. Show your calculations and state your conclusion.
فتح الحزمة
افتح القفل للوصول البطاقات البالغ عددها 105 في هذه المجموعة.
فتح الحزمة
k this deck
56
Construct the indicated confidence interval for the difference between the two population means. Assume that the two samples are independent and that they have been randomly selected.
-A researcher wishes to determine whether people with high blood pressure can reduce their blood pressure by following a particular diet. Use the sample data below to construct a confidence interval for - where and represent the mean for the treatment group and the control group respectively.
A)
B)
C)
D)
فتح الحزمة
افتح القفل للوصول البطاقات البالغ عددها 105 في هذه المجموعة.
فتح الحزمة
k this deck
57
Construct the indicated confidence interval for the difference between population proportions p1 - p2. Assume that the samples are independent and that they have been randomly selected.
-In a random sample of 500 people aged were smokers. In a random sample of 450 people aged were smokers. Construct a confidence interval for the difference between the population proportions .
A) p p
B)
C)
D)
-In a random sample of 500 people aged were smokers. In a random sample of 450 people aged were smokers. Construct a confidence interval for the difference between the population proportions .
A) p p
B)
C)
D)
فتح الحزمة
افتح القفل للوصول البطاقات البالغ عددها 105 في هذه المجموعة.
فتح الحزمة
k this deck
58
Solve the problem.
-A hypothesis test is to be performed to test the equality of two population means. The sample sizes are large and the samples are independent. A 95% confidence interval for the difference between the population means is (1.4, 8.7). If the hypothesis test is based on the same samples, which of the following do you know for sure:
A: The hypothesis would be rejected at the level of significance.
B: The hypothesis would be rejected at the level of significance.
C: The hypothesis would be rejected at the level of significance.
A) A, B, and C
B) A only
C) A and C
D) A and B
فتح الحزمة
افتح القفل للوصول البطاقات البالغ عددها 105 في هذه المجموعة.
فتح الحزمة
k this deck
59
Solve the problem.
-The sample size needed to estimate the difference between two population proportions to within a margin of error with a confidence level of can be found as follows: in the expression
replace and by (assuming both samples have the same size) and replace each of , and by (because their values are not known). Then solve for .
Use this approach to find the size of each sample if you want to estimate the difference between the proportions . and women who plan to vote in the next presidential election. Assume that you want confidence that your no more than .
A) 3017
B) 2135
C) 3685
D) 1432
فتح الحزمة
افتح القفل للوصول البطاقات البالغ عددها 105 في هذه المجموعة.
فتح الحزمة
k this deck
60
Solve the problem.
To test the null hypothesis that the difference between two population proportions is equal to a nonzero constant c, use the test statistic
To test the null hypothesis that the difference between two population proportions is equal to a nonzero constant c, use the test statistic
فتح الحزمة
افتح القفل للوصول البطاقات البالغ عددها 105 في هذه المجموعة.
فتح الحزمة
k this deck
61
Find sd.
-The differences between two sets of dependent data are -1, 5, -4, 2. Round to the nearest tenth.
A)2.0
B)3.9
C)89.7
D)3.1
-The differences between two sets of dependent data are -1, 5, -4, 2. Round to the nearest tenth.
A)2.0
B)3.9
C)89.7
D)3.1
فتح الحزمة
افتح القفل للوصول البطاقات البالغ عددها 105 في هذه المجموعة.
فتح الحزمة
k this deck
62
Assume that you want to test the claim that the paired sample data come from a population for which the mean difference is . Compute the value of the test statistic.
-
A)
B)
C)
D)
-
A)
B)
C)
D)
فتح الحزمة
افتح القفل للوصول البطاقات البالغ عددها 105 في هذه المجموعة.
فتح الحزمة
k this deck
63
Assume that you want to test the claim that the paired sample data come from a population for which the mean difference is . Compute the value of the test statistic.
-The following table shows the weights of nine subjects before and after following a particular diet for two months. You wish to test the claim that the diet is effective in helping people lose weight. What is the value of the appropriate test statistic?
A)0.351
B)1.052
C)3.156
D)9.468
-The following table shows the weights of nine subjects before and after following a particular diet for two months. You wish to test the claim that the diet is effective in helping people lose weight. What is the value of the appropriate test statistic?
A)0.351
B)1.052
C)3.156
D)9.468
فتح الحزمة
افتح القفل للوصول البطاقات البالغ عددها 105 في هذه المجموعة.
فتح الحزمة
k this deck
64
Determine the decision criterion for rejecting the null hypothesis in the given hypothesis test; i.e., describe the values of the test statistic that would result in rejection of the null hypothesis
-We wish to compare the means of two populations using paired observations. Suppose that , and , and that you wish to test the following hypothesis at the 5 percent level of significance:
What decision rule would you use?
A) Reject if test statistic is greater than and less than .
B) Reject if test statistic is less than .
C) Reject if test statistic is greater than .
D) Reject if test statistic is greater than .
فتح الحزمة
افتح القفل للوصول البطاقات البالغ عددها 105 في هذه المجموعة.
فتح الحزمة
k this deck
65
Determine whether the samples are independent or consist of matched pairs.
-A hypothesis test is to be performed to test the equality of two population means. The sample sizes are large and the samples are independent. Give an expression for the population standard deviation of the values in terms of , and .
A)
B)
C)
D)
-A hypothesis test is to be performed to test the equality of two population means. The sample sizes are large and the samples are independent. Give an expression for the population standard deviation of the values in terms of , and .
A)
B)
C)
D)
فتح الحزمة
افتح القفل للوصول البطاقات البالغ عددها 105 في هذه المجموعة.
فتح الحزمة
k this deck
66
Find sd.
-The differences between two sets of dependent data are 3, 21, 3, 27, 15. Round to the nearest tenth.
A)10.7
B)8.6
C)21.4
D)13.9
-The differences between two sets of dependent data are 3, 21, 3, 27, 15. Round to the nearest tenth.
A)10.7
B)8.6
C)21.4
D)13.9
فتح الحزمة
افتح القفل للوصول البطاقات البالغ عددها 105 في هذه المجموعة.
فتح الحزمة
k this deck
67
The two data sets are dependent. Find to the nearest tenth.
-
A)143.4
B)23.9
C)14.3
D)31.1
-
A)143.4
B)23.9
C)14.3
D)31.1
فتح الحزمة
افتح القفل للوصول البطاقات البالغ عددها 105 في هذه المجموعة.
فتح الحزمة
k this deck
68
Find sd.
-The differences between two sets of dependent data are 0.11, 0.21, 0.15, 0.12, 0.14. Round to the nearest hundredth.
A)0.06
B)0.02
C)0.12
D)0.04
-The differences between two sets of dependent data are 0.11, 0.21, 0.15, 0.12, 0.14. Round to the nearest hundredth.
A)0.06
B)0.02
C)0.12
D)0.04
فتح الحزمة
افتح القفل للوصول البطاقات البالغ عددها 105 في هذه المجموعة.
فتح الحزمة
k this deck
69
Assume that you want to test the claim that the paired sample data come from a population for which the mean difference is . Compute the value of the test statistic.
-
A)
B)
C)
D)
-
A)
B)
C)
D)
فتح الحزمة
افتح القفل للوصول البطاقات البالغ عددها 105 في هذه المجموعة.
فتح الحزمة
k this deck
70
The two data sets are dependent. Find to the nearest tenth.
-
A)-1.2
B)-1.1
C)-0.9
D)-0.5
-
A)-1.2
B)-1.1
C)-0.9
D)-0.5
فتح الحزمة
افتح القفل للوصول البطاقات البالغ عددها 105 في هذه المجموعة.
فتح الحزمة
k this deck
71
The two data sets are dependent. Find to the nearest tenth.
-
A)-0.8
B)-1.3
C)-7.8
D)-1.7
-
A)-0.8
B)-1.3
C)-7.8
D)-1.7
فتح الحزمة
افتح القفل للوصول البطاقات البالغ عددها 105 في هذه المجموعة.
فتح الحزمة
k this deck
72
Determine the decision criterion for rejecting the null hypothesis in the given hypothesis test; i.e., describe the values of the test statistic that would result in rejection of the null hypothesis
-Suppose you wish to test the claim that , the mean value of the differences for a population of paired data, is greater than 0 . Given a sample of and a significance level of , what criterion would be used for rejecting the null hypothesis?
A) Reject null hypothesis if test statistic .
B) Reject null hypothesis if test statistic .
C) Reject null hypothesis if test statistic or .
D) Reject null hypothesis if test statistic .
فتح الحزمة
افتح القفل للوصول البطاقات البالغ عددها 105 في هذه المجموعة.
فتح الحزمة
k this deck
73
Find sd.
-Consider the set of differences between two dependent sets: 84, 85, 83, 63, 61, 100, 98. Round to the nearest tenth.
A)13.1
B)16.2
C)15.3
D)15.7
-Consider the set of differences between two dependent sets: 84, 85, 83, 63, 61, 100, 98. Round to the nearest tenth.
A)13.1
B)16.2
C)15.3
D)15.7
فتح الحزمة
افتح القفل للوصول البطاقات البالغ عددها 105 في هذه المجموعة.
فتح الحزمة
k this deck
74
Use the traditional method of hypothesis testing to test the given claim about the means of two populations. Assume that
two dependent samples have been randomly selected from normally distributed populations.
Five students took a math test before and after tutoring. Their scores were as follows. Using a 0.01 level of significance, test the claim that the tutoring has an effect on the math scores.
two dependent samples have been randomly selected from normally distributed populations.
Five students took a math test before and after tutoring. Their scores were as follows.
Using a 0.01 level of significance, test the claim that the tutoring has an effect on the math scores. فتح الحزمة
افتح القفل للوصول البطاقات البالغ عددها 105 في هذه المجموعة.
فتح الحزمة
k this deck
75
Determine the decision criterion for rejecting the null hypothesis in the given hypothesis test; i.e., describe the values of the test statistic that would result in rejection of the null hypothesis
-Suppose you wish to test the claim that , the mean value of the differences d for a population of paired data, is different from 0. Given a sample of n = 23 and a significance level of 0.05, what criterion would be used for rejecting the null hypothesis?
A) Reject null hypothesis if test statistic .
B) Reject null hypothesis if test statistic or .
C) Reject null hypothesis if test statistic or .
D) Reject null hypothesis if test statistic or .
فتح الحزمة
افتح القفل للوصول البطاقات البالغ عددها 105 في هذه المجموعة.
فتح الحزمة
k this deck
76
Assume that you want to test the claim that the paired sample data come from a population for which the mean difference is . Compute the value of the test statistic.
-A farmer has decided to use a new additive to grow his crops. He divided his farm into 10 plots and kept records of the corn yield (in bushels)before and after using the additive. The results are shown below.
You wish to test the following hypothesis at the 5 percent level of significance.
What is the value of the appropriate test statistic?
A)2.536
B)1.584
C)5.014
D)2.033
فتح الحزمة
افتح القفل للوصول البطاقات البالغ عددها 105 في هذه المجموعة.
فتح الحزمة
k this deck
77
The two data sets are dependent. Find to the nearest tenth.
-
A)41.0
B)32.8
C)19.7
D)42.6
-
A)41.0
B)32.8
C)19.7
D)42.6
فتح الحزمة
افتح القفل للوصول البطاقات البالغ عددها 105 في هذه المجموعة.
فتح الحزمة
k this deck
78
Determine the decision criterion for rejecting the null hypothesis in the given hypothesis test; i.e., describe the values of the test statistic that would result in rejection of the null hypothesis
-A farmer has decided to use a new additive to grow his crops. He divided his farm into 10 plots and kept records of the corn yield (in bushels)before and after using the additive. The results are shown below.
You wish the test the following hypothesis at the 1 percent level of significance.
against .
What decision rule would you use?
A) Reject if test statistic is greater than .
B) Reject if test statistic is greater than or less than .
C) Reject if test statistic is greater than .
D) Reject if test statistic is less than .
فتح الحزمة
افتح القفل للوصول البطاقات البالغ عددها 105 في هذه المجموعة.
فتح الحزمة
k this deck
79
Assume that you want to test the claim that the paired sample data come from a population for which the mean difference is . Compute the value of the test statistic.
-
A)t = 6.792
B)t = 0.998
C)t = 2.391
D)t = 0.845
-
A)t = 6.792
B)t = 0.998
C)t = 2.391
D)t = 0.845
فتح الحزمة
افتح القفل للوصول البطاقات البالغ عددها 105 في هذه المجموعة.
فتح الحزمة
k this deck
80
Determine the decision criterion for rejecting the null hypothesis in the given hypothesis test; i.e., describe the values of the test statistic that would result in rejection of the null hypothesis
-A farmer has decided to use a new additive to grow his crops. He divided his farm into 10 plots and kept records of the corn yield (in bushels)before and after using the additive. The results are shown below.
You wish to test the following hypothesis at the 1 percent level of significance.
against
What decision rule would you use?
A) Reject if test statistic is less than .
B) Reject if test statistic is greater than .
C) Reject if test statistic is less than or greater than .
D) Reject if test statistic is greater than or less than .
فتح الحزمة
افتح القفل للوصول البطاقات البالغ عددها 105 في هذه المجموعة.
فتح الحزمة
k this deck
فتح الحزمة
افتح القفل للوصول البطاقات البالغ عددها 105 في هذه المجموعة.


