Deck 14: Statistical Process Control
ملء الشاشة (f)
سؤال
A machine that is supposed to fill small bottles to contain 20 ml yields the following data from a test of 4 bottles every hour.
سؤال
Examine the given run chart or control chart and determine whether the process is within statistical control. If it is not, identify which of the three out-of-control criteria apply
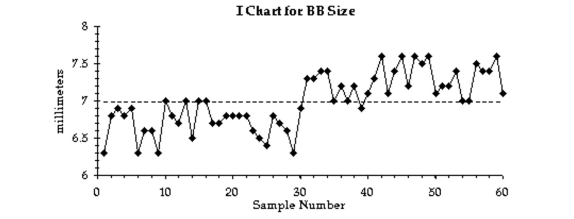
-A machine that is supposed to produce ball bearings with a diameter of 7 mm yields the following data from a test of 5 ball bearings every 20 minutes.
-A machine that is supposed to produce ball bearings with a diameter of 7 mm yields the following data from a test of 5 ball bearings every 20 minutes.
سؤال
سؤال
سؤال
سؤال
Examine the given run chart or control chart and determine whether the process is within statistical control. If it is not, identify which of the three out-of-control criteria apply
-A machine that is supposed to fill small bottles to contain 20 ml yields the following data from a test of 4 bottles every hour.
-A machine that is supposed to fill small bottles to contain 20 ml yields the following data from a test of 4 bottles every hour.
سؤال
سؤال
A machine is supposed to fill cans that contain 12 oz. Each hour, a sample of four cans is tested; the results of 15 consecutive hours are given below.
سؤال
Examine the given run chart or control chart and determine whether the process is within statistical control. If it is not, identify which of the three out-of-control criteria apply
-A machine is supposed to fill cans that contain 12 oz. Each hour, a sample of four cans is tested; the results of 15 consecutive hours are given below.
-A machine is supposed to fill cans that contain 12 oz. Each hour, a sample of four cans is tested; the results of 15 consecutive hours are given below.
سؤال
سؤال
Examine the given run chart or control chart and determine whether the process is within statistical control. If it is not, identify which of the three out-of-control criteria apply
-A machine that is supposed to produce ball bearings with a diameter of 7 mm yields the following data from a test of 5 ball bearings every 20 minutes.
-A machine that is supposed to produce ball bearings with a diameter of 7 mm yields the following data from a test of 5 ball bearings every 20 minutes.
سؤال
Examine the given run chart or control chart and determine whether the process is within statistical control. If it is not, identify which of the three out-of-control criteria apply
-A machine is supposed to fill boxes to a weight of 50 lbs. Every 30 minutes a sample of four boxes is tested; the results are given below.
-A machine is supposed to fill boxes to a weight of 50 lbs. Every 30 minutes a sample of four boxes is tested; the results are given below.
سؤال
Examine the given run chart or control chart and determine whether the process is within statistical control. If it is not, identify which of the three out-of-control criteria apply
-A machine is supposed to fill cans that contain 12 oz. Each hour, a sample of four cans is tested; the results of 15 consecutive hours are given below.

-A machine is supposed to fill cans that contain 12 oz. Each hour, a sample of four cans is tested; the results of 15 consecutive hours are given below.
سؤال
سؤال
A machine that is supposed to produce ball bearings with a diameter of 7 mm yields the following data from a test of 5 ball bearings every 20 minutes.
سؤال
Examine the given run chart or control chart and determine whether the process is within statistical control. If it is not, identify which of the three out-of-control criteria apply
-A machine is supposed to fill boxes to a weight of 50 lbs. Every 30 minutes a sample of four boxes is tested; the results are given below.
-A machine is supposed to fill boxes to a weight of 50 lbs. Every 30 minutes a sample of four boxes is tested; the results are given below.
سؤال
سؤال
سؤال
سؤال
Examine the given run chart or control chart and determine whether the process is within statistical control. If it is not, identify which of the three out-of-control criteria apply
-
-
سؤال
Examine the given run chart or control chart and determine whether the process is within statistical control. If it is not, identify which of the three out-of-control criteria apply
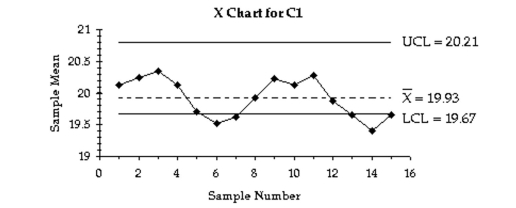
-A control chart for is shown below. Determine whether the process mean is within statistical control. If it is not, identify which of the three out-of-control criteria lead to rejection of a statistically stable mean.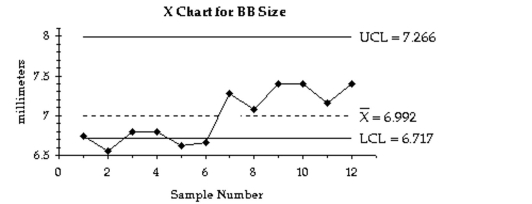
-A control chart for is shown below. Determine whether the process mean is within statistical control. If it is not, identify which of the three out-of-control criteria lead to rejection of a statistically stable mean.
سؤال
سؤال
Examine the given run chart or control chart and determine whether the process is within statistical control. If it is not, identify which of the three out-of-control criteria apply
-A control chart for R is shown below. Determine whether the process variation is within statistical control. If it is not, identify which of the three out-of-control criteria lead to rejection of statistically stable variation.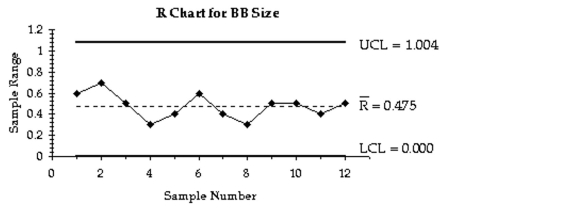
-A control chart for R is shown below. Determine whether the process variation is within statistical control. If it is not, identify which of the three out-of-control criteria lead to rejection of statistically stable variation.
سؤال
سؤال
Examine the given run chart or control chart and determine whether the process is within statistical control. If it is not, identify which of the three out-of-control criteria apply
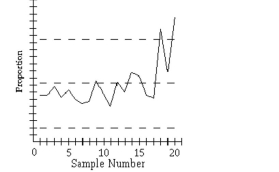
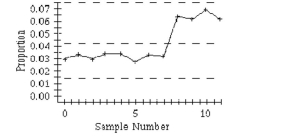
-A run chart for individual values is shown below. Does there appear to be a pattern suggesting that the process is not within statistical control? If so, describe the pattern.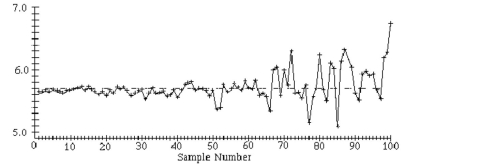
-A run chart for individual values is shown below. Does there appear to be a pattern suggesting that the process is not within statistical control? If so, describe the pattern.
سؤال
Use the given process data to construct a control chart for p
-If the weight of cereal in a particular packet is less than 14 oz, the packet is considered nonconforming. Each week, the manufacturer randomly selects 1,000 cereal packets and determines the number that are nonconforming. The results for 12 consecutive weeks are shown below. 46 32 21 30 47 31 32 52 48 45 62 58
-If the weight of cereal in a particular packet is less than 14 oz, the packet is considered nonconforming. Each week, the manufacturer randomly selects 1,000 cereal packets and determines the number that are nonconforming. The results for 12 consecutive weeks are shown below. 46 32 21 30 47 31 32 52 48 45 62 58
سؤال
سؤال
Use the given process data to construct a control chart for p
-A drugstore considers a wait of more than 5 minutes to be a defect. Each week 100 customers are randomly selected and timed at the checkout line. The numbers of defects for 20 consecutive weeks are given below. 4 4 5 5 5 5 5 5 6 6 6 6 12 6 6 6 7 6 7 8 7
-A drugstore considers a wait of more than 5 minutes to be a defect. Each week 100 customers are randomly selected and timed at the checkout line. The numbers of defects for 20 consecutive weeks are given below. 4 4 5 5 5 5 5 5 6 6 6 6 12 6 6 6 7 6 7 8 7
سؤال
Examine the given run chart or control chart and determine whether the process is within statistical control. If it is not, identify which of the three out-of-control criteria apply
-
-
سؤال
Examine the given run chart or control chart and determine whether the process is within statistical control. If it is not, identify which of the three out-of-control criteria apply
- A control chart for is shown below. Determine whether the process mean is within statistical control. If it is not, identify which of the three out-of-control criteria lead to rejection of a statistically stable mean.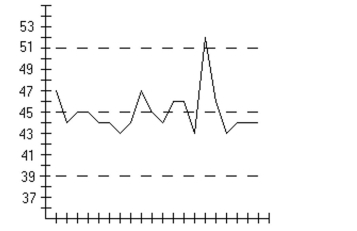
- A control chart for is shown below. Determine whether the process mean is within statistical control. If it is not, identify which of the three out-of-control criteria lead to rejection of a statistically stable mean.
سؤال
Examine the given run chart or control chart and determine whether the process is within statistical control. If it is not, identify which of the three out-of-control criteria apply
-A control chart for R is shown below. Determine whether the process variation is within statistical control. If it is not, identify which of the three out-of-control criteria lead to rejection of statistically stable variation.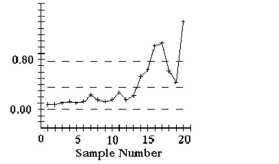
-A control chart for R is shown below. Determine whether the process variation is within statistical control. If it is not, identify which of the three out-of-control criteria lead to rejection of statistically stable variation.
سؤال
Examine the given run chart or control chart and determine whether the process is within statistical control. If it is not, identify which of the three out-of-control criteria apply
-
-
سؤال
Examine the given run chart or control chart and determine whether the process is within statistical control. If it is not, identify which of the three out-of-control criteria apply
-
-
سؤال
Examine the given run chart or control chart and determine whether the process is within statistical control. If it is not, identify which of the three out-of-control criteria apply
-A control chart for is shown below. Determine whether the process mean is within statistical control. If it is not, identify which of the three out-of-control criteria lead to rejection of a statistically stable mean.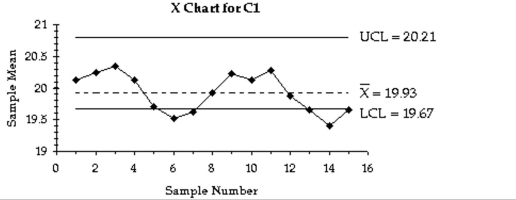
-A control chart for is shown below. Determine whether the process mean is within statistical control. If it is not, identify which of the three out-of-control criteria lead to rejection of a statistically stable mean.
سؤال
Examine the given run chart or control chart and determine whether the process is within statistical control. If it is not, identify which of the three out-of-control criteria apply
-A control chart fo s shown below. Determine whether the process mean is within statistical control. If it is not, identify which of the three out-of-control criteria lead to rejection of a statistically stable mean.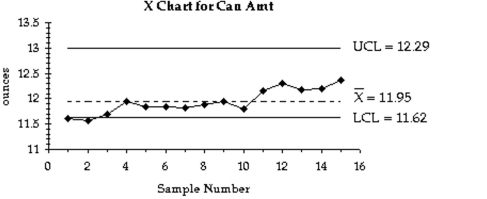
-A control chart fo s shown below. Determine whether the process mean is within statistical control. If it is not, identify which of the three out-of-control criteria lead to rejection of a statistically stable mean.
سؤال
Examine the given run chart or control chart and determine whether the process is within statistical control. If it is not, identify which of the three out-of-control criteria apply
-A run chart for individual values is shown below. Does there appear to be a pattern suggesting that the process is not within statistical control? If so, describe the pattern.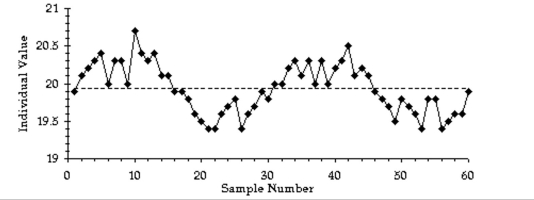
-A run chart for individual values is shown below. Does there appear to be a pattern suggesting that the process is not within statistical control? If so, describe the pattern.
سؤال
Use the given process data to construct a control chart for p
-A manufacturer monitors the level of defects in the television sets that it produces. Each week, 200 television sets are randomly selected and tested and the number of defects is recorded. The results for 12 consecutive weeks are shown below. 4 7 5 6 8 3 12 4 4 5 6 2
-A manufacturer monitors the level of defects in the television sets that it produces. Each week, 200 television sets are randomly selected and tested and the number of defects is recorded. The results for 12 consecutive weeks are shown below. 4 7 5 6 8 3 12 4 4 5 6 2

فتح الحزمة
قم بالتسجيل لفتح البطاقات في هذه المجموعة!
Unlock Deck
Unlock Deck
1/38
العب
ملء الشاشة (f)
Deck 14: Statistical Process Control
1
A machine that is supposed to fill small bottles to contain 20 ml yields the following data from a test of 4 bottles every hour.
2
Examine the given run chart or control chart and determine whether the process is within statistical control. If it is not, identify which of the three out-of-control criteria apply
-A machine that is supposed to produce ball bearings with a diameter of 7 mm yields the following data from a test of 5 ball bearings every 20 minutes.
-A machine that is supposed to produce ball bearings with a diameter of 7 mm yields the following data from a test of 5 ball bearings every 20 minutes.
3
Examine the given run chart or control chart and determine whether the process is within statistical control. If it is not, identify which of the three out-of-control criteria apply
-Describe a run chart and give an example. Refer to the values on each of the axes as you describe the run chart.
-Describe a run chart and give an example. Refer to the values on each of the axes as you describe the run chart.
A run chart is a sequential plot of individual data values over time. The horizontal axis typically is used for the time sequence, and the vertical axis is used for the values of the data.
4
A machine is supposed to fill boxes to a weight of 50 lbs. Every 30 minutes a sample of four boxes is tested; the results are given below.
فتح الحزمة
افتح القفل للوصول البطاقات البالغ عددها 38 في هذه المجموعة.
فتح الحزمة
k this deck
5
Examine the given run chart or control chart and determine whether the process is within statistical control. If it is not, identify which of the three out-of-control criteria apply
-Relate the concept of control charts to the concept of confidence intervals.
-Relate the concept of control charts to the concept of confidence intervals.
فتح الحزمة
افتح القفل للوصول البطاقات البالغ عددها 38 في هذه المجموعة.
فتح الحزمة
k this deck
6
Examine the given run chart or control chart and determine whether the process is within statistical control. If it is not, identify which of the three out-of-control criteria apply
-A machine that is supposed to fill small bottles to contain 20 ml yields the following data from a test of 4 bottles every hour.
-A machine that is supposed to fill small bottles to contain 20 ml yields the following data from a test of 4 bottles every hour.
فتح الحزمة
افتح القفل للوصول البطاقات البالغ عددها 38 في هذه المجموعة.
فتح الحزمة
k this deck
7
Examine the given run chart or control chart and determine whether the process is within statistical control. If it is not, identify which of the three out-of-control criteria apply
-A machine that is supposed to fill small bottles to contain 20 ml yields the following data from a test of 4 bottles every hour.
-A machine that is supposed to fill small bottles to contain 20 ml yields the following data from a test of 4 bottles every hour.
فتح الحزمة
افتح القفل للوصول البطاقات البالغ عددها 38 في هذه المجموعة.
فتح الحزمة
k this deck
8
Examine the given run chart or control chart and determine whether the process is within statistical control. If it is not, identify which of the three out-of-control criteria apply
-Define statistically stable (or "within statistical control"). Show examples of run charts which illustrate processes which are not statistically controlled. Discuss the pattern which indicates the process is not statistically controlled for each example.
-Define statistically stable (or "within statistical control"). Show examples of run charts which illustrate processes which are not statistically controlled. Discuss the pattern which indicates the process is not statistically controlled for each example.
فتح الحزمة
افتح القفل للوصول البطاقات البالغ عددها 38 في هذه المجموعة.
فتح الحزمة
k this deck
9
A machine is supposed to fill cans that contain 12 oz. Each hour, a sample of four cans is tested; the results of 15 consecutive hours are given below.
فتح الحزمة
افتح القفل للوصول البطاقات البالغ عددها 38 في هذه المجموعة.
فتح الحزمة
k this deck
10
Examine the given run chart or control chart and determine whether the process is within statistical control. If it is not, identify which of the three out-of-control criteria apply
-A machine is supposed to fill cans that contain 12 oz. Each hour, a sample of four cans is tested; the results of 15 consecutive hours are given below.
-A machine is supposed to fill cans that contain 12 oz. Each hour, a sample of four cans is tested; the results of 15 consecutive hours are given below.
فتح الحزمة
افتح القفل للوصول البطاقات البالغ عددها 38 في هذه المجموعة.
فتح الحزمة
k this deck
11
Examine the given run chart or control chart and determine whether the process is within statistical control. If it is not, identify which of the three out-of-control criteria apply
-Draw a control chart that illustrates a process which is statistically stable and one which illustrates a process which is not statistically stable. Discuss the results.
-Draw a control chart that illustrates a process which is statistically stable and one which illustrates a process which is not statistically stable. Discuss the results.
فتح الحزمة
افتح القفل للوصول البطاقات البالغ عددها 38 في هذه المجموعة.
فتح الحزمة
k this deck
12
Examine the given run chart or control chart and determine whether the process is within statistical control. If it is not, identify which of the three out-of-control criteria apply
-A machine that is supposed to produce ball bearings with a diameter of 7 mm yields the following data from a test of 5 ball bearings every 20 minutes.
-A machine that is supposed to produce ball bearings with a diameter of 7 mm yields the following data from a test of 5 ball bearings every 20 minutes.
فتح الحزمة
افتح القفل للوصول البطاقات البالغ عددها 38 في هذه المجموعة.
فتح الحزمة
k this deck
13
Examine the given run chart or control chart and determine whether the process is within statistical control. If it is not, identify which of the three out-of-control criteria apply
-A machine is supposed to fill boxes to a weight of 50 lbs. Every 30 minutes a sample of four boxes is tested; the results are given below.
-A machine is supposed to fill boxes to a weight of 50 lbs. Every 30 minutes a sample of four boxes is tested; the results are given below.
فتح الحزمة
افتح القفل للوصول البطاقات البالغ عددها 38 في هذه المجموعة.
فتح الحزمة
k this deck
14
Examine the given run chart or control chart and determine whether the process is within statistical control. If it is not, identify which of the three out-of-control criteria apply
-A machine is supposed to fill cans that contain 12 oz. Each hour, a sample of four cans is tested; the results of 15 consecutive hours are given below.
-A machine is supposed to fill cans that contain 12 oz. Each hour, a sample of four cans is tested; the results of 15 consecutive hours are given below.
فتح الحزمة
افتح القفل للوصول البطاقات البالغ عددها 38 في هذه المجموعة.
فتح الحزمة
k this deck
15
Examine the given run chart or control chart and determine whether the process is within statistical control. If it is not, identify which of the three out-of-control criteria apply
-Describe a control chart. Complete the table to identify the important parts of different types of control charts.
-Describe a control chart. Complete the table to identify the important parts of different types of control charts.
فتح الحزمة
افتح القفل للوصول البطاقات البالغ عددها 38 في هذه المجموعة.
فتح الحزمة
k this deck
16
A machine that is supposed to produce ball bearings with a diameter of 7 mm yields the following data from a test of 5 ball bearings every 20 minutes.
فتح الحزمة
افتح القفل للوصول البطاقات البالغ عددها 38 في هذه المجموعة.
فتح الحزمة
k this deck
17
Examine the given run chart or control chart and determine whether the process is within statistical control. If it is not, identify which of the three out-of-control criteria apply
-A machine is supposed to fill boxes to a weight of 50 lbs. Every 30 minutes a sample of four boxes is tested; the results are given below.
-A machine is supposed to fill boxes to a weight of 50 lbs. Every 30 minutes a sample of four boxes is tested; the results are given below.
فتح الحزمة
افتح القفل للوصول البطاقات البالغ عددها 38 في هذه المجموعة.
فتح الحزمة
k this deck
18
Examine the given run chart or control chart and determine whether the process is within statistical control. If it is not, identify which of the three out-of-control criteria apply
-Describe the three criteria used to determine if a control chart indicates a process which is not statistically stable.
-Describe the three criteria used to determine if a control chart indicates a process which is not statistically stable.
فتح الحزمة
افتح القفل للوصول البطاقات البالغ عددها 38 في هذه المجموعة.
فتح الحزمة
k this deck
19
Examine the given run chart or control chart and determine whether the process is within statistical control. If it is not, identify which of the three out-of-control criteria apply
-Describe what process data are. Why are process data important to businesses? What is a common goal of businesses using quality control?
-Describe what process data are. Why are process data important to businesses? What is a common goal of businesses using quality control?
فتح الحزمة
افتح القفل للوصول البطاقات البالغ عددها 38 في هذه المجموعة.
فتح الحزمة
k this deck
20
Examine the given run chart or control chart and determine whether the process is within statistical control. If it is not, identify which of the three out-of-control criteria apply
-A common goal of quality control is to reduce variation in a product or service. List and describe the two types of variability. Give an example of each.
-A common goal of quality control is to reduce variation in a product or service. List and describe the two types of variability. Give an example of each.
فتح الحزمة
افتح القفل للوصول البطاقات البالغ عددها 38 في هذه المجموعة.
فتح الحزمة
k this deck
21
Examine the given run chart or control chart and determine whether the process is within statistical control. If it is not, identify which of the three out-of-control criteria apply
-
-
فتح الحزمة
افتح القفل للوصول البطاقات البالغ عددها 38 في هذه المجموعة.
فتح الحزمة
k this deck
22
Examine the given run chart or control chart and determine whether the process is within statistical control. If it is not, identify which of the three out-of-control criteria apply
-A control chart for is shown below. Determine whether the process mean is within statistical control. If it is not, identify which of the three out-of-control criteria lead to rejection of a statistically stable mean.
-A control chart for is shown below. Determine whether the process mean is within statistical control. If it is not, identify which of the three out-of-control criteria lead to rejection of a statistically stable mean.
فتح الحزمة
افتح القفل للوصول البطاقات البالغ عددها 38 في هذه المجموعة.
فتح الحزمة
k this deck
23
Solve the Problem.
-A control chart for monitoring variation and center can be based on standard deviations instead of on ranges. An s chart for monitoring variation is made by plotting sample standard deviations with a center line at (the mean of the sample standard deviations) and control limits at and , where and are found in the Control Chart Constants table. Construct an s chart for the data below.
A manufacturer of lightbulbs picks 10 lightbulbs at random each day for quality control. The mean, standard de and range (in hours) of the lifetimes of the 10 lightbulbs are calculated. The results for 12 consecutive days are sh the table below.
فتح الحزمة
افتح القفل للوصول البطاقات البالغ عددها 38 في هذه المجموعة.
فتح الحزمة
k this deck
24
Examine the given run chart or control chart and determine whether the process is within statistical control. If it is not, identify which of the three out-of-control criteria apply
-A control chart for R is shown below. Determine whether the process variation is within statistical control. If it is not, identify which of the three out-of-control criteria lead to rejection of statistically stable variation.
-A control chart for R is shown below. Determine whether the process variation is within statistical control. If it is not, identify which of the three out-of-control criteria lead to rejection of statistically stable variation.
فتح الحزمة
افتح القفل للوصول البطاقات البالغ عددها 38 في هذه المجموعة.
فتح الحزمة
k this deck
25
Solve the Problem.
-An chart based on standard deviations (instead of ranges) is made by plotting sample means with a centerline at and control limits at and where is found in the Control Chart Constants table and is the mean of the sample standard deviations. Construct an chart based on standard deviations for the data belo
A manufacturer of high intensity video projector lightbulbs picks 6 lightbulbs at random each day for quality cor The mean, standard deviation, and range (in hours) of the lifetimes of the 6 lightbulbs are calculated. The results consecutive days are shown in the table below.
فتح الحزمة
افتح القفل للوصول البطاقات البالغ عددها 38 في هذه المجموعة.
فتح الحزمة
k this deck
26
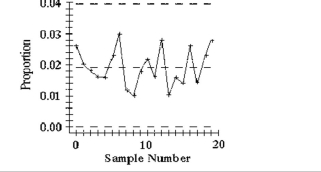
Examine the given run chart or control chart and determine whether the process is within statistical control. If it is not, identify which of the three out-of-control criteria apply
-A run chart for individual values is shown below. Does there appear to be a pattern suggesting that the process is not within statistical control? If so, describe the pattern.
-A run chart for individual values is shown below. Does there appear to be a pattern suggesting that the process is not within statistical control? If so, describe the pattern.
فتح الحزمة
افتح القفل للوصول البطاقات البالغ عددها 38 في هذه المجموعة.
فتح الحزمة
k this deck
27
Use the given process data to construct a control chart for p
-If the weight of cereal in a particular packet is less than 14 oz, the packet is considered nonconforming. Each week, the manufacturer randomly selects 1,000 cereal packets and determines the number that are nonconforming. The results for 12 consecutive weeks are shown below. 46 32 21 30 47 31 32 52 48 45 62 58
-If the weight of cereal in a particular packet is less than 14 oz, the packet is considered nonconforming. Each week, the manufacturer randomly selects 1,000 cereal packets and determines the number that are nonconforming. The results for 12 consecutive weeks are shown below. 46 32 21 30 47 31 32 52 48 45 62 58
فتح الحزمة
افتح القفل للوصول البطاقات البالغ عددها 38 في هذه المجموعة.
فتح الحزمة
k this deck
28
Solve the Problem.
-A control chart for attributes is to be constructed. Which process would have wider control limits, a process which has been having a 5% rate of nonconforming items, or a process which has been having a 10% of nonconforming items? Assume that both processes have the same sample sizes. For a given sample size, would it be easier to detect a shift from 5% to 10% or a shift from 10% to 15%? Explain your reasoning.
-A control chart for attributes is to be constructed. Which process would have wider control limits, a process which has been having a 5% rate of nonconforming items, or a process which has been having a 10% of nonconforming items? Assume that both processes have the same sample sizes. For a given sample size, would it be easier to detect a shift from 5% to 10% or a shift from 10% to 15%? Explain your reasoning.
فتح الحزمة
افتح القفل للوصول البطاقات البالغ عددها 38 في هذه المجموعة.
فتح الحزمة
k this deck
29
Use the given process data to construct a control chart for p
-A drugstore considers a wait of more than 5 minutes to be a defect. Each week 100 customers are randomly selected and timed at the checkout line. The numbers of defects for 20 consecutive weeks are given below. 4 4 5 5 5 5 5 5 6 6 6 6 12 6 6 6 7 6 7 8 7
-A drugstore considers a wait of more than 5 minutes to be a defect. Each week 100 customers are randomly selected and timed at the checkout line. The numbers of defects for 20 consecutive weeks are given below. 4 4 5 5 5 5 5 5 6 6 6 6 12 6 6 6 7 6 7 8 7
فتح الحزمة
افتح القفل للوصول البطاقات البالغ عددها 38 في هذه المجموعة.
فتح الحزمة
k this deck
30
Examine the given run chart or control chart and determine whether the process is within statistical control. If it is not, identify which of the three out-of-control criteria apply
-
-
فتح الحزمة
افتح القفل للوصول البطاقات البالغ عددها 38 في هذه المجموعة.
فتح الحزمة
k this deck
31
Examine the given run chart or control chart and determine whether the process is within statistical control. If it is not, identify which of the three out-of-control criteria apply
- A control chart for is shown below. Determine whether the process mean is within statistical control. If it is not, identify which of the three out-of-control criteria lead to rejection of a statistically stable mean.
- A control chart for is shown below. Determine whether the process mean is within statistical control. If it is not, identify which of the three out-of-control criteria lead to rejection of a statistically stable mean.
فتح الحزمة
افتح القفل للوصول البطاقات البالغ عددها 38 في هذه المجموعة.
فتح الحزمة
k this deck
32
Examine the given run chart or control chart and determine whether the process is within statistical control. If it is not, identify which of the three out-of-control criteria apply
-A control chart for R is shown below. Determine whether the process variation is within statistical control. If it is not, identify which of the three out-of-control criteria lead to rejection of statistically stable variation.
-A control chart for R is shown below. Determine whether the process variation is within statistical control. If it is not, identify which of the three out-of-control criteria lead to rejection of statistically stable variation.
فتح الحزمة
افتح القفل للوصول البطاقات البالغ عددها 38 في هذه المجموعة.
فتح الحزمة
k this deck
33
Examine the given run chart or control chart and determine whether the process is within statistical control. If it is not, identify which of the three out-of-control criteria apply
-
-
فتح الحزمة
افتح القفل للوصول البطاقات البالغ عددها 38 في هذه المجموعة.
فتح الحزمة
k this deck
34
Examine the given run chart or control chart and determine whether the process is within statistical control. If it is not, identify which of the three out-of-control criteria apply
-
-
فتح الحزمة
افتح القفل للوصول البطاقات البالغ عددها 38 في هذه المجموعة.
فتح الحزمة
k this deck
35
Examine the given run chart or control chart and determine whether the process is within statistical control. If it is not, identify which of the three out-of-control criteria apply
-A control chart for is shown below. Determine whether the process mean is within statistical control. If it is not, identify which of the three out-of-control criteria lead to rejection of a statistically stable mean.
-A control chart for is shown below. Determine whether the process mean is within statistical control. If it is not, identify which of the three out-of-control criteria lead to rejection of a statistically stable mean.
فتح الحزمة
افتح القفل للوصول البطاقات البالغ عددها 38 في هذه المجموعة.
فتح الحزمة
k this deck
36
Examine the given run chart or control chart and determine whether the process is within statistical control. If it is not, identify which of the three out-of-control criteria apply
-A control chart fo s shown below. Determine whether the process mean is within statistical control. If it is not, identify which of the three out-of-control criteria lead to rejection of a statistically stable mean.
-A control chart fo s shown below. Determine whether the process mean is within statistical control. If it is not, identify which of the three out-of-control criteria lead to rejection of a statistically stable mean.
فتح الحزمة
افتح القفل للوصول البطاقات البالغ عددها 38 في هذه المجموعة.
فتح الحزمة
k this deck
37
Examine the given run chart or control chart and determine whether the process is within statistical control. If it is not, identify which of the three out-of-control criteria apply
-A run chart for individual values is shown below. Does there appear to be a pattern suggesting that the process is not within statistical control? If so, describe the pattern.
-A run chart for individual values is shown below. Does there appear to be a pattern suggesting that the process is not within statistical control? If so, describe the pattern.
فتح الحزمة
افتح القفل للوصول البطاقات البالغ عددها 38 في هذه المجموعة.
فتح الحزمة
k this deck
38
Use the given process data to construct a control chart for p
-A manufacturer monitors the level of defects in the television sets that it produces. Each week, 200 television sets are randomly selected and tested and the number of defects is recorded. The results for 12 consecutive weeks are shown below. 4 7 5 6 8 3 12 4 4 5 6 2
-A manufacturer monitors the level of defects in the television sets that it produces. Each week, 200 television sets are randomly selected and tested and the number of defects is recorded. The results for 12 consecutive weeks are shown below. 4 7 5 6 8 3 12 4 4 5 6 2
فتح الحزمة
افتح القفل للوصول البطاقات البالغ عددها 38 في هذه المجموعة.
فتح الحزمة
k this deck
فتح الحزمة
افتح القفل للوصول البطاقات البالغ عددها 38 في هذه المجموعة.


