Deck 10: Associations Between Categorical Variables
ملء الشاشة (f)
سؤال
Use the following table to answer questions (1) - (4). The following table summarizes the results of a study to determine if job satisfaction is related to pay category. 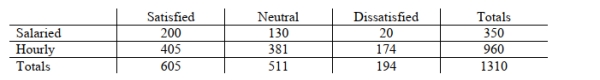
How many categorical variables are summarized in the table?
A)One
B)Two
C)Three
D)Four
How many categorical variables are summarized in the table?
A)One
B)Two
C)Three
D)Four
سؤال
Use the following table to answer questions (1) - (4). The following table summarizes the results of a study to determine if job satisfaction is related to pay category.
The proportion of hourly employees is about 0.733. If the variables are independent, what is the expected number of hourly employees who are dissatisfied with their jobs.
A)0.733(1310)
B)0.733()174
C)0.733()194
D)0.733(20)
The proportion of hourly employees is about 0.733. If the variables are independent, what is the expected number of hourly employees who are dissatisfied with their jobs.
A)0.733(1310)
B)0.733()174
C)0.733()194
D)0.733(20)
سؤال
سؤال
سؤال
سؤال
سؤال
سؤال
Use the following table to answer questions (1) - (4). The following table summarizes the results of a study to determine if job satisfaction is related to pay category.
What fraction of salaried employees are satisfied with their jobs?
A)
B)
C)
D)
What fraction of salaried employees are satisfied with their jobs?
A)
B)
C)
D)
سؤال
سؤال
سؤال
سؤال
سؤال
سؤال
سؤال
Use the following table to answer questions (1) - (4). The following table summarizes the results of a study to determine if job satisfaction is related to pay category.
What fraction represents the fraction of people in the study who were satisfied with their jobs?
A)
B)
C)
D)
What fraction represents the fraction of people in the study who were satisfied with their jobs?
A)
B)
C)
D)
سؤال
سؤال
سؤال
سؤال
سؤال
سؤال
سؤال
سؤال
سؤال
In many pharmaceutical studies, about 16% of all adult volunteers who take placebos (but who are told they have taken a cold remedy) reported that they suffered side effects of drowsiness, stomach upset, or headaches. A study was run on 250 children aged 8 to 12 to see if the results for children differ from those for adults. Below is a summary of the experiment conducted with 250 children aged 8 to 12 and the output for the goodness-of-fit test. 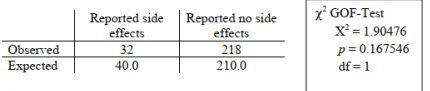
Choose the correct null and alternative hypotheses.
A)
B)
C)
D)
Choose the correct null and alternative hypotheses.
A)
B)
C)
D)
سؤال
Typically the percentage of women in an engineering class at a particular university has been 15%. A new recruiting plan was implemented in the past year to increase the proportion of women in the incoming class. This year, there were 49 women and 208 men in the incoming class. The data are summarized below. 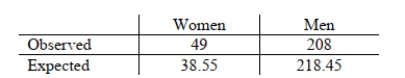 Calculate the observed value of the chi-square statistic. Round to the nearest hundredth.
A)3.33
B)2.75
C)218.41
D)98.37
Calculate the observed value of the chi-square statistic. Round to the nearest hundredth.A)3.33
B)2.75
C)218.41
D)98.37
سؤال
A traffic study found that of 676 automobiles entering a busy intersection during the period from 6 A.M. to 9 A.M., 257 turned left, 221 turned right, and 198 drove straight through the intersection. Below is a summary of the data and the output for the goodness-of-fit test.
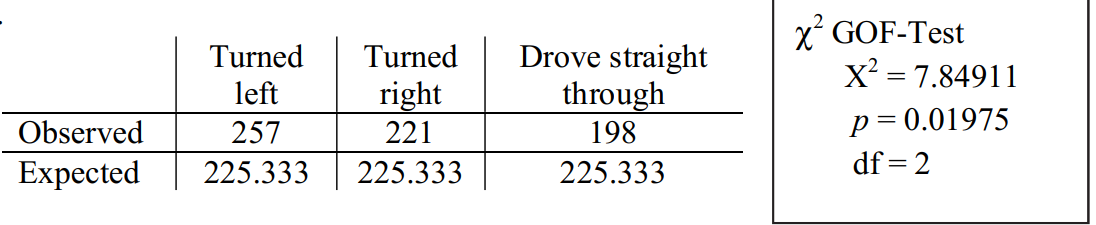
Test the hypothesis that the traffic is not equally divided among the three directions. Using a goodness-of-fit test and a 0.05 level of significance, choose the correct decision regarding the null hypothesis and conclusion statement.
A) Fail to reject H0; There is enough evidence to conclude that the traffic is equally divided among the three directions
B) Fail to reject H0; There is enough evidence to conclude that the traffic is not equally divided among the three directions
C) Reject H0; There is enough evidence to conclude that the traffic is equally divided among the three directions
D) Reject H0; There is enough evidence to conclude that the traffic is not equally divided among the three directions
سؤال
Recently, many states have been considering legalizing the use of marijuana. A survey was taken last year where adults in one state were asked if they favored legalizing the use of marijuana. The following table displays the percentage of adults in the state who favor and who do not favor the legalization of marijuana for both males and females: 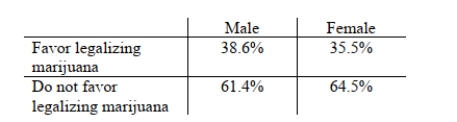 Choose the reason(s) why you cannot perform a chi-square test on the data.
A)The percentages do not add up to 100%.
B)There is not enough information to convert the percentages to counts.
C)The samples were not randomly selected
D)All of the above
Choose the reason(s) why you cannot perform a chi-square test on the data.A)The percentages do not add up to 100%.
B)There is not enough information to convert the percentages to counts.
C)The samples were not randomly selected
D)All of the above
سؤال
Genetically modified food has generated much controversy as to whether it is safe for humans to consume. A recent study was conducted to see if age is related to how a person views genetically modified food. The results appear in the following table: 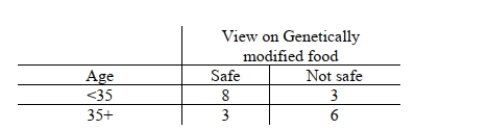 The alternative hypothesis is that age and view on genetically modified foods are associated. The p- value for Fisher's Exact Test with these data is 0.1748. Suppose the study had turned out differently, as in the following table.
 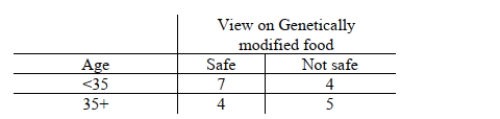 Would the p-value for Fisher's Exact Test be larger or smaller than 0.1748?
A)The p-value would be larger.
B)The p-value would be smaller.
The alternative hypothesis is that age and view on genetically modified foods are associated. The p- value for Fisher's Exact Test with these data is 0.1748. Suppose the study had turned out differently, as in the following table. Would the p-value for Fisher's Exact Test be larger or smaller than 0.1748?A)The p-value would be larger.
B)The p-value would be smaller.
سؤال
سؤال
Use the following information for following questions:. The roads in a particular state are in very poor condition, but the state claims that it does not have enough money to repair the roads.
A proposal is on the ballot to raise the sales tax in the state from 6% to 7% to pay for repairing the roads. A month before the election, a survey of likely voters is taken. A random sample of 500 likely voters under the age of 30 is selected, a random sample of 500 likely voters aged 30-49 is selected, and a random sample of 500 likely voters aged 50 or more is selected. Each likely voter is asked whether he/she is in favor of the increase in the sales tax or not.
Choose the correct hypotheses to test whether there is an association between the response to whether to increase the sales tax or not and age.
A)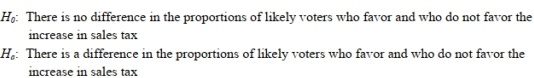
B)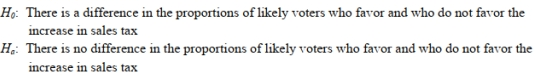
C)
D)
سؤال
سؤال
The American Academy of Pediatrics recommends breast milk as the best nutrition for infants. A survey was conducted to see if pregnant women in their last trimester of pregnancy planned to breast feed their babies. It was thought that the income level of the women might be related to whether they planned to breast feed or not. The table below shows the results of the study: 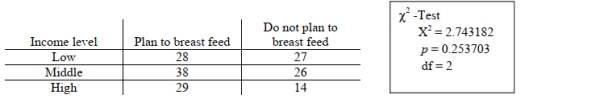 Assume that all conditions for testing have been met. This was an observational study of randomly selected pregnant women in their last trimester of pregnancy. Test whether there is an association between whether a woman plans to breast feed her baby or not and her income level, using a significance level of 0.05. Choose the correct decision and conclusion regarding the null hypothesis that no association exists. Refer to the computer output above.
A)Reject the null hypothesis; income level and plan to breast feed are not associated.
B)Reject the null hypothesis; income level and plan to breast feed are associated.
C)Fail to reject the null hypothesis; income level and plan to breast feed are associated.
D)Fail to reject the null hypothesis; income level and plan to breast feed are not associated.
Assume that all conditions for testing have been met. This was an observational study of randomly selected pregnant women in their last trimester of pregnancy. Test whether there is an association between whether a woman plans to breast feed her baby or not and her income level, using a significance level of 0.05. Choose the correct decision and conclusion regarding the null hypothesis that no association exists. Refer to the computer output above.A)Reject the null hypothesis; income level and plan to breast feed are not associated.
B)Reject the null hypothesis; income level and plan to breast feed are associated.
C)Fail to reject the null hypothesis; income level and plan to breast feed are associated.
D)Fail to reject the null hypothesis; income level and plan to breast feed are not associated.
سؤال
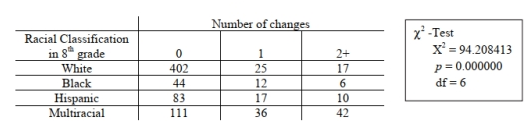
Test the hypothesis that the number of changes in racial classification is associated with students" racial classification in eighth grade, using a significance level of 0.05. Choose the correct decision regarding the null hypothesis and decision. Refer to the computer output above.
A)

B)

C)

D)

سؤال
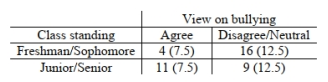
Use the following information to answer questions (18) - (19). Bullying is a problem faced by many schools. To see if student perceptions of how well a high school is doing in dealing with bullying are related to class standing, a small survey was taken. Forty students were randomly selected from Central High School and asked their level of agreement to the following statement: "Central High School is doing a good job dealing with bullying in the school." The numbers in the parentheses are the expected values if "view on bullying" and "class standing" are independent. 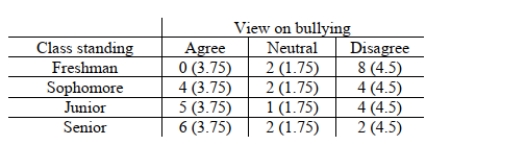
Suppose the cells in the above table are collapsed so that the new table is as follows:
Expected values for each of the new cells are listed in the table in parentheses. Compute the value of the chi-square test statistic rounded to 2 decimal places.
A)
B)
C)
D)
Suppose the cells in the above table are collapsed so that the new table is as follows:
Expected values for each of the new cells are listed in the table in parentheses. Compute the value of the chi-square test statistic rounded to 2 decimal places.
A)
B)
C)
D)
سؤال
Use the following information to answer questions (18) - (19). Bullying is a problem faced by many schools. To see if student perceptions of how well a high school is doing in dealing with bullying are related to class standing, a small survey was taken. Forty students were randomly selected from Central High School and asked their level of agreement to the following statement: "Central High School is doing a good job dealing with bullying in the school." The numbers in the parentheses are the expected values if "view on bullying" and "class standing" are independent.
Suppose we want to test to see if there is an association between class standing and view on bullying. Choose the statement that is true about the hypothesis test or choose (d) if all statements are false.
A)The chi-square test is appropriate because two observed values are greater than 5.
B)The chi-square test is appropriate because only one observed value is 0.
C)The chi-square test is not appropriate because some of the expected cell counts are less than 5.
D)All statements are false.

فتح الحزمة
قم بالتسجيل لفتح البطاقات في هذه المجموعة!
Unlock Deck
Unlock Deck
1/35
العب
ملء الشاشة (f)
Deck 10: Associations Between Categorical Variables
1
Use the following table to answer questions (1) - (4). The following table summarizes the results of a study to determine if job satisfaction is related to pay category.
How many categorical variables are summarized in the table?
A)One
B)Two
C)Three
D)Four
How many categorical variables are summarized in the table?
A)One
B)Two
C)Three
D)Four
Two
2
Use the following table to answer questions (1) - (4). The following table summarizes the results of a study to determine if job satisfaction is related to pay category.
The proportion of hourly employees is about 0.733. If the variables are independent, what is the expected number of hourly employees who are dissatisfied with their jobs.
A)0.733(1310)
B)0.733()174
C)0.733()194
D)0.733(20)
The proportion of hourly employees is about 0.733. If the variables are independent, what is the expected number of hourly employees who are dissatisfied with their jobs.
A)0.733(1310)
B)0.733()174
C)0.733()194
D)0.733(20)
0.733()194
3
Suppose a random sample of 1,105 adults were asked about their opinion regarding salaries of full-time employees at a local state funded university. Respondents were asked whether salaries at the university were (a) too low, (b) adequate, or (c) too high. Respondents were also classified by income level. State the correct hypothesis to test whether there is an association between the response to the questions and income level.
H0: Among adults, opinions about state-funded university salaries for full-time employees and income level are independent. Ha: Among adults, opinions about state-funded university salaries for full-time employees and income level are associated.
4
Package design is an important marketing tool, especially when marketing to children. The same food was presented to children using three different packaging designs. Each child was asked to select his or her favorite. In a taste test among 243 children, 55 selected package A as tasting best, 112 selected package B as tasting best, and 76 selected package C as tasting best.If there is no difference in the products in the 3 package designs, how many children out of the 243 would you expect to pick package B as tasting best?
A)112
B)61
C)121
D)81
A)112
B)61
C)121
D)81
فتح الحزمة
افتح القفل للوصول البطاقات البالغ عددها 35 في هذه المجموعة.
فتح الحزمة
k this deck
5
Suppose a random sample of 1,105 adults were asked about their opinion regarding salaries of full-time employees at a local state funded university. Respondents were asked whether salaries at the university were (a) too low, (b) adequate, or (c) too high. Respondents were also classified by income level. If we wanted to test whether there was an association between the response to the question and income level, would this be a test of homogeneity or of independence?
فتح الحزمة
افتح القفل للوصول البطاقات البالغ عددها 35 في هذه المجموعة.
فتح الحزمة
k this deck
6
Package design is important marketing tool, especially when marketing to children. The same food was presented to children using three different packaging designs. Each child was asked to select his or her favorite.In a taste test among 267 children, 68 selected package A as tasting best, 105 selected package B as tasting best, and 94 selected package C as tasting best. If there is no difference in the products in the 3 package designs, how many children out of the 267 would you expect to pick package B as tasting best?
A)105
B)128
C)89
D)133
A)105
B)128
C)89
D)133
فتح الحزمة
افتح القفل للوصول البطاقات البالغ عددها 35 في هذه المجموعة.
فتح الحزمة
k this deck
7
Suppose a researcher was interested in learning more about high school seniors' concerns about the future. The researcher asks the 750 randomly selected female high school seniors and the 800 randomly selected male high school seniors to rate their level of concern with the following statement: I am (a) not at all concerned (b) somewhat concerned or (c) very concerned about getting accepted into a two or four year college. If we wanted to test whether there was an association between the response to the question and the gender of the high school senior, would this be a test of homogeneity or independence?
فتح الحزمة
افتح القفل للوصول البطاقات البالغ عددها 35 في هذه المجموعة.
فتح الحزمة
k this deck
8
Use the following table to answer questions (1) - (4). The following table summarizes the results of a study to determine if job satisfaction is related to pay category.
What fraction of salaried employees are satisfied with their jobs?
A)
B)
C)
D)
What fraction of salaried employees are satisfied with their jobs?
A)
B)
C)
D)
فتح الحزمة
افتح القفل للوصول البطاقات البالغ عددها 35 في هذه المجموعة.
فتح الحزمة
k this deck
9
Suppose a random sample of 1,220 U. S. adults were asked about their opinion regarding federal spending on infrastructure (i.e. roads and bridges). Respondents were asked whether federal spending on infrastructure was (a) too low, (b) adequate, or (c) too high. Respondents were classified by income level. Choose the correct hypotheses to test whether there is an association between the response to the question and income level.
A)H0 : There is no difference between the proportions of U.S.adults who responded (a), (b) or (c) to the opinion question.
Ha: There is a difference between the proportions of U.S.adults who responded (a), (b) or (c)
To the opinion question.
B)H0 : Among U.S.adults, opinions about federal spending on infrastructure and income level are associated.
Ha: Among U.S.adults, opinions about federal spending on infrastructure and income level are
Independent.
C)H0: Among U.S.adults, opinions about federal spending on infrastructure and income level are independent.
Ha: Among U.S.adults, opinions about federal spending on infrastructure and income level are
Associated.
D)None of the above
فتح الحزمة
افتح القفل للوصول البطاقات البالغ عددها 35 في هذه المجموعة.
فتح الحزمة
k this deck
10
Use the following information for following questions:. Almas caviar is a very expensive Iranian
brand of Beluga sturgeon caviar. A one pound gold-plated tin typically costs $12,000 or more. In a blind
taste test, a group of food experts tasted four premium Beluga sturgeon caviars, with the most expensive
one being Almas caviar. When asked to pick the most expensive caviar, 141 got it right and 79 got it
wrong.
Calculate the observed value of the chi-square statistic to test whether the proportion of people selecting the correct brand as most expensive differs from chance. Show all your work. Round to the nearest hundredth.
فتح الحزمة
افتح القفل للوصول البطاقات البالغ عددها 35 في هذه المجموعة.
فتح الحزمة
k this deck
11
Use the following information for following questions:. Almas caviar is a very expensive Iranian
brand of Beluga sturgeon caviar. A one pound gold-plated tin typically costs $12,000 or more. In a blind
taste test, a group of food experts tasted four premium Beluga sturgeon caviars, with the most expensive
one being Almas caviar. When asked to pick the most expensive caviar, 141 got it right and 79 got it
wrong.
If this group were just guessing, how many people (out of 220) would be expected to guess correctly?
فتح الحزمة
افتح القفل للوصول البطاقات البالغ عددها 35 في هذه المجموعة.
فتح الحزمة
k this deck
12
Suppose a random sample of 1,220 U. S. adults were asked about their opinion regarding federal spending on infrastructure (i.e. roads and bridges). Respondents were asked whether federal spending on infrastructure was (a) too low, (b) adequate, or (c) too high. Respondents were classified by income level. If we wanted to test whether there was an association between the response to the question and income level, would this be a test of homogeneity or of independence?
A)Homogeneity
B)Independence
A)Homogeneity
B)Independence
فتح الحزمة
افتح القفل للوصول البطاقات البالغ عددها 35 في هذه المجموعة.
فتح الحزمة
k this deck
13
Choose the statement that is not true about the chi-square test or choose (d) if all the statements are true.
A)The test statistic is the same for a test of homogeneity or a test for independence, it is chi-square (X 2 ) .
B)To conduct a chi-square test you must have a large enough sample.This condition is met if each expected value is 5 or more.
C)The conclusion of a chi-square test tells whether the variables under study are associated and how they are associated.
D)All of the above statements are true.
فتح الحزمة
افتح القفل للوصول البطاقات البالغ عددها 35 في هذه المجموعة.
فتح الحزمة
k this deck
14
Suppose a researcher was interested in learning more about parents' concerns when their children start elementary school. The researcher asks the parents of 800 randomly selected first graders in rural school district and the parents of 950 randomly selected first graders in an urban school district to rate their level of concern with the following statement: We are (a) not at all concerned (b) somewhat concerned or (c) very concerned about the nutrition level of school lunches. If we wanted to test whether there was an association between the response to the question and the type of school district that the first grader was attending, would this be a test of homogeneity or of independence?
A)Homogeneity
B)Independence
A)Homogeneity
B)Independence
فتح الحزمة
افتح القفل للوصول البطاقات البالغ عددها 35 في هذه المجموعة.
فتح الحزمة
k this deck
15
Use the following table to answer questions (1) - (4). The following table summarizes the results of a study to determine if job satisfaction is related to pay category.
What fraction represents the fraction of people in the study who were satisfied with their jobs?
A)
B)
C)
D)
What fraction represents the fraction of people in the study who were satisfied with their jobs?
A)
B)
C)
D)
فتح الحزمة
افتح القفل للوصول البطاقات البالغ عددها 35 في هذه المجموعة.
فتح الحزمة
k this deck
16
Compare the sampling distributions of the normally distributed test statistic z and the chi-square test statistic. Specifically, how do the sampling distributions differ in shape and range of values?
فتح الحزمة
افتح القفل للوصول البطاقات البالغ عددها 35 في هذه المجموعة.
فتح الحزمة
k this deck
17
Describe at least one advantage and one disadvantage of combining categories as was done in the previous question.
فتح الحزمة
افتح القفل للوصول البطاقات البالغ عددها 35 في هذه المجموعة.
فتح الحزمة
k this deck
18
Suppose a goodness-of-fit test is used to test the claim that obesity rates in the elderly have changed since the time of the Egyptian mummies. The p-value is calculated to be 0.00023. Describe the value of the chi-square test statistic (is it likely to be large? small?) and the decision regarding the null hypothesis that there is no difference in obesity rates for mummies and modern-day elderly people.
فتح الحزمة
افتح القفل للوصول البطاقات البالغ عددها 35 في هذه المجموعة.
فتح الحزمة
k this deck
19
Of the following statements, which one is true about the chi-square statistic and p-value? Choose (d) if all statements are true.
A)The p-value for the chi-square distribution is the area under the curve to the right of the observed chi-square statistic.
B)The larger the chi-square statistic, the larger the p-value.
C)Under the assumption that the null hypothesis is true, the p-value is the probability that the chi- square statistic will be as small as or smaller than the observed value.
D)All of the above statements are true.
فتح الحزمة
افتح القفل للوصول البطاقات البالغ عددها 35 في هذه المجموعة.
فتح الحزمة
k this deck
20
Choose the statement that is not true about Fisher's Exact Test or choose (d) if all the statements are true.
A)When sample size is small resulting in expected cell counts that are less than 5, Fisher's Exact Test is one option that can be used to conduct a hypothesis test.
B)Fisher's Exact Test can be used for tables with more than two rows or columns.
C)With Fisher's Exact Test an exact p-value can be calculated instead of using an approximation for the p-value as is the case with the chi-square test.
D)All of the above statements are true.
فتح الحزمة
افتح القفل للوصول البطاقات البالغ عددها 35 في هذه المجموعة.
فتح الحزمة
k this deck
21
In 2004, voters in the state of Michigan approved a constitutional amendment that banned same-sex marriage and civil unions in the state. To see if voter sentiment has changed over the years, a survey of 500 registered Michigan voters was taken. Each voter was asked his/her opinion on same-sex relationships with the following options: (a) same-sex marriage should be legalized, (b) same-sex unions should be legalized, (c) no same-sex relationships should be legalized, or (d) no opinion. Each voter was also classified by sex. If we wanted to test whether there was an association between the response to the question and sex, would this be a test of homogeneity or of independence?
A)Homogeneity
B)Independence
A)Homogeneity
B)Independence
فتح الحزمة
افتح القفل للوصول البطاقات البالغ عددها 35 في هذه المجموعة.
فتح الحزمة
k this deck
22
Use the following information for following questions:. The roads in a particular state are in very poor condition, but the state claims that it does not have enough money to repair the roads.
A proposal is on the ballot to raise the sales tax in the state from 6% to 7% to pay for repairing the roads. A month before the election, a survey of likely voters is taken. A random sample of 500 likely voters under the age of 30 is selected, a random sample of 500 likely voters aged 30-49 is selected, and a random sample of 500 likely voters aged 50 or more is selected. Each likely voter is asked whether he/she is in favor of the increase in the sales tax or not.
If we want to test whether there is an association between the response to the tax increase and age, would this be a test of homogeneity or of independence?
A)Homogeneity
B)Independence
فتح الحزمة
افتح القفل للوصول البطاقات البالغ عددها 35 في هذه المجموعة.
فتح الحزمة
k this deck
23
Choose the statement that is not true about the chi- square test or choose (d) if none of the statements is true.
A)To conduct a chi-square test you must have a large enough sample.This condition is met if each of the observed cells is 5 or more.
B)To conduct a chi-square test you must have a large enough sample.This condition is met if the sample size is at least 40.
C)The conclusion of a chi-square test tells us whether the variables are associated as well as how they are associated.
D)None of the above statements are true.
فتح الحزمة
افتح القفل للوصول البطاقات البالغ عددها 35 في هذه المجموعة.
فتح الحزمة
k this deck
24
In many pharmaceutical studies, about 16% of all adult volunteers who take placebos (but who are told they have taken a cold remedy) reported that they suffered side effects of drowsiness, stomach upset, or headaches. A study was run on 250 children aged 8 to 12 to see if the results for children differ from those for adults. Below is a summary of the experiment conducted with 250 children aged 8 to 12 and the output for the goodness-of-fit test.
Choose the correct null and alternative hypotheses.
A)
B)
C)
D)
Choose the correct null and alternative hypotheses.
A)
B)
C)
D)
فتح الحزمة
افتح القفل للوصول البطاقات البالغ عددها 35 في هذه المجموعة.
فتح الحزمة
k this deck
25
Typically the percentage of women in an engineering class at a particular university has been 15%. A new recruiting plan was implemented in the past year to increase the proportion of women in the incoming class. This year, there were 49 women and 208 men in the incoming class. The data are summarized below. Calculate the observed value of the chi-square statistic. Round to the nearest hundredth.
A)3.33
B)2.75
C)218.41
D)98.37
Calculate the observed value of the chi-square statistic. Round to the nearest hundredth.A)3.33
B)2.75
C)218.41
D)98.37
فتح الحزمة
افتح القفل للوصول البطاقات البالغ عددها 35 في هذه المجموعة.
فتح الحزمة
k this deck
26
A traffic study found that of 676 automobiles entering a busy intersection during the period from 6 A.M. to 9 A.M., 257 turned left, 221 turned right, and 198 drove straight through the intersection. Below is a summary of the data and the output for the goodness-of-fit test.
Test the hypothesis that the traffic is not equally divided among the three directions. Using a goodness-of-fit test and a 0.05 level of significance, choose the correct decision regarding the null hypothesis and conclusion statement.
A) Fail to reject H0; There is enough evidence to conclude that the traffic is equally divided among the three directions
B) Fail to reject H0; There is enough evidence to conclude that the traffic is not equally divided among the three directions
C) Reject H0; There is enough evidence to conclude that the traffic is equally divided among the three directions
D) Reject H0; There is enough evidence to conclude that the traffic is not equally divided among the three directions
فتح الحزمة
افتح القفل للوصول البطاقات البالغ عددها 35 في هذه المجموعة.
فتح الحزمة
k this deck
27
Recently, many states have been considering legalizing the use of marijuana. A survey was taken last year where adults in one state were asked if they favored legalizing the use of marijuana. The following table displays the percentage of adults in the state who favor and who do not favor the legalization of marijuana for both males and females: Choose the reason(s) why you cannot perform a chi-square test on the data.
A)The percentages do not add up to 100%.
B)There is not enough information to convert the percentages to counts.
C)The samples were not randomly selected
D)All of the above
Choose the reason(s) why you cannot perform a chi-square test on the data.A)The percentages do not add up to 100%.
B)There is not enough information to convert the percentages to counts.
C)The samples were not randomly selected
D)All of the above
فتح الحزمة
افتح القفل للوصول البطاقات البالغ عددها 35 في هذه المجموعة.
فتح الحزمة
k this deck
28
Genetically modified food has generated much controversy as to whether it is safe for humans to consume. A recent study was conducted to see if age is related to how a person views genetically modified food. The results appear in the following table: The alternative hypothesis is that age and view on genetically modified foods are associated. The p- value for Fisher's Exact Test with these data is 0.1748. Suppose the study had turned out differently, as in the following table. Would the p-value for Fisher's Exact Test be larger or smaller than 0.1748?
A)The p-value would be larger.
B)The p-value would be smaller.
The alternative hypothesis is that age and view on genetically modified foods are associated. The p- value for Fisher's Exact Test with these data is 0.1748. Suppose the study had turned out differently, as in the following table. Would the p-value for Fisher's Exact Test be larger or smaller than 0.1748?A)The p-value would be larger.
B)The p-value would be smaller.
فتح الحزمة
افتح القفل للوصول البطاقات البالغ عددها 35 في هذه المجموعة.
فتح الحزمة
k this deck
29
Choose the statement about Fisher's Exact Test that is true or choose (d) if none of the statements is true.
A)Fisher's Exact test can only be used with tables that have two rows and two columns.
B)The p-value calculated for Fisher's Exact test is always the same as the p-value associated with a chi-square test.
C)If one or more of the expected cell sizes is less than 5, Fisher's Exact test is one option that can be used to conduct a test of hypothesis.
D)None of the above statements is true.
فتح الحزمة
افتح القفل للوصول البطاقات البالغ عددها 35 في هذه المجموعة.
فتح الحزمة
k this deck
30
Use the following information for following questions:. The roads in a particular state are in very poor condition, but the state claims that it does not have enough money to repair the roads.
A proposal is on the ballot to raise the sales tax in the state from 6% to 7% to pay for repairing the roads. A month before the election, a survey of likely voters is taken. A random sample of 500 likely voters under the age of 30 is selected, a random sample of 500 likely voters aged 30-49 is selected, and a random sample of 500 likely voters aged 50 or more is selected. Each likely voter is asked whether he/she is in favor of the increase in the sales tax or not.
Choose the correct hypotheses to test whether there is an association between the response to whether to increase the sales tax or not and age.
A)
B)
C)
D)
فتح الحزمة
افتح القفل للوصول البطاقات البالغ عددها 35 في هذه المجموعة.
فتح الحزمة
k this deck
31
Of the following statements, which one is true about the chi-square statistic and p-value? Choose (d) if all statements are true.
A)The p-value for the chi-square distribution is the area under the curve to the left of the chi-square statistic.
B)Under the assumption that the null hypothesis is true, the p-value is the probability that the chi- square statistic will be as small as or smaller than the observed value.
C)The larger the chi-square statistic, the smaller the p-value.
D)All of the above statements are true.
فتح الحزمة
افتح القفل للوصول البطاقات البالغ عددها 35 في هذه المجموعة.
فتح الحزمة
k this deck
32
The American Academy of Pediatrics recommends breast milk as the best nutrition for infants. A survey was conducted to see if pregnant women in their last trimester of pregnancy planned to breast feed their babies. It was thought that the income level of the women might be related to whether they planned to breast feed or not. The table below shows the results of the study: Assume that all conditions for testing have been met. This was an observational study of randomly selected pregnant women in their last trimester of pregnancy. Test whether there is an association between whether a woman plans to breast feed her baby or not and her income level, using a significance level of 0.05. Choose the correct decision and conclusion regarding the null hypothesis that no association exists. Refer to the computer output above.
A)Reject the null hypothesis; income level and plan to breast feed are not associated.
B)Reject the null hypothesis; income level and plan to breast feed are associated.
C)Fail to reject the null hypothesis; income level and plan to breast feed are associated.
D)Fail to reject the null hypothesis; income level and plan to breast feed are not associated.
Assume that all conditions for testing have been met. This was an observational study of randomly selected pregnant women in their last trimester of pregnancy. Test whether there is an association between whether a woman plans to breast feed her baby or not and her income level, using a significance level of 0.05. Choose the correct decision and conclusion regarding the null hypothesis that no association exists. Refer to the computer output above.A)Reject the null hypothesis; income level and plan to breast feed are not associated.
B)Reject the null hypothesis; income level and plan to breast feed are associated.
C)Fail to reject the null hypothesis; income level and plan to breast feed are associated.
D)Fail to reject the null hypothesis; income level and plan to breast feed are not associated.
فتح الحزمة
افتح القفل للوصول البطاقات البالغ عددها 35 في هذه المجموعة.
فتح الحزمة
k this deck
33
Test the hypothesis that the number of changes in racial classification is associated with students" racial classification in eighth grade, using a significance level of 0.05. Choose the correct decision regarding the null hypothesis and decision. Refer to the computer output above.
A)
B)
C)
D)
فتح الحزمة
افتح القفل للوصول البطاقات البالغ عددها 35 في هذه المجموعة.
فتح الحزمة
k this deck
34
Use the following information to answer questions (18) - (19). Bullying is a problem faced by many schools. To see if student perceptions of how well a high school is doing in dealing with bullying are related to class standing, a small survey was taken. Forty students were randomly selected from Central High School and asked their level of agreement to the following statement: "Central High School is doing a good job dealing with bullying in the school." The numbers in the parentheses are the expected values if "view on bullying" and "class standing" are independent.
Suppose the cells in the above table are collapsed so that the new table is as follows:
Expected values for each of the new cells are listed in the table in parentheses. Compute the value of the chi-square test statistic rounded to 2 decimal places.
A)
B)
C)
D)
Suppose the cells in the above table are collapsed so that the new table is as follows:
Expected values for each of the new cells are listed in the table in parentheses. Compute the value of the chi-square test statistic rounded to 2 decimal places.
A)
B)
C)
D)
فتح الحزمة
افتح القفل للوصول البطاقات البالغ عددها 35 في هذه المجموعة.
فتح الحزمة
k this deck
35
Use the following information to answer questions (18) - (19). Bullying is a problem faced by many schools. To see if student perceptions of how well a high school is doing in dealing with bullying are related to class standing, a small survey was taken. Forty students were randomly selected from Central High School and asked their level of agreement to the following statement: "Central High School is doing a good job dealing with bullying in the school." The numbers in the parentheses are the expected values if "view on bullying" and "class standing" are independent.
Suppose we want to test to see if there is an association between class standing and view on bullying. Choose the statement that is true about the hypothesis test or choose (d) if all statements are false.
A)The chi-square test is appropriate because two observed values are greater than 5.
B)The chi-square test is appropriate because only one observed value is 0.
C)The chi-square test is not appropriate because some of the expected cell counts are less than 5.
D)All statements are false.
فتح الحزمة
افتح القفل للوصول البطاقات البالغ عددها 35 في هذه المجموعة.
فتح الحزمة
k this deck
فتح الحزمة
افتح القفل للوصول البطاقات البالغ عددها 35 في هذه المجموعة.


